F U L L P A P E R
Open Access
Numerical simulations to account for boulder
movements on Lanyu Island, Taiwan: tsunami or
storm?
Mamoru Nakamura
*, Yasuhisa Arashiro and Shota Shiga
Abstract
Boulders that originated from the Holocene coral terrace and coral reef are distributed on the coral terrace or talus on the shore of Lanyu Island, Taiwan. We employed numerical simulation of storm waves and estimated whether the boulders could be moved by storm waves with a return period of 50 years, by larger storm waves with return periods of hundreds of years, or by tsunamis. The coral boulders are distributed between 36 and 128 m from the shoreline at elevations of 2.7 to 9.3 m. The sizes of the boulders are in the range 0.3 to 6.4 m. The boulder volume anda-axis length versus distance from the shore show weak and moderate correlation (r= 0.21 and 0.48), respectively. We reproduced the runup of waves using the equation of continuity for a two-dimensional non-compressive fluid and the Navier-Stokes formula. In order to handle the free surface of the fluid, the volume of fluid method was applied. For the flow velocity to move the boulder, we employed the theoretical formula for the transport of boulders. We used the wave height for a return period of 50 years and set the height of the input wave to 13.1 m. The results show that all the large boulders on Lanyu Island could be moved by storm waves with a return period of 50 years. Moreover, the computations show that most of the boulders could not have been transported by tsunamis generated by the Mw8.7 earthquakes. The ages of two boulders indicate that they were transported after 340 and 6,330 years ago. If these boulders were moved by tsunamis several hundred years ago, they would have been relocated subsequently by storm waves.
Keywords:Tsunami boulders; Boulder transport; Storm; Taiwan; Lanyu Island
Background
Analysis of past tsunami sediments is one of the most important tools for past tsunami reconstruction. The identification of a tsunami deposit is often based on the identification of anomalous sand deposits found in peat or mud that was deposited in low-energy environments such as coastal ponds, lakes, and marshes.
Boulders are an indicator of high-energy events such as tsunamis or storms (e.g., Simkin and Fiske 1983; Harmelin-Vivien and Laboute 1986; Goff et al. 2006; Goto et al. 2009, 2010a, b; Mastronuzzi and Pignatelli 2012). Boulders of Holocene coral limestone that had been transported by tsunamis were distributed on the beach and land areas of the south Ryukyu Islands (Kawana and Nakata 1994; Goto et al. 2010b). Based on dating of
fossil coral on the boulders, the historical occurrences of several huge tsunamis were estimated on the south Ryukyu Islands (Kawana and Nakata 1994; Goto et al. 2010b; Araoka et al. 2013).
A coral reef surrounds the Ryukyu Islands. Storm waves are broken by the reef, and the extreme level of wave en-ergy capable of moving boulders is limited to within 200 m of the reef crest because of the short wavelength of storm waves (Goto et al. 2009). As the width of the reef la-goon is 1,000 to 2,000 m in the south Ryukyu Islands, storm waves that are broken at the reef crest cannot reach shore. However, as the width of the reef lagoon is nar-rower than the typical tsunami wavelength (which is at least several tens of kilometers), tsunami waves could traverse the lagoon to reach the beach. The computed runup height of a tsunami with a reef width of 1,000 m is about half the runup height without a reef (Kunkel et al. 2006). Using the difference of wave energy distribution * Correspondence:mnaka@sci.u-ryukyu.ac.jp
Faculty of Science, University of the Ryukyus, 1 Senbaru, Nishihara-cho, Nakagami-gun, Okinawa 903-0213, Japan
between storms and tsunamis, we can distinguish tsu-nami boulders from boulders in the reef lagoon area (Goto et al. 2010a, b).
Eastern Taiwan is a typical convergent plate boundary, where the Luzon Arc on the Philippine Sea plate is col-liding with the Eurasian continental margin (Figure 1). Global Positioning System (GPS) observations indicate that the Philippine Sea plate is moving to the northwest at a rate of about 88 mm/year relative to the Chinese continental margin (Yu et al. 1997). Active faults are dis-tributed both in the Taiwan Island area and in the off-shore area to the east of Taiwan (Shyu et al. 2005); the most active type of fault in the offshore area is the re-verse fault.
The western extension of the Ryukyu subduction zone terminates in the northeastern Taiwan region. A histor-ical tsunami occurred in 1771 along the southwestern Ryukyu Trench (Nakamura 2009; Goto et al. 2010b). The wide interplate coupling area has been estimated in the southwestern Ryukyu Trench from GPS measure-ments (Hsu et al. 2012). Hsu et al. (2012) compared the computed surface deformation obtained using the inter-plate coupling model with the observed surface deform-ation by GPS and noted that interplate earthquakes with magnitudes of 7.5 to 8.7 would occur in the southwestern Ryukyu Trench. Traces of at least three paleo-tsunamis
have been reported from the east of Taiwan (Matta et al. 2010; Ota 2013). However, the source faults and the mag-nitudes of the earthquakes are not known.
Here, we focus on Lanyu Island for the investigation of tsunamis. Lanyu Island is located about 90 km southeast of Taiwan (Figure 1). It is underlain by andesitic rocks ranging from 3.5 to 1.4 Ma (Yang et al. 1995, 1996) and is surrounded by coral reef terraces at several elevations from mean sea level that developed from the Pleistocene to the Holocene (Chen and Liu 1992). The lower uplifted coral reefs occur at heights of up to 4 m above mean sea level and encircle almost the entire coastline. Talus de-posits are distributed across almost the entire coastline (Inoue et al. 2011). The lagoons of the coral reef are not well developed around Lanyu Island. The distance from the shoreline to the reef crest is only about 30 m. Boulders of coral are distributed along the shoreline of Lanyu Island. The largest boulder is 6.4 m and is lo-cated about 66 m from the shore on the north coast of the island (Figure 2).
Boulders studded along the shore suggest that historic-ally large tsunamis or large storm waves have struck Lanyu Island, although no historical tsunamis have been reported. However, the boulders might have been trans-ported not by tsunamis, but by storm waves. Therefore, in this paper, we reproduce storm waves using numerical
simulation and clarify whether the boulders could have been transported by storm waves.
Regional setting
Historical tsunamis in Taiwan
Historically, in Taiwan, 18 tsunamis are reported to have struck the east of the island. The most destructive tsu-nami in Taiwan occurred on December 18, 1867, and af-fected the area of Keelung in northern Taiwan. The maximum tsunami height was 7.5 m at Keelung, and this tsunami left hundreds of people dead (Ma and Lee 1997; Mak and Chan 2007; Lau et al. 2010). In contrast, the heights of other historical tsunamis were about 1 m or less. The city most frequently affected by valid tsu-namis is Hualien in eastern Taiwan, which has recorded nine events since 1951. However, these tsunamis were not particularly fatal or disastrous: they were all minor tsunamis detected by tidal gauges.
Additional evidence of historical and/or prehistorical tsunamis in Taiwan is provided by tsunami boulders. Coral boulders are distributed within 30.0 to 76.5 m of the shoreline on the Jiupeng coast of southeastern Taiwan (Matta et al. 2013) (Figure 1). The fossil ages of samples taken from the outer parts of the coral boulders are 4,570 to 5,490 calendar (Cal) years BP, similar to the ages of the underlying Holocene coral terrace (Matta et al. 2013). It is supposed that the coral boulders originated from the Holocene coral terrace and were broken and transported landward by tsunami waves striking the marine terrace.
However, it is impossible to estimate the dates of the asso-ciated tsunamis.
Historical tsunamis on Lanyu Island have not been documented in the literature before 1950. The folklore of Lanyu Island states that ‘After an unusually low tide followed by a big wave, and the island was completely inundated. Goats, pigs, and chickens were killed by the inundation, and people on the island starved and died.’ (Asai and Ogawa 1935).
Small tsunamis have been recorded by the tidal gauge on Lanyu Island since 1950. Two tsunamis with heights of 0.1 m were observed on Lanyu Island, caused by events on July 23, 1978 (22.19°N, 121.42°E; depth: 26 km; Mw 7.0) and May 4, 1998 (22.43°N, 125.37°E; depth: 24 km; Mw 7.5) (Lau et al. 2010).
Typhoons in eastern Taiwan
The shores of eastern Taiwan often receive high storm waves that have been generated by typhoons. Table 1 presents the annual maximum significant wave heights, period, and direction for a 19-year period (1990 to 2008) in Hualien (Figure 1) (Su et al. 2009). This wave analysis was obtained from buoy data used to derive directional wave height and period information in the area offshore of the port in Hualien.
dominant period of 12 s. The predominant wave direc-tion is easterly. The maximum significant wave height during the 19-year period was generated by Typhoon Longwang on October 2, 2005 (significant wave height = 10.8 m, associated period=12 s, direction = ESE). Typhoon Longwang passed Hualien as a category 4-equivalent.
The significant wave heights for the 50- and 100-year periods were estimated using the observed significant wave heights from the 19-year data set from Hualien. The estimated significant wave height is 13.1 and 14.0 m for the 50- and 100-year probability, respectively (Jiang et al. 2011).
Methods
Measurements of topography and boulders
Field surveys on Lanyu Island were performed from Au-gust 31 to September 4, 2012, and from AuAu-gust 30 to September 5, 2013. Along selected survey lines oriented perpendicular to the coastline and starting from the shoreline, cross sections were obtained using azimuth, distance, and elevation measurements taken with a TruPulse
360 laser range finder (Laser Technology, Inc., Centennial, Co, USA). Elevation was measured relative to sea level along each line during the survey and converted to elevation rela-tive to mean sea level. The survey line lengths were almost 200 m.
The positions of the coral boulders were measured by handheld GPS. The dimensions (a-, b-, andc-axis) of the boulders were measured in the field by approximating the boulder shape as a rectangular parallelepiped. Here, thea-,b-, andc-axes are defined as the long, intermediate, and short axes of the boulder, respectively (Nott 2003). Radiocarbon dating was performed for two boulders at Langdao (LD) and Longmen-Xi (LX).
Estimation of minimum flow velocity
When flow velocity increases, boulders are transported by sliding, rolling, and saltation (Nott 2003; Nandasena et al. 2011). The magnitude of the flow velocity required to initiate movement of the boulder depends on the size of the boulder, its density, and the angle of the bed slope. To estimate the flow velocities required to move the boul-ders, we employed the formula of Nandasena et al. (2011). The hydrodynamic equations by Nandasena et al. (2011) follows.
whereρwandρsrepresent the density of the water and
boulder, respectively;a,b, and care the long, intermedi-ate, and short axes of the boulder, respectively; Cd and Cl are the coefficient of drag and coefficient of lift,
re-spectively; θ is the angle of the slope bed; and g is the gravitational acceleration. The boulder is isolated, de-tached, and not buttressed, and the depth of water flow is higher than the height of the boulder and the flow vel-ocity is depth averaged.
In the work of Nott (2003), the equations of initial flow velocity for submerged boulders and subaerial boul-ders were different. However, Nandasena et al. (2011) identified formularization problems for the subaerial case of Nott (2003), and they showed that the equations for both submerged boulders and subaerial boulders are the same (Equation 10 in Nandasena et al. (2011)). Table 1 Annual maximum Hs and Tp and direction for
Hualien during 1990 to 2008 (Su et al. 2009)
Hs (m) Tp (s) Direction Year Month/day
10.2 14 * 1990 6/23
10.8 12 ESE 2005 10/2
5.3 8 SE 2006 7/14
Therefore, we estimated the initial flow velocity with-out classifying the boulders as either submerged or subaerial. Moreover, the equations by Nandasena et al. (2011) exclude the inertia force because the effect of the inertia force would be small compared to that of the drag force.
The densities of the seawater and boulder were taken as 1,020 and 2,000 kg/m3, respectively. The coefficient of drag and coefficient of lift were set to 1.95 and 0.178, re-spectively (Nandasena et al. 2011), and the angle of the bed slope was set to 3°.
Reproduction of boulder transport using numerical simulation
We reproduced the runup of the waves using the CADMAS-SURF (SUper Roller Flume for Computer Aided Design of MAritime Structure) code (Coastal Development Institute of Technology 2001). This code is based on the equations of continuity for a two-dimensional non-compressive fluid and the Navier-Stokes formula:
∂γxu
wheretis the time;xandzare the horizontal and ver-tical coordinates, respectively; u andw are the horizontal and vertical velocities, respectively;νeis the molecular kine-matic viscosity;γvis the porosity;γxandγzare the horizon-tal and vertical sectional transform ratios, respectively;pis
the pressure;ρis the mass density of the fluid; andgis the acceleration due to gravity.
whereCMis the coefficient of inertia.
The horizontal and vertical drag forces Rx and Rzare as follows: horizontal and vertical mesh sizes for the numerical sim-ulations, respectively. The coefficients of drag force and inertia are set as CD= 1.0 and CM= 1.2, respectively, by following Sakakiyama and Imai (1996).
In order to handle the free surface of the fluid, the vol-ume of fluid (VOF) method (Hirt and Nichols 1981) was applied. The transfer diffusion equation F of the VOF function is:
In this method, the advection equation of the VOF was solved using the donor-acceptor approach.
The input data of the CADMAS-SURF we used were significant wave height and its period, and topography. Output data of that were the wave height and velocity at any place and time. The marine and land areas for the horizontal calculation were set to 300 and 200 m, re-spectively (Figure 3). The vertical calculation area was set to 80 m.
In the numerical simulations, the horizontal and verti-cal mesh sizes of the marine area were set to 1.0 and 0.5 m, respectively. The horizontal and vertical mesh
sizes at the land area were set to 0.5 and 0.25 m, respect-ively. The time interval used in the simulations was calcu-lated automatically based on the Courant-Friedrichs-Lewy condition.
We used the bottom friction law for rough surfaces:
ut
whereutandu*are the horizontal velocity and friction velocity, respectively; y is the distance from the surface; and ksis the roughness of the surface. The value ofksis set to 1.0. This value corresponds to friction of 0.04m−1/3 s in Manning's parameter (n), which is obtained using the approximate formula (Nezu 1995):
n≈ 1 24k
1=6
s ð11Þ
The reef (whose width and depth are 30 and 6 m, re-spectively) was set for the marine bathymetry (Inoue et al. 2011). The topography of the land area was defined based on the results of topography surveys, and we used a fifth-order Stokes wave for the source function.
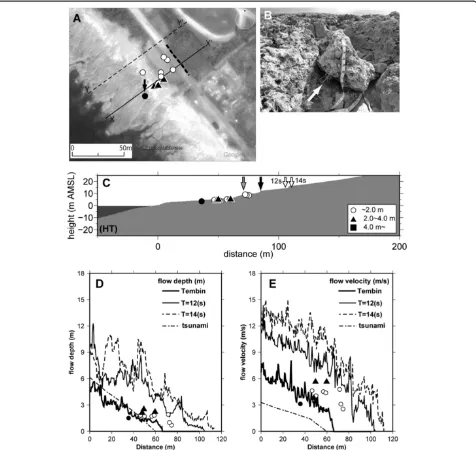
As a test of the numerical simulation, we calculated the runup of the storm waves at Hongtou (HT) by the 2012 typhoon Tembin (Figure 2), which is located in the southwest of Lanyu Island. A maximum runup height of 11.4 m was observed for the 2012 typhoon Tembin. Based on the Grid Point Value coastal wave model of the Japan Meteorological Agency (Global Atmospheric Observation Data 2013), we estimated the significant wave height for Lanyu Island when the typhoon was ap-proaching the island. This height was 2 m on August 26 but increased to over 4 m on August 27. The significant wave height reached a maximum of 6.6 m at 18:00 (UT) on August 28 (Figure 4). For the numerical simulation
of the waves of the 2012 typhoon Tembin, we employed a wave height of 6.6 m and a corresponding period of 12.0 s.
Then, we computed the runup of waves by adopting the wave height for the 50-year return period to estimate the movement of boulders in other areas. The significant wave heights at Hualien port for the 50- and 100-year return periods are 13.1 and 14.0 m, respectively (Jiang et al. 2011). We employed the wave height for the 50-year return period and set the height of the input wave to 13.1 m. Then, we computed the numerical simulation for two different wave periods of 12.0 and 14.0 s, which were based on the observed wave periods corresponding to the annual maximum wave height at Hualien port.
Then, we computed a numerical simulation of a tsu-nami to compare the flow depth and flow velocity caused by a tsunami with those caused by storm waves. For the computation of the tsunami, the nonlinear long wave equations are used as follows:
∂η directions, respectively; η is the water surface elevation; andDis the total water depth.
In the simulations of tsunami propagation, three grid sizes were adopted. The first, second, and third grids had 270, 90, and 30 grid sizes downsized from the 30-arc-sec grid data provided by GEBCO (General Bathy-metric Chart of the Oceans 2010), which covers the area 21.0° to 24.8°N, 120.7° to 125.6°E (Figure 5). The second (90-m grid) and third (30-m grid) areas encompassed 32 × 32 and 13.5 × 13.5 km2covering Lanyu Island. For the second and third areas, the 500-m grid data from GEBCO, an administration district map of Lanyu Island published by the Ministry of the Interior, Taiwan (Minis-try of the Interior 2004), and topography data from the Shuttle Radar Topography Mission (2001) were used. We used a 0.25-s time step for the 270-m grid and a 0.08-s time step for the 90- and 30-m grids. The total Figure 4Significant wave heights off southwest Lanyu Island
calculation time was 3 h after the earthquake's occur-rence. For the Mw8.7 source fault model of Hsu et al. (2012), we employed the fault model of Ando et al. (2013) with values of fault length, width, strike, and dip of 130 km, 70 km, 290°, and 10°, respectively. The slip of the fault was set at 46 m. The rake of the slip was 155°, which indicates a reverse-type fault with a large strike-slip com-ponent. Rigidity was set to 40 GPa.
Results
Size distribution of boulders
We measured 63 coral boulders around Lanyu Island. The boulders were distributed between 36 and 128 m from the shoreline (Figure 6), and their elevations ranged from 2.4 to 9.3 m. The sizes of the boulders ranged from 0.3 to 6.4 m.
The size distribution of the boulders exhibited a landward-fining trend: larger boulders were distributed near the shore and smaller boulders were distributed further inland. Plots of boulder volume and a-axis length versus distance from the shore exhibit weak and moderate correlation (correlation coefficient:r= 0.21 and 0.48), respectively.
Table 2 shows the velocity for each transport mode (sliding, rolling, and saltation), estimated from the size of the boulders. The boulder transport histogram shows that the flow velocities required for sliding, rolling, and saltation are 1.4 to 5.1, 1.6 to 7.3, and 5.7 to 16.9 m/s, respectively. Table 3 shows the computed flow depth
and flow velocity at the position of boulders caused by waves with a return period of 19, 50, and 100 years, re-spectively. The flow depth and flow velocity are 0.2 to 5.9 m and 0.2 to 10.3 m/s for a return period of 19 years but increase to 2.9 to 10.0 m and 5.0 to 13.7 m/s for a return period of 100 years.
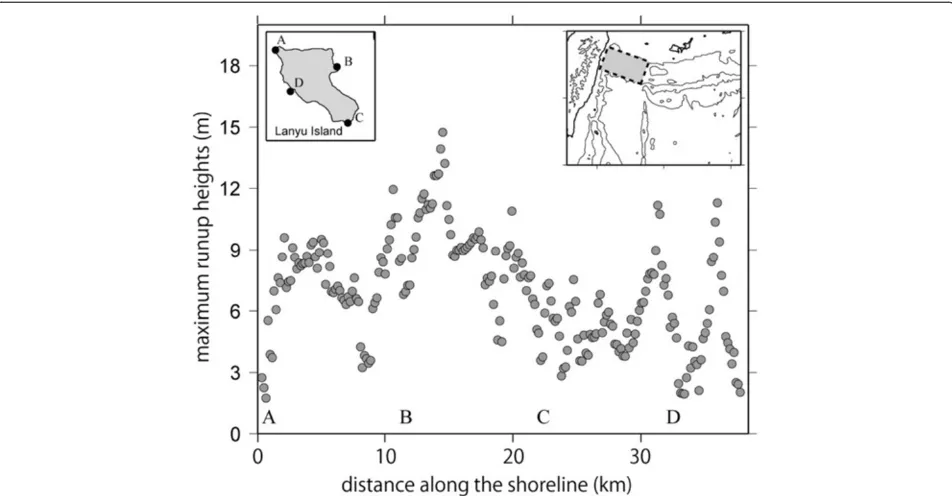
Figure 5Computed runup heights of tsunami along the shore of Lanyu Island by Mw8.7 earthquake.The horizontal axis shows the distance along the shoreline from point A. The inserted figure at the top right shows the numerical simulation area and the tsunami sources used in this study (rectangle).
Results of numerical simulation
Hongtou (HT)
As a test of the numerical simulation, we calculated the runup of the storm waves at HT by the 2012 typhoon Tembin.
HT is located in the southwest of Lanyu Island. The coral reef terrace is distributed at a height of 3 to 5 m above the shore and a distance of 45 m from the shore. The terrace was found to be covered by talus deposits
from a distance of 36 m from the shore (Figure 7A). The boulders were distributed on the coral reef terrace and on the talus deposit beyond the distance of 75 m. The sizes of the boulders ranged from 0.7 to 2.5 m.
The numerical simulation of storm waves by the 2012 typhoon Tembin was employed under conditions where the wave height was 6.6 m and the wave period was 12 s. The computation time for the numerical simulation was set to 120 s (Figure 8). We computed the storm Table 2 Parameters of boulders in the areas where the numerical simulations were employed
ID Location Distance from the shore (m) Elevations (m) a-axis (m) b-axis (m) c-axis (m) Sliding (m/s) Rolling (m/s) Saltation (m/s)
1 HT 75.3 8.8 0.7 0.5 0.3 1.8 2.6 5.7
2 HT 73.4 9.1 1.0 0.7 0.3 2.0 3.1 5.7
3 HT 72.2 9.3 1.9 1.6 0.8 3.1 4.8 9.4
4 HT 57.3 5.4 1.7 1.3 0.5 2.8 4.5 7.4
5 HT 60.2 5.2 2.2 2.1 0.9 3.5 5.7 9.9
6 HT 59.5 5.2 1.8 1.3 0.6 2.8 4.4 8.1
7 HT 50.1 5.1 2.5 2.0 0.5 3.3 5.7 7.4
8 HT 50.6 4.6 1.7 1.1 0.5 2.6 4.1 7.4
9 HT 48.6 4.4 2.1 1.0 0.5 2.5 3.8 7.4
10 HT 36.2 3.7 1.5 0.9 0.7 2.4 3.1 8.8
11 HT 46.9 4.9 1.8 1.6 0.9 3.1 4.7 9.9
12 DX 58.9 4.1 6.4 4.2 2.6 5.1 7.3 16.9
13 EL 54.6 3.9 4.6 1.8 1.2 3.4 4.7 11.5
14 EL 71.1 3.3 2.5 2.4 1.0 3.8 6.1 10.5
15 EL 105.7 7.3 1.0 1.0 0.8 2.5 3.3 9.4
16 EL 101.2 6.4 1.0 0.9 0.6 2.4 3.3 8.1
17 LD 93.0 4.6 2.4 2.3 0.9 3.7 6.0 9.9
18 LD 100.4 4.6 1.3 1.1 0.5 2.6 4.1 7.4
19 LD 123.3 4.7 2.5 0.9 0.7 2.4 3.1 8.8
20 LD 127.9 5.5a 1.1 0.9 0.6 2.4 3.3 8.1
21 LD 126.8 3.9 1.0 0.5 0.4 1.8 2.3 6.6
22 FH 79.9 3.4 3.4 2.8 1.4 4.1 6.4 12.4
23 FH 83.1 3.9 3.5 2.4 0.8 3.7 6.3 9.4
24 FH 98.5 5.2 1.3 1.0 0.5 2.5 3.8 7.4
25 FH 68.2 2.4 2.0 1.0 0.7 2.5 3.4 8.8
26 FH 66.8 3.4 1.3 1.1 0.6 2.6 3.9 8.1
27 FH 62.7 2.6 2.3 0.9 1.1 2.4 2.6 11.0
28 FH 94.2 6.5 1.2 0.5 0.3 1.8 2.6 5.7
29 FH 99.3 4.4 0.9 0.7 0.3 2.0 3.3 5.7
30 LH 61.0 4.4 2.3 1.6 1.3 3.2 4.1 12.0
31 LX 117.4 8.4a 1.2 0.8 0.7 1.8 2.3 6.6
32 LX 117.3 8.6 0.6 0.5 0.4 1.4 1.6 5.7
33 LX 121.9 9.2 0.4 0.3 0.3 1.8 2.3 6.6
34 LX 118.1 9.1 0.7 0.5 0.4 1.6 1.9 6.6
DX, Dong-Xi; EL, East of Langdao; FH, Five-Hole Cave; HT, Hongtou; LD, Langdao; LH, Lighthouse; LX, Longmen-Xi. Locations are shown in Figure2.a
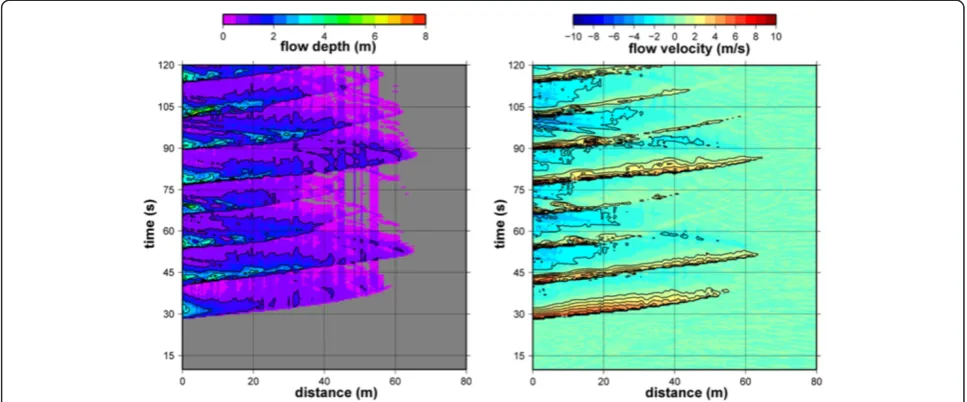
waves using the topography data of different survey lines that were 30 m apart from each other, and we estimated the effects of the differences in the topographical data. The lines X-X' and Y-Y' have similar topographies (Figure 9A) with differences in topography of approximately 1 m (Figure 9B). The computed flow depth and flow vel-ocity of X-X' and Y-Y' have similar trends (Figure 9C, D, respectively), and the runup distances of X-X' and Y-Y' are similar: 66.0 and 69.5 m, respectively. When the reef width was set as 0 m, the distributions of flow
depth and flow velocity were similar to those of the other case, which suggests that small differences in topography would have negligible effects on the results of the numerical simulation. The maximum runup height and flow velocity in the first 120 s were selected. The max-imum flow depth, maxmax-imum flow velocity, and maxmax-imum runup heights were calculated using the maximum value within the computation time. The computed maximum runup heights and inundation distance from the shore under these conditions were 8.7 and 66 m, Table 3 Computed flow depth and flow velocity at the position of boulders by the waves
ID 19-year return period 50-year return period 100-year return period
Flow depth (m) Flow velocity (m/s) Flow depth (m) Flow velocity (m/s) Flow depth (m) Flow velocity (m/s)
1 0.5 1.1 2.1 2.3 3.1 9.7
2 0.6 1.2 1.9 5.9 3.2 10.3
3 0.7 1.3 1.9 6.0 3.3 10.6
4 2.3 5.3 3.8 8.0 6.8 12.7
5 2.5 5.3 3.8 7.7 5.9 12.2
6 2.4 5.3 3.8 7.9 6.1 12.3
7 2.5 6.1 5.6 7.9 7.6 13.1
8 2.4 6.1 5.6 7.8 7.6 13.0
9 2.7 6.2 6.4 8.0 7.5 13.4
10 5.1 7.4 5.9 9.4 9.2 13.7
11 3.0 6.1 6.7 7.9 7.7 13.4
12 4.1 7.2 5.4 9.6 6.4 11.0
13 4.8 9.6 5.4 12.2 7.0 12.7
14 5.3 8.9 5.9 12.1 5.9 12.8
15 2.3 5.5 3.3 7.9 5.7 9.5
16 2.6 6.3 5.0 8.8 6.3 10.1
17 4.0 8.2 4.7 9.9 6.8 10.7
18 4.5 7.5 5.4 9.4 6.1 10.1
19 1.3 4.9 2.4 7.0 4.5 8.3
20 1.3 4.4 2.2 6.9 3.3 8.2
21 1.3 4.5 2.3 6.9 3.4 8.1
22 5.9 9.9 9.4 11.5 10.0 12.3
23 4.4 9.3 8.1 10.8 9.3 11.8
24 3.1 7.1 6.7 9.5 6.8 10.8
25 5.7 10.1 6.4 12.0 8.3 12.6
26 5.3 10.1 6.7 11.5 8.2 12.6
27 5.5 10.3 7.3 11.9 8.3 12.9
28 4.7 8.0 5.2 9.8 6.1 11.5
29 3.1 7.1 6.8 9.5 6.8 10.8
30 5.1 8.5 6.4 10.0 9.3 13.2
31 0.5 0.8 1.1 2.0 2.9 5.3
32 0.5 0.8 1.1 2.0 2.9 5.3
33 0.2 0.2 1.0 1.6 3.0 5.0
respectively (Figure 7C,D). The observed runup height was 11.4 m.
The computed maximum inundation depth was 6 m at the shore and decreased inland. The maximum flow velocity was 9 m/s at the shore and this, too, decreased inland. Here, we estimated the maximum flow velocity
by averaging the flow velocity from the inundated sur-face to the bottom.
The flow velocity (5.0 m/s) at the distance of 36 m is only larger than the flow velocity (3.1 m/s) necessary to cause boulders at that location to move by rolling (Figure 7E).
Figure 8Space-time distribution of flow depth (left) and flow velocity (right) for the case at HT.
The boulder at the distance of 36 m was marked, which suggests rolling transportation by the waves of the typhoon. The boulder also held some grass that ap-peared to be growing downwards (Figure 7B), suggesting that the boulder had recently been moved by rolling. Such marks were not found on the other boulders. If the boulders were to move by sliding, a flow velocity of 1.8 to 3.5 m/s would be required. As the computed flow vel-ocities were over 3 to 4 m/s at the positions of the boul-ders (distances within 60 m) (Figure 7E), it would be expected that almost all boulders would start to move if boulders were transported by sliding. On the other hand, the boulders would not move within the distance range of 40 to 80 m, but would move at the distance of 36 m, if the mode of transport were rolling (Figure 7E). More-over, if the boulders were to move by saltation, a flow velocity of 5.7 to 9.9 m/s would be required. This flow velocity is larger than the computed flow velocity at the positions of the boulders. Thus, we assume that the boulders moved by rolling. Thus, the calculation could well reproduce the runup of actual storm wave, and the numerical simulation using the CADMAS-SURF is use-ful for the reproduction of storm waves.
The inundation depths and flow velocities at the posi-tions of the boulders (x= 30 to 80 m) were 0.0 to 3.2 m and 0.0 to 2.1 m/s, respectively, and the inundation dis-tance and runup height of the waves were 60 and 6.4 m, respectively.
Dong-Xi (DX)
DX is located in the northeastern part of the island. The coral reef terrace (elevation 2 to 4 m above sea level) is distributed from the shore to at a distance of 70 m (Figure 10A). Talus deposit and sand dunes are distributed in the inland area of DX. A boulder was lo-cated at a distance of 58.9 m from the shore (Figure 10B) and had an a-axis length of 6.4 m. The flow velocity re-quired for rolling was estimated from the size of the boul-der to be 7.3 m/s. The inundation distance and height of the waves at the period of 12 s reached 142 and 10.6 m, respectively (Figure 10C). The computed maximum inun-dation depth at the shore was 12 m, and the maximum flow velocity was 11.9 m/s (Figure 10E). The inundation depth and flow velocity at the position of the boulder were 5.0 m and 9.5 m/s, respectively (Figure 10D,E). The inun-dation distance and runup height of the wave in the wave period of 14 s increased to 175 and 13.9 m, respectively. The inundation depth when the wave period was 14 s was larger than that when the wave period was 12 s.
The inundation depth and flow velocity at the position of the boulder (x= 60 m) caused by the tsunami were 4.3 m and 4.1 m/s, respectively, and the inundation dis-tance and runup height of the waves were 180 and 10.4 m, respectively.
East of Langdao (EL)
EL is located in the north of the island. The coral reef terrace (elevation 3 to 5 m above sea level) is distributed from the shore to a distance of 90 m in EL (Figure 11A). Talus deposit and sand dunes, which are covered by vegetation, are distributed further inland than at DX. Two boulders, whosea-axis lengths were 4.6 and 2.5 m, were located 54.6 and 71.1 m from the shore, respect-ively (Figure 11B). The flow velocities required for roll-ing were estimated from the sizes of the boulders at 4.7 to 6.1 m/s. The inundation distance and height of the waves for the period of 12 s reached 128 and 10.1 m, re-spectively (Figure 11C). The computed maximum inun-dation depth was 7.0 m at the shore (Figure 11D), and the maximum flow velocity was 10.9 m/s (Figure 11E). The inundation depth and flow velocity at the position of the largest boulder were 6 m and 9 m/s, respectively. The inundation distance and runup height of the wave in the wave period of 14 s increased to 168 and 13.4 m, respectively. The inundation depth when the wave period was 14 s was larger than that when the wave period was 12 s.
The inundation depths and flow velocities at the posi-tions of the boulders (x= 60 to 110 m) caused by the tsunami were 5.8 to 6.0 m and 4.1 to 5.5 m/s, respect-ively, and the inundation distance and runup height of the waves were 180 and 9.7 m, respectively.
Langdao (LD)
LD is located just to the west of EL. The coral reef ter-race (elevation 2 to 3 m above sea level) is distributed from the shore to a distance of 80 m (Figure 12A). Sand dunes are distributed inland. The boulders were distrib-uted at distances ranging from 93 to 128 m from the shore. The sizes of boulders were in the range 1.0 to 2.5 m (Figure 12B). Radiocarbon dating of the largest coral boulder at LD returned ages of Cal AD 1670 to 1810 (beta ID = 371293) (Table 2). The flow velocities re-quired for rolling were estimated from the sizes of boul-ders at 2.3 to 6.0 m/s. The inundation distance and runup height of the waves for the period of 12 s reached 142 and 10.2 m, respectively (Figure 12C), and the com-puted maximum inundation depth was 8.1 m at the shore (Figure 12D). The maximum flow velocity was 10.4 m/s at the shore (Figure 12E). The inundation depths and flow velocities at the positions of the boulder were 1 to 3 m and 3 to 6 m/s, respectively. The inunda-tion distance and runup height of the wave for the period of 14 s increased to 190 and 13.2 m, respectively.
Five-Hole Cave (FH)
FH is located in the northwest of the island. The coral reef terrace (elevation 2 to 3 m above sea level) is distributed from the shore to a distance of 60 m (Figure 13A). Sand dunes and talus deposits are distributed in the inland area. The boulders were distributed at distances of 79.9 to 99.3 m. The lengths of thea-axis of the boulders ranged from 0.9 to 3.5 m (Figure 13B). The flow velocities re-quired for rolling were estimated from the sizes of the boulders to be 2.6 to 6.4 m/s (Table 2). The inundation distance and height of the waves for the period of 12 s reached 142 and 10.9 m, respectively (Figure 13C). The computed maximum inundation depth was 8.6 m at the
shore (Figure 13D), and the maximum flow velocity was 12.2 m/s (Figure 13E). The inundation depths and flow velocities at the positions of the boulders were 3 to 9 m and 8 to 9 m/s, respectively. The inundation distance and runup height of the wave for the period of 14 s increased to 164 and 13.9 m, respectively. The inundation depth when the wave period was 14 s was larger than that when the wave period was 12 s.
The inundation depths and flow velocities at the posi-tions of the boulders (x= 60 to 100 m) caused by the tsunami were 1.3 to 2.8 m and 3.8 m/s, respectively, and the inundation distance and runup height of the waves were 180 and 8.6 m, respectively.
Lighthouse (LH)
LH is also located in the northwest of the island. The coral reef terrace (elevation 2 to 5 m above sea level) is distributed from the shore to a distance of 65 m (Figure 14A). Talus deposit is distributed in the inland area. A boulder whose a-axis length was 2.3 m was lo-cated at a distance of 61 m from the shore (Figure 14B). The flow velocity required for rolling was estimated from the size of the boulder to be 4.1 m/s (Table 2). The inundation distance and height of the waves for the period of 12 s reached 112 and 12.3 m, respectively (Figure 14C). The computed maximum inundation depth
was 8.2 m at the shore (Figure 14D), and the maximum flow velocity was 11.2 m/s (Figure 14E). The inunda-tion depth and flow velocity at the posiinunda-tion of the boulder were 6 m and 9 m/s, respectively. The inunda-tion distance and runup height of the wave for the wave period of 14 s increased to 118 and 17.7 m, respectively.
The inundation depths and flow velocities at the posi-tions of the boulders (x= 60 m) caused by the tsunami were 1.6 m and 3.2 m/s, respectively, and the inundation distance and runup height of the waves were 120 and 6.6 m, respectively.
Longmen-Xi (LX)
LX is located in the southeast of the island. The coral reef terrace (elevation 4 to 8 m above sea level) is distributed from the shore to a distance of 90 m (Figure 15A). Sand dunes are distributed in the inland area and talus deposits are distributed as far as 110 m from the shore. The boul-ders were found to be distributed at a distance of 120 m from the shore (Figure 15B,C). The lengths of the a-axis of the boulders were about 1 m or less. Radiocarbon dat-ing of the largest coral boulders at LX returned ages of Cal BC 4320 to 4160 (beta ID = 371294) (Table 2). The flow velocity required for rolling was estimated from the
size of the boulders to be 2.0 m/s. The inundation distance and height of the waves for the period of 12 s reached 105 and 8.0 m, respectively (Figure 15D). The computed max-imum inundation depth was 6.9 m at the shore, and the maximum inundation depth decreased inland (Figure 15E). The maximum flow velocity was 12.8 m/s at the shore (Figure 15F). Waves cannot reach the position of the boul-ders when the wave period is 12 s. However, the inunda-tion depth and flow velocity were 1.3 m and 1.8 m/s, respectively, when the wave period was 14 s; this flow vel-ocity is similar to that required to initiate movement of the boulders.
The inundation depths and flow velocities at the posi-tions of the boulders (x= 120 m) caused by the tsunami were 0.4 m and 0.3 m/s, respectively, and the inundation distance and runup height of the waves were 120 and 12.0 m, respectively.
Discussion
We employed a numerical simulation of storm waves with a 50-year return period on the shore of Lanyu Island and estimated whether the boulders could be moved by the
storm waves. The results showed that all large boulders on the Lanyu Island shore could be moved by storm waves with a 50-year return period.
distance from the reef edge on Kudaka Island. These patterns are controlled by storm waves because the height of storm waves decreases exponentially towards the reef flat (Egashira et al. 1985). On the other hand, a bimodal distribution of boulders is found on Ishigaki Is-land, Ryukyu, which suggests that large tsunamis af-fected the boulders in addition to the storms (Goto et al. 2010b). One distribution is near the reef edge, and the other is far from the reef edge (approximately >700 m). The former is caused by the storm waves and the latter by the tsunamis. If we apply the mechanism of distribution
of boulders on Ryukyu to that on Lanyu Island, the landward-fining boulder size and lack of large boulders far from the shore suggest that the boulders would have been transported by storm waves on Lanyu Island.
Moreover, the possibility that the boulders would be moved by storm waves with a 50-year return period is much greater than the possibility that the boulders would be moved by tsunamis, because the occurrence of tsunamis is rare near Lanyu Island. Tsunamis observed at Lanyu Island since 1950 have typically been about 0.1 m high (Lau et al. 2010). The absence of any signifi-cant tsunamis since that date suggests that tsunamis of equivalent height to storm waves with a 50-year return
event at LX would be estimated as occurring some-time after 6,330 years ago, the detail has not yet been determined.
If the evidence regarding tsunamis in folklore or his-torical documents is reliable, it appears that the boulders in this region were moved by past tsunamis. However, we have no data to suggest that the boulders on Lanyu Island were transported by tsunamis. Thus, we conclude that the boulders were moved by storm waves, particu-larly those associated with typhoons. Based on the nu-merical simulation, the boulders could not have been moved by the tsunamis, but instead could have been moved by storm waves. This suggests that the boulders moved by tsunamis would be relocated by storm waves, if the runup heights of the tsunamis were less than 10 to 15 m, which is almost equal to that of the computed tsunamis.
On the island of Hawaii, basalt boulders reached dis-tances of 300 m from the shore and elevations of 10.4 m (Goff et al. 2006; Richmond et al. 2011). It has been esti-mated that these boulders were moved by a combination of the 1975 Kalapana tsunami, 1868 tsunami, and other past tsunamis and that movement associated with storm waves was limited to distances within 100 m of the shore. The boulder distribution on Lanyu Island shows that most boulders are distributed within a distance of 100 m of the shore. This is consistent with boulders dis-tributed by storm waves on Hawaii Island (Richmond et al. 2011). Weak or moderate correlations between the distance from the shore and the size of boulders suggest that the distribution of boulders could be controlled by the short-wavelength waves that affect the nearshore but cannot reach further inland. When boulders are moved by tsunamis, the relationship between boulder size and dis-tance from the shore exhibits particularly low correlation.
We assumed that the boulders were transported in rolling mode. However, if the boulders were transported in sliding mode, the required wave heights to move the boulders would be smaller than those with a return period of 50 years (Table 2). This suggests that the boul-ders could be moved by the small amplitude waves that have a return period of 50 years or less if the boulders were moved in sliding mode. In any case, the boulders could be transported by the storm waves with a return period of 50 years or less.
The boulders at Jiupeng are distributed at distances of 30 to 76 m from the shore (Matta et al. 2013). Boulder sizes were found to be in the range 4.2 to 5.5 m, which is within the range of boulder sizes ob-served on Lanyu Island. This suggests that the boul-ders at Jiupeng would have been moved by storm waves. Even if the boulders were transported to the coast by paleo-tsunamis, subsequent storms would have moved them.
These results suggest that boulders at distances within 100 m of the shore could be moved by storm waves with a 50-year return period. If the boulders were distributed at distances beyond the inundation area of the estimated storm waves, or if the estimated flow velocities required to initiate movement of the boulders were much larger than those of the storm waves, it would have been plaus-ible that these boulders were moved by tsunamis. The estimation of flow velocity and inundation depth from numerical simulations of storm waves based on accurate topographic surveys would be a useful tool for identify-ing whether tsunamis or storms transported the numer-ous boulders onshore.
Conclusions
We surveyed the sizes and distances from the shore of boulders on Lanyu Island, Taiwan, and investigated whether they could have been moved by storm waves. The results suggest that boulder sizes decreased with distance from the shore. The boulder volume anda-axis length versus distance from the shore exhibited weak and moderate correlation (r= 0.21 and 0.48), respect-ively. The landward-fining boulder size distribution and lack of large boulders far from the shore suggest that the boulders on Lanyu Island would have been transported by storm waves.
The estimated maximum flow velocities obtained from numerical simulations of storm waves were larger than required to initiate movement of the boulders. This also suggests that the boulders would have been moved by storm waves with a 50-year return period.
Obviously, this does not rule out the occurrence of large paleo-tsunamis having struck Lanyu Island. How-ever, the numerical simulations of the tsunamis gener-ated by Mw8.7 earthquakes from the Ryukyu Trench could not move most of the boulders. Moreover, storm waves could transport boulders up to 100 m from the shore, and the sizes of these boulders decrease with dis-tance from the shore. Thus, boulders that do not conform to this trend could possibly be boulders transported by tsunamis. Verification of the method of transportation of boulders based on numerical simulations would be useful in areas where the coral reef is not developed and storm waves can reach the shore.
Competing interests
The authors declare that they have no competing interests.
Authors’contributions
All authors carried out the observation. MN analyzed the data, carried out the numerical simulation, and drafted the manuscript. All authors read and approved the final manuscript.
Acknowledgements
helpful support in the Lanyu Island. Thanks are offered also to the Japan Meteorological Agency for providing theGrid Point Value data. This work was supported by JSPS KAKENHI Grant Numbers 23540498 and 24651277.
Received: 19 March 2014 Accepted: 17 September 2014 Published: 30 September 2014
References
Ando M, Nakamura M, Lin CH (2013) Tsunami folklore and possible tsunami source on the eastern coast of Taiwan. Terr Atmos Ocean Sci 24:951–961, doi:10.3319/TAO.2013.07.12.01(T)
Araoka D, Yokoyama Y, Suzuki A, Goto K, Miyagi K, Miyazawa K, Matsuzaki H, Kawahata H (2013) Tsunami recurrence revealed byPoritescoral boulders in the southern Ryukyu Islands, Japan. Geology 41, doi:10.1130/G34415.1 Asai E, Ogawa N (1935) The myths and traditions of the Formosan native tribes
(reprinted edition). Toko Shoin, Tokyo (in Japanese)
Chen YG, Liu TK (1992) Vertical crustal movement of a tectonic uplifting volcanic island–Lutao. J Geol Soc China 35:231–246
Coastal Development Institute of Technology (2001) Research and development of numerical wave channel“CADMAS-SURF”, coastal channel. Coastal Dev Inst Technol CDIT Libl 12:1–296 (in Japanese)
Egashira K, Fukuda I, Kishira Y, Nishimura T (1985) Field measurement of the wave deformation on the reef. Proc Coastal Eng JSCE 32:90–94 (in Japanese) General Bathymetric Chart of the Oceans (2010) British Oceanographic Data
Centre., http://www.gebco.net/data_and_products/ gridded_bathymetry_data/. Accessed 6 July 2014
Global Atmospheric Observation Data (2013) Research Institute for Sustainable Humanosphere. Kyoto University, http://database.rish.kyoto-u.ac.jp/arch/ jmadata/gpv-original.html. Accessed 6 July 2014
Goff J, Dudley WC, de Maintenon MJ, Cain G, Coney JP (2006) The largest local tsunami in 20th century Hawaii. Mar Geol 226:65–79
Goto K, Okada K, Imamura F (2009) Characteristics and hydrodynamics of boulders transported by storm waves at Kudaka Islands, Japan. Mar Geol 262:14–24
Goto K, Kawana T, Imamura F (2010a) Historical and geological evidence of boulders deposited by tsunamis, southern Ryukyu Islands, Japan. Earth-Sci Rev 102:77–99, doi:10.1016/j.earscirev.2010.06.005
Goto K, Miyagi K, Kawamata H, Imamura F (2010b) Discrimination of boulders deposited by tsunamis and storm waves at Ishigaki Island, Japan. Mar Geol 269:34–45
Harmelin-Vivien ML, Laboute P (1986) Catastrophic impact of hurricanes on atoll outer reef slopes in the Tuamotu (French Polynesia). Coral Reefs 5:55–62 Hirt C, Nichols BD (1981) Volume of fluid (VOF) method for dynamics of
boundaries. J Comput Phys 39:201–225
Hsu Y-J, Ando M, Yu S-B, Simons M (2012) The potential for a great earthquake along the southernmost Ryukyu subduction zone. Geophys Res Lett 39, L14302, doi:10.1029/2012GL052764
Inoue S, Kayane H, Matta N, Chen WS, Ikeda Y (2011) Holocene uplifted coral reefs in Lanyu and Lutao Islands to the southeast of Taiwan. Coral Reefs 30:581–592
Jiang W-D, Chang H-K, Liou J-C, Chen W-W, Ho L-S (2011) Investigation of long-term wave statistics and design wave for main harbors of Taiwan (2/4). Report of Institute of Transportation, No. 100-52-7537 (in Chinese with English abstract)
Kawana T, Nakata T (1994) Timing of late Holocene tsunamis originated around the southern Ryukyu Islands, Japan, deduced from coralline tsunami deposits. J Geogr Jpn 103:352–376 (in Japanese)
Kunkel CM, Hallberg RW, Oppenheimer M (2006) Coral reefs reduce tsunami impact in model simulations. Geophys Res Lett 33, L23612, doi:10.1029/ 2006GL027892
Lau AYA, Switzer AD, Dominey-Howes D, Aitchison JC, Zong Y (2010) Written records of historical tsunamis in the northeastern South China Sea–challenges associated with developing a new integrated database. Nat Hazards Earth Syst Sci 10:1793–1806
Ma KF, Lee MF (1997) Simulation of historical tsunamis in the Taiwan region. Terr Atmos Ocean Sci 8:13–30
Mak S, Chan LS (2007) Historical tsunamis in South China. Nat Hazards 43:147–164, doi:10.1007/s11069-007-9113-6
Mastronuzzi G, Pignatelli C (2012) The boulder berm of Punta Saguerra (Taranto, Italy): a morphological imprint of the Rossano Calabro tsunami of April 24, 1836? Earth Planets Space 64:829–842, doi:10.5047/eps.2011.08.018
Matta N, Ota Y, Ando M, Nishizawa Y, Haraguchi T, Switzer A, Lin CH (2010) Possible evidence for paleotsunami at Chenggong Town, east coast of Taiwan. In: Abstracts of the Western Pacific geophysical meeting. U33B-237, Taipei
Matta N, Ota Y, Chen W-S, Nishikawa Y, Ando M, Chung L-H (2013) Findings of probable tsunami boulders on Jiupeng coast in southeastern Taiwan. Terr Atmos Ocean Sci 24:159–163
Ministry of the Interior (2004) Administration district map of Lanyu, Taitung (ISBN:9860012229). Ministry of the Interior, Taiwan
Nakamura M (2009) Fault model of the 1771 Yaeyama earthquake along the Ryukyu Trench estimated from the devastating tsunami. Geophys Res Lett 36, L19307, doi:10.1029/2009GL039730
Nandasena NAK, Paris R, Tanaka N (2011) Reassessment of hydrodynamic equations: minimum flow velocity to initiate boulder transport by high energy events (storms, tsunamis). Mar Geol 281:70–84
Nezu I (1995) Hydraulics and hydrodynamics. ISBN 978-4254261356. Asakura Publishing, Tokyo (in Japanese)
Nott J (2003) Waves, coastal boulders and the importance of the pre-transport setting. Earth Planet Sci Lett 210:269–276
Ota Y (2013) Finding of paleotsunami deposits in the east coast of Taiwan. In: Abstracts of the Western Pacific sedimentology meeting. 2013WPSM-S1.1-O6, Taoyuan
Richmond BM, Watt S, Buckley M, Jaffe BE, Gelfenbaum G, Morton RA (2011) Recent storm and tsunami coarse-clast deposit characteristics, southeast Hawaii. Mar Geol 283:79–89
Sakakiyama T, Imai S (1996) Numerical simulation of wave overtopping at seawall covered by wave-dissipating concrete blocks. Proc Coast Eng JSCE 43:696–700 (in Japanese)
Shuttle Radar Topography Mission (2001) Jet Propulsion Laboratory, National Aeronautics and Space Administration., http://www2.jpl.nasa.gov/srtm/. Accessed 6 July 2014
Shyu JB, Sieh K, Chen YG (2005) Neotectonic architecture of Taiwan and its implications for future large earthquakes. J Geophys Res 110, doi:10.1029/ 2004JB003251
Simkin T, Fiske RS (1983) Krakatau, 1883: the volcanic eruption and its effects. Smithsonian Institution Press, Washington, D.C
Su C-H, Liaw C-T, Hsu J-C (2009) Special report of observation data of wave at Hualien harbor (1990~2008) (Volume I). Report of Institute of Transportation, No. 93-115-7118(1)(2) (in Chinese with English abstract)
Yang TF, Tie JL, Chen CH, Lee T, Punonbayan RS (1995) Fission-track dating of volcanic on the northern part of the Taiwan-Luzon arc: eruption ages and evidence for crustal contamination. J Southeast Asian Earth Sci 11:81–93 Yang TF, Lee T, Chen CH, Cheng SN, Knittel U, Punonbayan RS, Rasdas AR (1996)
A double island arc between Taiwan and Luzon: consequence of ridge subduction. Tectonophysics 258:85–101
Yu S-B, Chen H-Y, Kuo L-C (1997) Velocity field of GPS stations in the Taiwan area. Tectonophysics 274:41–59
doi:10.1186/1880-5981-66-128
Cite this article as:Nakamuraet al.:Numerical simulations to account for boulder movements on Lanyu Island, Taiwan: tsunami or storm?
Earth, Planets and Space201466:128.
Submit your manuscript to a
journal and benefi t from:
7 Convenient online submission
7 Rigorous peer review
7 Immediate publication on acceptance
7 Open access: articles freely available online
7 High visibility within the fi eld
7 Retaining the copyright to your article