ISSN(Online): 2319-8753 ISSN (Print): 2347-6710
I
nternational
J
ournal of
I
nnovative
R
esearch in
S
cience,
E
ngineering and
T
echnology
(An ISO 3297: 2007 Certified Organization)
Website: www.ijirset.com
Vol. 6, Issue 4, April 2017
Establishment of
Intensity-Duration-Frequency Formula for Precipitation in
Puthimari Basin, Assam
Tinku Kalita 1, Bipul Talukdar 2
P.G. Student, Department of Civil Engineering, Assam Engineering College, Jalukbari, Assam, India1 Associate Professor, Department of Civil Engineering, Assam Engineering College, Jalukbari, Assam, India2
ABSTRACT: The rainfall Intensity-Duration-Frequency (IDF) relationship is one of the most commonly used tools in water resources engineering, either for planning, designing and operating of water resource projects, or for various engineering projects against design floods. The establishment of such relationships was reported as early as in 1932 (Bernard). Since then, many sets of relationships have been constructed for several parts of the globe. Different states of India have also developed this relationship. In this project an attempt has been made for the development of IDF relationship for Puthimari Basin, Assam. The classical approach for building IDF curves has three steps. In the first step, a probability distribution function is fitted to each duration sample. In the second step, the quantiles of several return periods T are calculated using the estimated distribution function from step one. Lastly, the IDF curves are determined by fitting a parametric equation for each return period, using regression techniques between the quantile estimates and the duration. In this project the calculation for return period is done according to Gumbel’s distribution method and IDF curves were obtain by curve fitting method. The maximum intensity for return period of 2years, 5 years, 10 years, 25 years and 50years are calculated. This study has been conducted for the formulation and construction of IDF curves using data from the recording station.
KEYWORDS: Rainfall intensity, Design rainfall, Intensity-Duration-Frequency relationship (IDF), Puthimari Basin, Assam.
NOTATIONS
d = rainfall duration (hour)
i = rainfall intensity (mm/hr)
= rainfall intensity for d- hour duration and T-year return period
= rainfall intensity for 1- hour duration and T-year return period
= rainfall intensity for d- hour duration and 50-year return period
P = rainfall depth (mm)
T = return period (years)
K =frequency factor
N =sample of size N
Sn =reduced standard deviation, a function of sample size N
X =intensity variate
XT =value of the variate x with a return period T
xo =particular intensity
̅ = mean
YT =reduced variate for a given time T
= standard deviation of the variate = standard deviation of the sample of size N
ISSN(Online): 2319-8753 ISSN (Print): 2347-6710
I
nternational
J
ournal of
I
nnovative
R
esearch in
S
cience,
E
ngineering and
T
echnology
(An ISO 3297: 2007 Certified Organization)
Website: www.ijirset.com
Vol. 6, Issue 4, April 2017
= reduced mean, a function of sample size N
I. INTRODUCTION
The rainfall intensity-duration-frequency (IDF) relationship is one of the most commonly used tools in water resources engineering, either for planning, designing and operating of water resources projects, or for various engineering projects against floods. The establishment of such relationships was done as early as in 1932 (Bernard, 1932). Since then, many sets of relationships have been constructed for several parts of the globe. There is a high need of IDF curves in the monsoon area like Assam, but the adequate long history data are not frequently available.
A rainfall intensity-duration-frequency (IDF) relationship is commonly required for designing of the water resource projects. There has been considerable attention and research on IDF relationship: Hershfield (1961) developed various rainfall contour maps to provide the design rain depths for various return periods and durations. Bell (1969) proposed a generalized IDF formula using the one hour, 10 years rainfall depths; , as an index. Chen (1983) further developed a generalized IDF formula for any location in the United States using three base rainfall depths:
, , ,which describe the geographical variation of rainfall. Koutsoyiannis et al, (1998) cited that the IDF relationship is a mathematical relationship between the rainfall intensity i, the duration d, and the return period T (or, equivalently, the annual frequency of exceedance, typically referred to as “frequency ”only) .
II. EMPERICAL FORMULA
The IDF formulas are the empirical equations representing a relationship among maximum rainfall intensity (as dependant variable) and other parameters of interest such as rainfall duration and frequency (as independent variables). There are several commonly used functions found in the literature of hydrology applications (Chow et al., 1988), four basic forms of equations used to describe the rainfall intensity duration relationship are summarized as follows:
:
= (1)
:
= (2)
:
= (3)
ℎ :
=
( ) (4)
Where, i is the rainfall intensity (mm/hour); d is the duration (hours); a,b and e are the constant parameters related to the metrological conditions. These empirical equations show the rainfall intensity decreases with rainfall duration for a given return period. All functions have been widely used for hydrology practical applications.
III. CALCULATIONOFRETURNPERIODBYGUMBEL’SMETHOD
ISSN(Online): 2319-8753 ISSN (Print): 2347-6710
I
nternational
J
ournal of
I
nnovative
R
esearch in
S
cience,
E
ngineering and
T
echnology
(An ISO 3297: 2007 Certified Organization)
Website: www.ijirset.com
Vol. 6, Issue 4, April 2017
According to this theory of extreme events, the probability of occurrence of an event equal to or larger than a value x0
is:
( ≥ ) = 1− (5)
In which is a dimensionless variable given by = ( − )
= ̅ − 0.45005
= 1.2825/
Thus,
= . ( ̅)+ 0.577 (6)
Where ̅ = mean and = standard deviation of the variate . In practice it is the value of for a given that is required and as such eq. (5) is transposed as
= − ln[−ln(1− )] (7)
Noting that the return period = 1/ and designating = the value of , commonly called the reduced variate, for a given
= − ln. ln (8) Or
= − [0.834 + 2.303loglog ] (9)
Now rearranging eq. (6), the value of the variate with a return period is
= ̅+ (10) where
= .
. (11)
IV. GUMBEL’SEQUATIONFORPRACTICALUSE
Equation (10) giving the value of the variate with a recurrence interval is used as
= ̅ + (12)
Where = standard deviation of the sample of size =√ ( ̅ )
= frequency factor expressed as
= (13)
In which = reduced variate, a function of and is given by
= −[ln. ln ] (14) Or
YT = −[0.834 + 2.303loglog ]
n = reduced mean, a function of sample size
ISSN(Online): 2319-8753 ISSN (Print): 2347-6710
I
nternational
J
ournal of
I
nnovative
R
esearch in
S
cience,
E
ngineering and
T
echnology
(An ISO 3297: 2007 Certified Organization)
Website: www.ijirset.com
Vol. 6, Issue 4, April 2017
V. GENERALIZED INTENSITY - DURATION - FREQUENCY FORMULA
A set of Intensity-Duration-Frequency (IDF) curves constitutes a relation between the intensity (more precisely, the mean intensity) of precipitation (measured in /ℎ), the duration or the aggregation time of the rainfall (in ℎ ) and the return period of the event. The return period of an event (here the rainfall intensity or depth) indicates how frequent this event is and is defined by the inverse of the annual exceedance probability. Denote by the rainfall intensity
( /ℎ), the duration of the rainfall (ℎ ) and the return period (years). The IDF relation is mathematically as
follows:
= ( , ) (15)
The rainfall intensity is a function of the variables and . Koutsoyiannis et al. (1998) cited that the IDF relationship is a mathematical relationship between the rainfall intensity , the duration , and the return period (or, equivalently, the annual frequency of exceedance, typically referred to as ‘frequency’ only). The typical IDF relationship for a specific return period is a special case of the generalized formula as given in equation:
=
( )
(16)
where , , and are non-negative coefficients.
Thus, the equation that is more general: with = 1 and = 1 it will be Talbot equation; = 1 and = 0 is Sherman;
= 1 is Kimijima equation and = 1 is Sherman. This expression is an empirical formula that encapsulates the experience from several studies. A numerical study shows if it is assumed that = 1, the corresponding error is much less than the typical estimation errors which results in the equation:
=
( ) (17)
Bell (1969) proposed a generalized IDF formula using the one hour, 10 years rainfall depths; , as an index. Cheng-lung Chen (1983) further developed a generalized IDF formula for any location in the United States using three base rainfall depths: 1-hour rainfall depth, 10- year returns ; 24-hours rainfalldepth, 10-years returns , and 24-hours rainfall depth, 100-years returns , which describe the geographical variation of rainfall. Bell developed generalized IDF relationships for high intensity short duration rainfall. Bell established two general relationships:
= 0.54 . –0.50(5 < < 120 )
(18)
= 0.21ln + 0.52(2≤ ≤100 ) (19)
The IDF relationship produced by frequency analysis at each recording rain gauge was fitted to the following equation suggested by Bell (1969) and Chen (1983) may consider expressions of the type:
``
= ( ) ( ) (20)
where is the return period (year), the rainfall duration; ’ is a constant return period (year) as the base value; `a constant rainfall duration as the base value. is the rainfall intensity with a year return period and d hour rainfall duration. `` is the rainfall intensity with a base ` return period and a base `ℎ rainfall duration. ( )is a
function of only return period and assumed to be the ratio of to `. Here the function does not depend on the duration . ( )is a function of only duration and assumed to be the ratio of to `. Here the function does not
depend on the return period .
Bell (1969), Chen (1983) and Koutsoyiannis et al. (1998) proposed the function of the return period, ( ) is the ratio of to ` given by:
( ) = `=
` ``
= + ln (21)
ISSN(Online): 2319-8753 ISSN (Print): 2347-6710
I
nternational
J
ournal of
I
nnovative
R
esearch in
S
cience,
E
ngineering and
T
echnology
(An ISO 3297: 2007 Certified Organization)
Website: www.ijirset.com
Vol. 6, Issue 4, April 2017
And ( )is the ratio of to ` and is a functionof the rainfall duration
( ) = `
= `
`` =
( ) (22)
After combining Equation (20), (21) and (22), the generalized formula of rainfall intensity frequency can be written as
= ``( + ln ) ( ) (23)
The equation (23) is generalized formula of rainfall intensity frequency formula using base on rainfall intensity with ’− ℎ rainfall duration, and ’− return period.
V.METHODOLOGY AND RESULT
The data of twenty four hours rainfall for ten years have been collected from Indian Meteorological Department, Borjhar (Guwahati) using non recording rain gauges for Puthimari Basin, Assam. Every storm in a year, from 1991 to 2000, was analyzed to determine the maximum intensities for durations of 1, 2, 3, 4, 5, 6 and 7 hour. Thus each storm gave one value of maximum intensity for a given duration. The largest of all such values was taken to be the maximum intensity in that year for that duration. The graph shows the variation of maximum intensity and duration of rainfall for the year 2000. Clearly it can be observed that with the increasing of rainfall duration, maximum intensity of rainfall decreases.
Fig.1 Intensity-Duration Curve for 2000
The calculation of design intensity for a particular return period is found out according to Gumbel’s distribution method. The maximum intensity for return period of 2 years, 5 years, 10 years, 25 years and 50 years with the duration of 1 hour, 2 hour, 3 hour, 4 hour, 5 hour, 6 hour and 7 hour are calculated. The maximum intensity is shown in Table 1 as follows:
0 5 10 15 20 25 30 35 40 45 50
0 2 4 6 8
Duration (hr)
M
a
x
im
u
m
in
te
n
si
ty
(m
m
/h
r
ISSN(Online): 2319-8753 ISSN (Print): 2347-6710
I
nternational
J
ournal of
I
nnovative
R
esearch in
S
cience,
E
ngineering and
T
echnology
(An ISO 3297: 2007 Certified Organization)
Website: www.ijirset.com
Vol. 6, Issue 4, April 2017
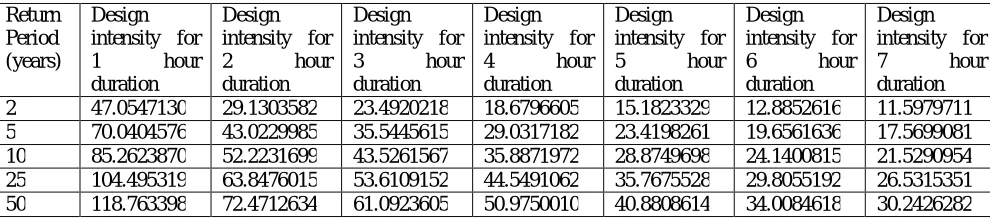
Table 1. The design intensity of rainfall with duration and return period at Puthimari Basin, Assam.
Return Period (years)
Design intensity for
1 hour
duration
Design intensity for
2 hour
duration
Design intensity for
3 hour
duration
Design intensity for
4 hour
duration
Design intensity for
5 hour
duration
Design intensity for
6 hour
duration
Design intensity for
7 hour
duration 2 47.0547130 29.1303582 23.4920218 18.6796605 15.1823329 12.8852616 11.5979711 5 70.0404576 43.0229985 35.5445615 29.0317182 23.4198261 19.6561636 17.5699081 10 85.2623870 52.2231699 43.5261567 35.8871972 28.8749698 24.1400815 21.5290954 25 104.495319 63.8476015 53.6109152 44.5491062 35.7675528 29.8055192 26.5315351 50 118.763398 72.4712634 61.0923605 50.9750010 40.8808614 34.0084618 30.2426282
VI. GENERALIZED RAINFALL INTENSITY DURATION FREQUENCY FORMULA AT PUTHIMARI BASIN, ASSAM
A. INTENSITY-FREQUENCY RATIOS
The function ( ) is the ratio of to and is a function of the return period (equation 21). The ratio of
⁄ for various return period are given in Table (2). Here, T’=50 years is considered as the base return period.
Table 2.Ratio of ⁄ at for Puthimari Basin, Assam.
Years Return 2 5 10 25 50
Ratios ( ) 0.3960 0.5897 0.7179 0.8798 1
The parameter λ is slope value of linear regression relationship between the log-transformed values of return periods (T) and the ratios of rainfall intensity:
( ) = = 0.279 + 0.428 log (24)
The parameter λ=0.428 and c=0.279 with correlation coefficient value r=0.998.
B. INTENSITY-DURATION RATIOS
The function ( ) is the ratio of to and is a function of the duration (equation 22). The ratio of for various durations are given in Table (3). Here, d’=1 hour is considered as the base duration.
Table 3. Ratio of ⁄ at for Puthimari Basin, Assam.
Duration (hour)
1 2 3 4 5 6 7
Ratios
( )
ISSN(Online): 2319-8753 ISSN (Print): 2347-6710
I
nternational
J
ournal of
I
nnovative
R
esearch in
S
cience,
E
ngineering and
T
echnology
(An ISO 3297: 2007 Certified Organization)
Website: www.ijirset.com
Vol. 6, Issue 4, April 2017
The ratio ( ) was fitted by Bernard equation:
( ) = = .. (25)
The parameter a=1.025 and e=0.68 with correlation value r=0.986.
Combining equation (24), (25) the generalized Intensity Duration Frequency formula at Puthimari Basin, Assam, with rainfall intensity in 1 hour and 50 years return period is 118.763398 mm/hr, gives:
= 118.763398(0.279 + 0.428 log ) .. (26)
Generalized rainfall intensity duration frequency formula at Puthimari Basin as:
= . .. (27)
The rainfall intensity can calculate from equation (27) for any duration (d) and return period (T) at Puthimari Basin, Assam.
The graph shown in fig 2, shows the relationship between maximum intensity and return period for a particular duration of rainfall as per Table 1(which is the actual curve as per available data) as well as the curve obtained between maximum intensity and return period from the equation 27 (which is the predicted curve after the analysis).
Fig 2. Variation of Intensity and Return period as per Table 1 and as per predicted equation 27. 0
20 40 60 80 100 120 140
0 5 10 15 20 25 30 35 40 45 50 55
M
ax
im
u
m
In
te
n
si
ty
(m
m
/h
r)
Return Period (years)
ISSN(Online): 2319-8753 ISSN (Print): 2347-6710
I
nternational
J
ournal of
I
nnovative
R
esearch in
S
cience,
E
ngineering and
T
echnology
(An ISO 3297: 2007 Certified Organization)
Website: www.ijirset.com
Vol. 6, Issue 4, April 2017
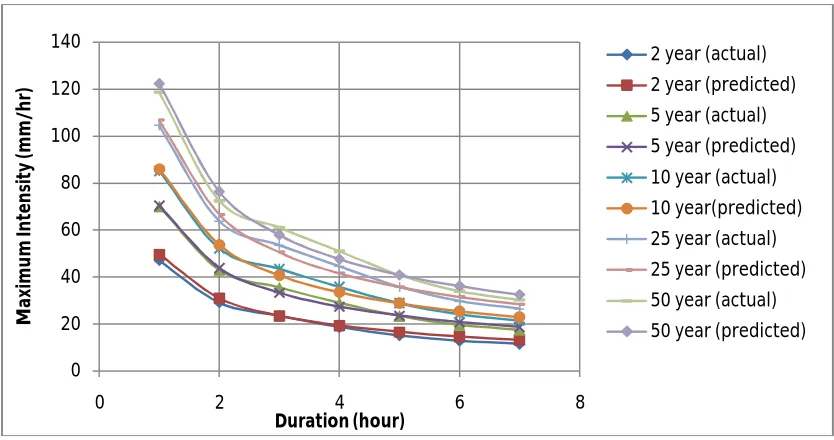
The graph shown in fig 3, shows the relationship between maximum intensity and the duration for a particular return period as per Table 1(which is the actual curve as per available data) as well as the curve obtained between maximum intensity and return period from the equation 27 (which is the predicted curve after the analysis).
Fig 3. Variation of Intensity and Duration as per Table 1 and as per predicted equation 27.
VII. CONCLUSIONS
The IDF formula parameters have been generated to estimate rainfall intensity for various return periods and rainfall durations. Its main objective is to estimate the maximum intensity of rainfall for any duration and return period. In this study an attempt has been made to obtain this relationship for Puthimari Basin, Assam by using Gumbel’s distribution method for determining Return period and best fit curve method to establish Intensity-Duration and Frequency curve. In this work 1 hour duration and 50 years return period is taken as base rainfall duration and base return period for the analysis. Hence from the equation (27) one can estimate intensity of rainfall for any duration and for any return period.
REFERENCES
[1] Antigha, R.E ,Ogarekpe, N.M., “Development of Intensity Duration Frequency Curves for Calabar Metropolis,South, Nigeria” The
International Journal Of Engineering And Science (Ijes), Vol 2,Issue 3, pp. 39-42,2013
[2] Bell, F.C., “Generalized rainfall duration frequency relationships”. Journal of Hydraulic Div., ASCE, 95(1),pp. 311-327,1969
[3] Chen, C.L., Rainfall intensity-duration - frequency formulas, Journal of Hydraulic Engineering, ASCE, 109(12), pp. 1603-1621,1983
[4] Chow, V. T., Handbook of Applied Hydrology, McGraw-Hill, New York, 1-1450,1964
[5] Chow, V.T., Maidment, D.R. & Mays, L.W. Applied Hydrology, McGraw-Hill,1988
[6] David M. Hershfied., “Estimating the Probable Maximum Precipitation”, Journal of the Hydraulic Division, Proceeding of the ASCE, HY5,
pp.99-116,1961
[7] Kothyari, U.C. and Grade, R.J.,” Rainfall intensity duration frequency formula for India”, J. Hydr. Engg., ASCE, 118(2), 323-336,1992
[8] Koutsoyiannis, D., Manetas, A., “A mathematical framework for studying rainfall intensity-duration-frequency relationships”, Journal of
Hydrology, 206, pp.118–135,1998
[9] Le Minh Nhat, Yasuto Tachikawa, and Kaoru Takara., “Establishment of Intensity-Duration-Frequency Curves for precipitation in the
monsoon area of Vietnam”,Annuals of Disas. Prev. Res. Inst., Kyoto Univ., No. 49 B, pp. 93-102,2006
[10] Kotei R., Kyei-Baffour N., Ofori E. and Agyare W. A., “Establishment of rainfall Intensity-Duration-Frequency (IDF) curves for
mampong-ashanti municipal area of the mampong-ashanti region in Ghana”, ARPN Journal of Engineering and Applied Sciences, Vol.8, No. 9, September, pp. 693-698,2013
[11] K. Subramanya, “Engineering. Hydrology”. Tata McGraw-Hill Publishing Company Limited, New Delhi,2006
0 20 40 60 80 100 120 140
0 2 4 6 8
M
ax
im
u
m
In
te
n
si
ty
(m
m
/h
r)
Duration (hour)
ISSN(Online): 2319-8753 ISSN (Print): 2347-6710
I
nternational
J
ournal of
I
nnovative
R
esearch in
S
cience,
E
ngineering and
T
echnology
(An ISO 3297: 2007 Certified Organization)
Website: www.ijirset.com
Vol. 6, Issue 4, April 2017
[12] Dr. P. Jaya Rami Reddy., “A Textbook of Hydrology” ,University Science Press,2008
[13] Trevor M. Daniell and Guillermo Q. Tabios III., “Rainfall Intensity-Duration-Frequency (IDF) Analysis for the Asia Pacific
Region”,Technical documents in Hydrology, No.2. International hydrological Programme,2008
[14] Umesh C.Kothyari and Ramchandra J.Garde., “Rainfall Intensity-Duration-Frequency Formula for India”, Journal of Hydraulic