#
NITROGEN RECYCLING IN THE CHOWAN RIVER
1
Donald
W.
Stanley,
Research Associate, Zoology 2John E. Hobbie
,
Professor of Zoology Department of ZoologyN.C. State University Raleigh,
N. C.
27607I Present address: Department of Environmental Sciences and
Engineering, University of North Carolina, Chapel Hill, North Carolina 27514.
3
L
Present address: The Ecosystems Center, Marine Biological Laboratory, Woods Hole, Massachusetts 02543.
The work upon which t h i s p u b l i c a t i o n i s b a s e d was s u p p o r t e d
by f u n d s p r o v i d e d by t h e O f f i c e o f Water R e s e a r c h and Technology,
U.S. Department o f t h e I n t e r i o r , t h r o u g h The U n i v e r s i t y o f
N o r t h C a r o l i n a Water R e s o u r c e s R e s e a r c h I n s t i t u t e , a s a u t h o r i z e d u n d e r t h e Water R e s o u r c e s R e s e a r c h Act o f 1 9 6 4 , a s amended.
Project No. B-077-NC
TABLE OF CONTENTS
Page
. . .
ACKNOWLEDGMENTS i v
. . .
ABSTRACT v
. . .
LISTOFFIGURES v i
. . .
LIST OF TABLES v i i i
. . .
SUMMARY AND CONCLUSIONS i x
. . .
RECOMMENDATIONS x i i i
I N T R O D U C T I O N . . . a * . . . . 1
. . .
A.Background . , 1
. . .
B
.
O b j e c t i v e s and Research P l a n 2. . .
C
.
The Chowan River and I t s Drainage Basin3
. . .
METHODS
. . .
9. . .
A.Sampling 9
. . .
B
.
Carbon and t Nitrogen Uptake Experiments 9. . .
C
.
N u t r i e n t Analyses and Algal Biomass 12. . .
RESULTS AND DISCUSSION 1 4
. . .
A
.
Seasonal P a t t e r n s14
. . .
1
.
Nitrogen Concentrations 1 42
.
Phytoplankton Composition and Biomass. . .
233
.
Photosynthesis and I n o r g a n i c Nitrogen Uptake. .
26 B.
K i n e t i c s of Photosynthesis and Nitrogen Uptake.
30. . .
1
.
Temperature E f f e c t s 30. . .
2
.
L i g h t E f f e c t s and Die1 Uptake 30. . .
3
.
Nitrogen Concentration E f f e c t s 35. . .
a
.
Enrichment Experiments35
. . .
.
b Nitrate-Ammonia I n t e r a c t i o n 39
. . .
.
C Annual Input and Output of Nitrogen 40
. . .
D
.
Annual Carbon and Nitrogen Uptake 46. . .
.
E Nitrogen Recycling 52
REFERENCES
. . .
56
ACKNOWLEDGMENTS
This study was made possible by a grant from the North
Carolina Water Resources Research Institute to J.
E. Hobbie,
Zoology Department,
North Carolina State University, Raleigh.
Several people were associated with the project in various
ways. Bruce Dornseif, William Bowden, Charles Balducci, and
Adrianne Zlotowitz provided help with the sampling, field
experiments, and laboratory analyses. Mr. Grover Cook,
co-ordinator of The ChowantRiver Study, cooperated in providing
work space for the project in
aportable field laboratory
located near Winton,
N.C.
Dr. Jay Langfelder of the Center
for Coastal and Marine Studies at N.C. State University made
available to us other field laboratory and sleeping facilities.
Dr.
A.M. Witherspoon's laboratory provided estimates of algal
species composition and abundance in samples collected every
other week from the four sampling sites.
Dr.
Charles Daniels
of the U.S. Geological Survey provided river flow data. Total
Kjeldahl nitrogen analyses were performed in the laboratory
of Dr. Michael Overcash of the Biological and Agricultural
Engineering Department at N.C. State University. We aref
especially grateful to Dr. Richard Volk of
N.C. State Univer-
sity, in whose laboratory all the
samples were analyzed
by mass spectrometry.
Dr. John Miller served as principal investigator during
the last six months of the project, following J.
E. Hobbie's
ABSTRACT
The r e p e a t e d occurrence of nuisance a l g a l blooms i n t h e Chowan River d u r i n g t h e p a s t few summers may have been caused by i n c r e a s e d n i t r o g e n l o a d i n g i n t h e r i v e r . That p o s s i b i l i t y prompted t h i s study of t h e r e l a t i o n s h i p between n i t r o g e n and a l g a l growth i n t h e r i v e r .
The lower Chowan River, l o c a t e d i n n o r t h e a s t e r n North C a r o l i n a , i s a c t u a l l y a freshwater t i d a l e s t u a r y emptying i n t o Albemarle Sound. A s i s t y p i c a l f o r t h i s r e g i o n , d i s s o l v e d i n o r g a n i c n i t r o g e n c o n c e n t r a t i o n s i n t h e Chowan a r e high i n w i n t e r and l o w i n summer. T h i s p a t t e r n r e s u l t s from a combi- n a t i o n of high r a t e s of i n p u t from l a n d runoff i n t h e w i n t e r and high r a t e s of removal by r a p i d l y growing a l g a e i n t h e sum- mer. Dissolved organic n i t r o g e n
i s
t h e most abundant form of n i t r o g e n i n t h e r i v e r , and t h e c o n c e n t r a t i o n s decrease down- r i v e r , s u g g e s t i n g t h a t it i s transformed t o o t h e r forms w i t h i n t h e r i v e r .Annual a l g a l production i n t h e r i v e r w a s around 100 g over 90% of which occurred between May and October, a p e r i o d when blue-green, d i n o f l a g e l l a t e and green a l g a e made up most of t h e a l g a l biomass. Annual i n o r g a n i c n i t r o g e n uptake, mea- s u r e d by l s ~ isotope t e c h n i q u e s , w a s
33
g NHq.-Nmm-2 and 1 2 g-2
NO N g m
.
Carbon-nitrogen r a t i o s c a l c u l a t e d from t h e s e d a t a3-
a r e low, probably because of n i t r o g e n a s s i m i l a t i o n by b a c t e r i a i n t h e samples and because of luxury uptake of n i t r o g e n by t h e phytoplankton.
During w i n t e r r a p i d f l u s h i n g r a t e s , low l i g h t i n t e n s i t i e s and low temperatures a r e t h e most important f a c t o r s l i m i t i n g a l g a l photosynthesis and n i t r o g e n uptake i n t h e r i v e r . During summer i n o r g a n i c n i t r o g e n became l i m i t i n g a s n i t r a t e and ammonia l e v e l s f e l l below
50
p g N l i t e r - ' , t h e c o n c e n t r a t i o n foundLIST OF FIGURES
Page
The Chowan River drainage basin in southeastern
Virginia and northeastern North Carolina. Sampling
stations are Edenhouse (E)
,
Colerain (C)
,
Harrells-
ville
(H),
andWinton(~)
. . .
4
Discharge for the Chowan River at Winton,
N.C. The
. . .
average rates for each day are plotted
6
Chowan surface water temperatures and depth of pene-
tration of 1% of the surface light, at the Winton
station.
. . .
8
Nitrate and ammonia concentrations at the Winton
and Harrellsville stations
. . . , . . . .
15
Nitrate and ammonia concentrations at the Colerain
and Edenhouse stations,
. . .
16Particulate nitrogen concentrations at the Winton
and Harrellsville stations
. . .
1 9Particulate nitrogen concentrations at the Colerain
and Edenhouse stations.
. . .
20Dissolved organic nitrogen concentrations at the
Winton and Harrellsville stations
. . .
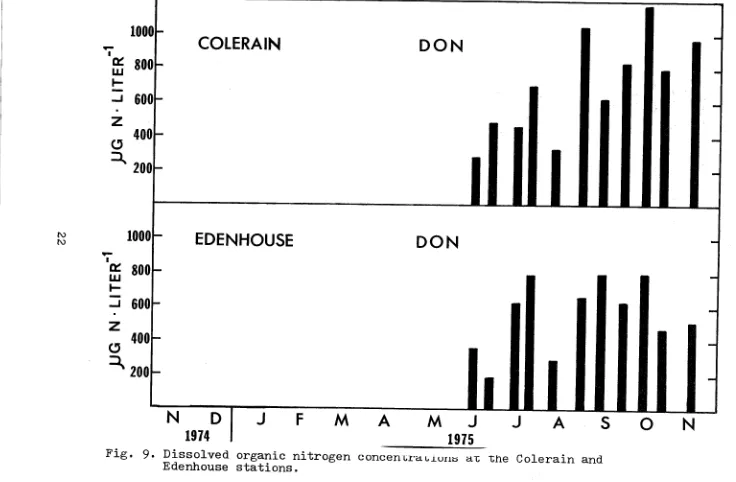
21Dissolved organic nitrogen concentrations at the
C o l e r a i n a n d E d e n h o u s e s t a t i o n s .
. . .
22Seasonal variation in algal wet weight biomass and
species composition at the Winton and Harrellsville
s t a t i o n s . . . .
. . .
24Seasonal variation in algal wet weight biomass and
species composition at the Colerain and Edenhouse
s t a t i o n s . . . , . . .
.
25Midday rates of algal photosynthesis and nitrate
and ammonia uptake for surface samples from the
Winton and Harrellsville stations
. . .
27~iddai
rates of algal photosynthesis and nitrate
and
ammonia uptake for surface samples from the
Colerain and Edenhouse stations
. . .
28Effect of increasing temperature on rates of algal
photosynthesis and nitrate and ammonia uptake at
three Chowan River stations: Edenhouse (E), Colerain
Page
15. E f f e c t of i n c r e a s i n g l i g h t i n t e n s i t y on photosyn- t h e s i s and n i t r a t e and ammonia uptake a t t h e
. . .
C o l e r a i n s t a t i o n on
15
June 1975. 32 1 6 , Die1 p a t t e r n of p h o t o s y n t h e s i s and n i t r a t e andammo~ia uptake a t t h e Winton s t a t i o n on
31
August-. . .
1 September 1975. 36
1 7 . E f f e c t of i n c r e a s i n g n i t r a t e and ammonia concen- t r a t i o n on t h e uptake r a t e s of t h e s e n u t r i e n t s a t
. . .
t h r e e Chovian s t a t i o n s 37
1 8 . E f f e c t of i n c r e a s i n g ammonia c o r ~ c e n t r a t i o n o n t h e
. . .
f r a c t i o n of D I N uptake t h a t i s n i t r a t e .
41
1 9 . Inflow, u p t a k e , and o u t f l c w of n i t r a t e and ammoniai n t h e lotlTer Chowan River between Nove,mber 1974 and November 1975. S i z e of t h e b l o c k s i s p r o p o r t i o n a l
. . .
t o t h e q u a n t i t y of n i t r o g e n . 532 0 . T o t a l a n n u a l i n p u t , a s s i m i l a t i o n , and o u t p u t of n i t r o g e n f o r t h e lower Chowan R i v e r between 1
. . .
November 1974 and
31
October 197555
v i i
SUMMARY AND CONCLUSIONS
This p r o j e c t s t u d i e d t h e u t i l i z a t i o n and r e c y c l i n g of n i t r o g e n i n t h e lower Chowan R i v e r , North C a r o l i n a . The Chowan River Basin d r a i n s approximately 12,600 km2 i n south- e a s t e r n V i r g i n i a and n o r t h e a s t e r n North C a r o l i n a . One objec- t i v e was t o determine how s i g n i f i c a n t r e c y c l i n g o f t h e n i t r o g e n n u t r i e n t s i s f o r a l g a l growth i n t h e r i v e r . Second, we wished t o determine what f a c t o r s l i m i t a l g a l growth i n t h e Chowan a t d i f f e r e n t times of t h e y e a r . A f i n a l o b j e c t i v e was t o gen- e r a t e information t h a t could be used i n models t h a t would s i m - u l a t e b i o l o g i c a l processes ( e . g . , a l g a l growth) i n t h e r i v e r .
S p e c i f i c f i n d i n g s were:
1. I n t h e lower Chowan ( t h e s e c t i o n of r i v e r included i n t h i s study between Winton and t h e mouth a t Edenhouse) flow o f t e n exceeds 1 5 , 0 0 0 c f s i n winter but i s u s u a l l y l e s s t h a n 3,000 c f s i n summer when t r i b u t a r y inflow i s lowest. Thus, f l u s h i n g times f o r t h e lower Chowan a r e t y p i c a l l y 50 days o r more i n t h e summer, compared t o 1 0 days o r l e s s i n w i n t e r . Water temperatures range f r o m around
5 ' ~
i n January t o n e a r 3 0 ' ~ i n August. Light p e n e t r a t i o n i n t h e r i v e r water i s s o l i m i t e d by high t u r b i d i t y t h a t t h e depth of p e n e t r a t i o n of 1% o f t h e s u r f a c e l i g h t seldom exceeds 2 m.2 . A t t h e f o u r s t a t i o n s sampled, n i t r o g e n l e v e l s were t y p i c a l of e s t u a r i n e systems i n t h i s r e g i o n . N i t r a t e c o n c e n t r a t i o n s were high i n w i n t e r and l o w during t h e summer. This s e a s o n a l p a t t e r n r e s u l t s f r o m a combination of high r a t e s o f i n p u t
from l a n d runoff i n t h e w i n t e r and high r a t e s of removal by r a p i d l y growing a l g a e i n t h e summer. Ammonia c o n c e n t r a t i o n s had l e s s seasonal v a r i a t i o n and were u s u a l l y lower t h a n t h e n i t r a t e c o n c e n t r a t i o n s . P a r t i c u l a t e n i t r o g e n l e v e l s remained high throughout t h e y e a r , b u t even i n t h e summer when a l g a l biomass was h i g h e s t over
50%
o f t h e p a r t i c u l a t e n i t r o g e n was d e t r i t a l . Although t h e d a t a on d i s s o l v e d organic n i t r o g e nabundant form of n i t r o g e n i n t h e r i v e r and t h a t t h e concen- t r a t i o n s d e c r e a s e downriver. I t i s l i k e l y t h a t uptake and r e m i n e r a l i z a t i o n of DON o c c u r s i n t h e r i v e r .
3 .
Diatoms were t h e most abundant a l g a e d u r i n g t h e w i n t e r , whereas d i n o f l a g e l l a t e , blue-green and g r e e n a l g a e made up most of t h e biomass d u r i n g t h e summer. Measurements e v e r y o t h e r week d u r i n g 1975 showed t h a t a l g a l biomasswas
much h i g h e r i n summer t h a n w i n t e r . Even s o , t h e peak summer b i o - mass w a s no h i g h e r t h a n i n o t h e r l a k e s and e s t u a r i e s of t h e r e g i o n . However, i n 1975 blooms were n o t encountered i n t h e lower Chowan l i k e t h o s e which had o c c u r r e d i n t h e summers of 1972-19744 . S i m i l a r l y , a l g a l p h o t o s y n t h e s i s and n i t r o g e n uptake r a t e s were h i g h e r i n summer t h a n i n w i n t e r and were t y p i c a l f o r t h e r e g i o n . Annual a l g a l p r o d u c t i o n i n t h e r i v e r w a s around
100 g C a m W 2 , over 90% of which o c c u r r e d between May and Octo- b e r . I n nearby e s t u a r i e s where r a t e s were measured, t h e a n n u a l a l g a l p r o d u c t i o n w a s about t h e same as i t was i n t h e Chowan R i v e r d u r i n g 1975. Annual i n o r g a n i c n i t r o g e n u p t a k e , measured
by
1 5 ~
i s o t o p e t e c h n i q u e s , was33
g N H ~ - N - ~ - ~ and 12 g NO - ~ * m - ~ .3
Carbon-nitrogen r a t i o s c a l c u l a t e d from t h e s e d a t a a r e low, probably because of n i t r o g e n a s s i m i l a t i o n by b a c t e r i a and because of l u x u r y uptake of n i t r o g e n by t h e phytoplankton.
5.
R i v e r f l o w e x e r t s a v e r y s t o n g c o n t r o l on a l g a l biomass i n t h e Chowan R i v e r d u r i n g t h e w i n t e r . T h i s w a s i l l u s t r a t e dv i v i d l y i n J u l y 1975 when a l g a l biomass d e c l i n e d r a p i d l y d u r i n g
a s h o r t - l i v e d p e r i o d of h i g h r i v e r f l o w . Biomass s u b s e q u e n t l y r o s e a g a i n t o normal summer l e v e l s as soon as t h e r i v e r f l o w r e t u r n e d t o normal.
6 .
Temperature and l i g h t f l u c t u a t i o n s a l s o cause p a r t of t h e h i g h s e a s o n a l v a r i a b i l i t y i n a l g a l growth i n t h e r i v e r , and b o t h of t h e s e f a c t o r s appear t o l i m i t a l g a l growth a t a l lt i m e s of t h e y e a r . L i g h t l i m i t a t i o n i s e s p e c i a l l y s e v e r e i n w i n t e r because of h i g h t u r b i d i t y . Based on e x p e r i m e n t s , we
limitations, is responsible for a 6 to 10-fold seasonal change in the rates of algal growth and nitrogen assimilation. Both carbon and nitrogen uptake are also limited by low light inten- sities in the Chowan. Even on the brightest summer days, algal growth is only about 20% as rapid as it would be if light pene- trated all the way to the bottom of the river.
7. Nitrogen concentration, on the other hand, limits algal growth in the Chowan only during the summer. We base this
conclusion on evidence from nitrogen enrichment experiments which showed that as long as ammonia or nitrate levels in the river remain higher than 50 pg
liter-l,
nitrogen should not be limiting to algal growth. Summer was the only period when dissolved inorganic nitrogen levels fell below this concen- tration.8.
Our nitrate and ammonia uptake data show that ammonia is used preferentially, especially when ammonia concentrations are high. As a result, nitrate becomes important as a nitro- gen nutrient only during the summer when ammonia levels are low.9. We estimated total amounts of nitrogen entering and leaving the lower Chowan River between 1 November 1974 and 31 October 1975. Some 69% of the incoming nitrogen was dissolved organic nitrogen (DON), 18% was dissolved inorganic nitrogen (DIN)
,
and the remaining 13% was particulate nitrogen (PN). However, only about 64% of the incoming DON left the river at Eden- house. This loss was nearly matched by gains in DIN and PN, suggesting that some DON is assimilated by microorganisms or absorbed by sediments in the river and subsequently regener- ated as inorganic nitrogen.10. The annual output of DIN from the Chowan watershed was 0.11 g ~ # m - ~ * ~ r - ' , which is similar to most watersheds in the Southeast. This indicates that at present the Chowan basin as a whole is not discharging unusually high quantities of nitrogen into the river.
i n f l o w and t h e amount of D I N a s s i m i l a t e d i n d i c a t e r a p i d
n i t r o g e n c y c l i n g w i t h i n t h e r i v e r d u r i n g summer. For example, d u r i n g June and August 1975,
75
t i m e s as much n i t r o g e n w a s a s s i m i l a t e d ( p e r month) as came i n . C l e a r l y , most of t h e n i t r o g e n t h a t i s a s s i m i l a t e d d u r i n g t h e summer comes from r e c y c l i n g p r o c e s s e s such as r e g e n e r a t i o n of D I N from dead o r g a n i c m a t t e r i n t h e water and sediments. U n f o r t u n a t e l y , t h e r e i s l i t t l e t h a t can be done t o slow down t h e s e p r o c e s s e s e x c e p t t o reduce t h e t o t a l amount of n i t r o g e n e n t e r i n g t h e r i v e r .1 2 . During t h e summer f a c t o r s such as l i g h t , t e m p e r a t u r e , and flow a r e more f a v o r a b l e t o a l g a l growth t h a n a t any o t h e r time of t h e y e a r . T h e r e f o r e , because t h e summertime i n p u t of
"new" n i t r o g e n from t h e watershed i s s o low ( e , g . , 400 kg N e
day-') any a d d i t i o n a l i n p u t s h o u l d s i g n i f i c a n t l y i n c r e a s e t h e a l g a l biomass.
1. In the lower Chowan, most of the algal growth occurs in
the summer when dissolved inorganic nitrogen concentrations
are often analytically undetectable and when the rate of input
of nitrogen from upstream is at least an order of magnitude
lower than it is in winter. This is not a paradox, because
most of the summer nitrogen demand is met by recycling nitro-
gen already in the river water and sediments. Apparently,
most of this recycled nitrogen comes from the decomposition
of organic matter previously deposited in the river sediments.
Thus, it is probably not practical to try to use nitrogen
concentration alone as a criterion upon which to base regula-
tions for controlling eutrophication in the river.
2.
It has been estimated that the discharges from one nitro-
gen fertilizer plant on the banks of the lower Chowan amount
to about
200to
500kg ~#da~-'.
This is equivalent to less
than
10%of the average daily input from the rest of the
river's watershed during the winter. However, during the
summer both the river flow and nitrogen concentrations are
so low that this one discharge nearly doubles the nitrogen
load in the river. Clearly, this example illustrates that in
the future additional inputs must
bevery closely regulated,
especially during the summer.
3.
The data suggest that one of the greatest threats to the
lower Chowan River is any action that would
decreasethe
flushing rate, especially during the summer when it is already
low. Conceivably, this could result from activities such as
construction of causeways or dams near the river's mouth that
would restrict water flow or circulation, or upstream removal
of large quantities of water during the summer.
4 .
Little is known about recycling of nutrients in rivers.
If the Chowan is at all typical, then we can say that
analgal
bioassay technique is worthless for predicting the algal growth
potential in shallow rivers. This technique tells what the
growth p o t e n t i a l i s based on t h e t o t a l n u t r i e n t s i n s o l u t i o n . I n s h a l l o w r i v e r s , t h e r e g e n e r a t i o n of n i t r o g e n from t h e
sediments c a n a c t u a l l y provide
75
t i m e s more n i t r o g e n over t h e c o u r s e of t h e summer.INTRODLTCTION
A . Background
Rapid and d r a m a t i c b i o l o g i c a l changes i n t h e lower Chowan R i v e r d u r i n g t h e e a r l y 1 9 7 0 ' s s t i m u l a t e d i n t e r e s t i n a d e t a i l e d s t u d y o f t h e e n t i r e r i v e r . I n p a r t i c u l a r , t h e n u i s a n c e a l g a l growths t h a t developed i n much of t h e r i v e r i n 1972 s e v e r e l y r e s t r i c t e d f i s h i n g , b o t h commercial and s p o r t , r e c r e a t i o n and n a v i g a t i o n .
Nuisance a l g a l growths, o r a l g a l "blooms", occur when a l g a e can o b t a i n l a r g e amounts of n u t r i e n t s , e s p e c i a l l y n i t r o - gen and phosphorus. These n u t r i e n t s come i n t o t h e Chowan
R i v e r from many s o u r c e s i n c l u d i n g wastewater d i s c h a r g e s by towns and o v e r l a n d runoff and d r a i n a g e from a g r i c u l t u r a l and urban a r e a s . I n a d d i t i o n , it w a s d i s c o v e r e d i n 1972 t h a t a new s o u r c e , a f e r t i l i z e r p l a n t on t h e banks of t h e Chowan a t T u n i s , North C a r o l i n a , w a s a d d i n g l a r g e amounts of n i t r o g e n t o t h e r i v e r . T h i s d i s c h a r g e was stopped by s t a t e a c t i o n , and no s e v e r e a l g a l blooms developed i n t h e r i v e r d u r i n g t h e n e x t few y e a r s . Then, i n t h e e a r l y summer of 1976 t h e n u i s a n c e blooms r e a p p e a r e d . A t about t h e same time it w a s d i s c o v e r e d t h a t h i g h n i t r o g e n water was s e e p i n g from t h e Tunis f e r t i l i z e r p l a n t i n t o t h e r i v e r . Thus, t h e r e i s c i r c u m s t a n t i a l evidence t h a t a n i n c r e a s e i n n i t r o g e n l e v e l s i n t h e Chowan i s respon- s i b l e f o r t r i g g e r i n g t h e n u i s a n c e blooms.
I n response t o t h i s s i t u a t i o n , t h e North C a r o l i n a Depart- ment of N a t u r a l and Economic Resources (NCDNER) i n 1973 author-
ized a thorough i n v e s t i g a t i o n of t h e Chowan R i v e r . T h i s Chowan R i v e r Study h a s two primary o b j e c t i v e s t 1) t o determine t h e e f f e c t s of p o i n t and non-point s o u r c e d i s c h a r g e s on w a t e r q u a l i t y i n t h e r i v e r ; and 2 ) t o develop mathematical models f o r a water q u a l i t y management p l a n t h a t w i l l p r e d i c t t h e
impact of i n c r e a s e d d i s c h a r g e s and new d i s c h a r g e s i n t h e Chowan b a s i n .
flow measurements by t h e U . S . Geological Survey, and s p e c i a l - i z e d p r o j e c t s by u n i v e r s i t y r e s e a r c h e r s . These cooperative p r o j e c t s included a study o f t h e e f f e c t s of a q u a t i c macro- phytes on t h e s t o r a g e and r e l e a s e of n i t r o g e n and phosphorus, a study of t h e kinds and numbers of a l g a e i n t h e r i v e r , and a study of t h e u t i l i z a t i o n and r e c y c l i n g o f n i t r o g e n n u t r i e n t s i n t h e r i v e r ( d a t a presented i n t h i s r e p o r t ) , I n a d d i t i o n , two modeling p r o j e c t s have u t i l i z e d information from t h e s e s t u d i e s t o develop mathematical s i m u l a t i o n s of t h e b i o l o g i c a l dynamics o f t h e Chowan as a f f e c t e d by i n c r e a s e d n u t r i e n t
l o a d i n g .
B . O b j e c t i v e s and Research P l a n
One o b j e c t i v e of t h i s study was t o determine t h e e x t e n t of r e c y c l i n g and r e g e n e r a t i o n of n i t r o g e n n u t r i e n t s i n t h e Chowan R i v e r . A t h r e e - s t e p procedure was followed i n pursuing t h i s goalr
1. The i n p u t of n i t r o g e n i n t o t h e lower Chowan River was c a l - c u l a t e d by m u l t i p l y i n g n u t r i e n t c o n c e n t r a t i o n s i n t h e water by r i v e r flow. These d a i l y e s t i m a t e s were summed t o give t o t a l monthly and t o t a l annual i n p u t .
2 . The a s s i m i l a t i o n of ammonia and n i t r a t e by a l g a e and b a c t e r i a i n t h e r i v e r water was measured a t two-week i n t e r v a l s , s t a r t i n g i n A p r i l
1975.
The d a t a were i n t e g r a t e d over time and space t o give t o t a l a s s i m i l a t i o n i n t h e lower Chowan (Winton t o Edenhouse segment) per month and p e r y e a r .3.
Recycling r a t e s were c a l c u l a t e d by comparing a s s i m i l a t i o n r a t e s t o i n p u t r a t e s OM a s h o r t - t e r m (monthly) and a long- term ( a n n u a l ) b a s i s .A second o b j e c t i v e was t o study t h e r e l a t i o n s h i p s between l i g h t i n t e n s i t y , temperature and i n o r g a n i c n i t r o g e n concen- t r a t i o n and a l g a l growth i n t h e r i v e r . F a c t o r i a l experiments were conducted which r e l a t e d both t h e r a t e s of a l g a l growth
intensities and nutrient concentrations. Analysis of the data from these experiments permitted us to draw some con- clusions as to which factors were controlling algal growth in the river at various times of the year.
Finally, the third objective was to generate information that could be used in models that would simulate biological processes (e.g., algal growth) in the river. The factorial experiments described above fulfilled this objective in that they gave quantitative relationships between the biological processes (e.g., rate of nitrogen uptake by algae) and environ- mental conditions (e.g., water temperature, light, and nitro- gen concentration)
.
C. The Chowan River and Its Drainage Basin
The Chowan River drains approximately 12,000 km2 in southeastern Virginia and northeastern North Carolina. The Chowan River proper extends 80 km from the confluence of the Blackwater and Nottoway Rivers near the North Carolina-Virginia border south to its mouth in Albemarle Sound near Edenton,
North Carolina (Fig. 1). Another important tributary is the Meherrin River which empties into the Chowan about 20 km below the Blackwater-Nottoway confluence.
Because Albemarle Sound is sheltered from the Atlantic Ocean by a series of barrier islands, lunar tides in the
lower Chowan seldom exceed 15 cm, These barrier islands also prevent seawater from intruding into the western half of
Albemarle Sound; thus the entire Chowan is freshwater. Wind is an important factor affecting flow rates and direction in the lower Chowan. Between Winton and the mouth at Edenhouse, the river's cross-sectional area increases by nearly 10-fold, yet the volume of flow is estimated to increase by only 10% since about 10% of the total watershed lies between Winton and Edenhouse. As a result the Chowan flows very
Fig. 1. The Chowan River drainage basin in southeastern Virginia and northeastern North Carolina.
i n f l o w , s o u t h e r l y winds may a c t u a l l y r e s u l t i n upstream f l o w f o r s h o r t p e r i o d s ( C , D a n i e l s , p e r s o n a l communication).
T y p i c a l l y t h e r i v e r flow i s h i g h e s t i n w i n t e r (around 15,000 c f s ) and l o w e s t i n summer ( o f t e n l e s s t h a n 1 , 0 0 0 c f s )
.
During 1975 t h e r e was one o u t s t a n d i n g e x c e p t i o n t o t h i s p a t t e r n .I t occurred i n J u l y when t h e f l o w exceeded 50,000 c f s f o r a
s h o r t p e r i o d d u r i n g u n u s u a l l y r a i n y weather ( F i g . 2 ) . Under normal f l o w c o n d i t i o n s f l u s h i n g times f o r t h e lower Chowan can range
from l e s s t h a n 1 0 days d u r i n g t h e w i n t e r t o over 50 days d u r i n g t h e summer, I n 1975 t h e average f l o w r a t e was 6 , 8 4 9 c f s and t h e average f l u s h i n g time was 26 days (Table
1).
The average d e p t h of t h e lower Chowan i s about
4 m
and t h e w a t e ri s
u s u a l l y w e l l mixed. I t i s h i g h l y t u r b i d because o f suspended d e t r i t u s and s t r o n g l y c o l o r e d from humic m a t e r i a l . The 1% l i g h t l e v e l o f t e ni s
l e s s t h a n 1 m deep and seldomexceeds 2
m
( F i g .3 ) .
Water t e m p e r a t u r e s range from about5 ' ~
i n J a n u a r y t o n e a r l y 30°C i n August ( F i g .
3 ) .
2 The Chowan b a s i n h a s a s p a r s e p o p u l a t i o n (20.6/km )
,
t o t a l i n g o n l y 260,000, of which n e a r l y 80% l i v e i n r u r a l a r e a s . The r e g i o n a l economy
i s
p r i m a r i l y a g r i c u l t u r a l , w i t h tobaccoTable 1. Summary of morphornetric and hydrographic p a r a m e t e r s f o r t h e lower Chowan R i v e r
Drainage a r e a (kmL)
2
R i v e r a r e a (km )
3
Volume ( m )
Mean depth ( m )
3
Annual d i s c h a r g e ( m )
TEMPERATURE
("c)
METHODS
A . Sampling
Between November 1974 and November 1975 s u r f a c e water samples were c o l l e c t e d e v e r y two weeks from p i e r s a t f o u r s t a t i o n s a l o n g a
65
km s t r e t c h of t h e lower Chowan R i v e r be- tween Winton and t h e r i v e r ' s mouth a t Edenhouse ( ~ i g . 1).
Within 2 h a f t e r c o l l e c t i i ~ n , t h e s e samples were t a k e n t o a f i e l d l a b o r a t o r y a t Winton where a l l n i t r o g e n and carbon a s s i m i l a t i o n experiments were conducted and where n u t r i e n t and a l g a l biomass sub-samples were t a k e n . The n u t r i e n t sam- p l e s were f r o z e n w i t h d r y i c e and s t o r e d f r o z e n . The a l g a l
samples were p r e s e r v e d w i t h L u g o l t s a c e t i c a c i d solution. A t each sampling s t a t i o n t h e s u r f a c e w a t e r t e m p e r a t u r e was meas- ured w i t h a mercury thermometer and s u b - s u r f a c e l i g h t i n t e n - s i t y was measured a t 0 . 2 m d e p t h i n t e r v a l s by means of a
submarine quantum meter (Lambda I n s t r u m e n t s Co. Model LI-185). T h i s i n s t r u m e n t measures o n l y p h o t o s y n t h e t i c a l l y a v a i l a b l e r a d i a t i o n ( i . e .
,
400-
700 nrn wavelength band),
which is equal t o about 50% of t h e t o t a l s o l a r r a d i a t i o n ( S t r i c k l a n d1 9 5 8 ) .
B , Carbon and N i t r o g e n Uptake Experiments
Phytoplankton p h o t o s y n t h e s i s w a s e s t i m a t e d by t h e c a r - bon-14 t e c h n i q u e o f Steemann-Nielsen ( 1 9 5 2 ) . Samples o f r i v e r water were i n c u b a t e d i n 1 2 5 - m l ground-glass-stoppered b o t t l e s w i t h 1 t o
3
m l of a 2 > ~ i / m l s o l u t i o n of N~H"CO3
* A f t e r incu-i ~ a t i o n t h e phytoplankton were k i l l e d w i t h L u g o l ' s a c e t i c a c i d s o l u t i o n ( ~ o l l e n w e i d e r 1974) and f i l t e r e d onto 0 . 4 5 y m pore s i z e membrane f i l t e r s ( M i l l i p o r e H A ) . The f i l t e r s were d r i e d and s t o r e d u n t i l t h e i r r a d i o a c t i v i t y could be determined w i t h
a Beckman p l a n c h e t t e c o u n t e r .
the
Saurebindungsvermogen(SBV)
indicator undergoes a dis- tinct color change from green to clear gray to red. During the titration nitrogen gas bubbles through the sample in a sintered glass funnel, so as to hold the C02 tension low, thus forcing a complete shift in the carbonate-bicarbonate- carbon dioxide equilibrium towards carbon dioxide. Carbonate alkalinity was calculated as follows:-
( H C ~ ~ - H C ~ ~ ) * (N) a (1,000)meq,liter,
A '
-
vwhere
H C ~ "
equals the ml of acid used to titrate the sample, bHC1 equals the ml of acid used to titrate a blank of 50 ml of boiled, distilled water; N is the normality of the acid used, and v equals the volume (ml) of sample titrated.
12
Available carbon (
Cavail)
was then calculated asThe factors fl, f2, and f which vary with pH, are used for
3
'
calculating concentrations of C02, HCO;, and CO=
3
' Tables of values for the factors at different pH leve3.s can be found in Karlgren's (1962) paper.A
glass electrode pH meter (Corning Model 10) was used to measure pH of the Chowan samples.Finally, photosynthesis rates were calculated as followsr
where
14~assim
equals the corrected counts per minute of the sample and the count per minute of isotope addedto
the bottle is I4cadd. The factor 1.06 corrects for the heavier carbon-The
1 5 ~
t r a c e r technique w a s used t o measure uptake of ammonia and n i t r a t e i n samples of r i v e r w a t e r . The procedure was similar t o t h a t used by Dugdale and Goering ( 1 9 6 7 ) .F i r s t , a known amount of 15N-labeled Na15N0 o r 1 5 ~ ~ 4 ~ 1 w a s
3
added t o t h e w a t e r i n 1 - l i t e r ground-glass-stoppered b o t t l e s . The amount of l a b e l e d compound normally added w a s
14
y g 1 5 Nas ammonia o r n i t r a t e . A f t e r i n c u b a t i o n , t h e 1 5 N samples were k i l l e d w i t h L u g o l ' s a c e t i c a c i d s o l u t i o n and f i l t e r e d o n t o Whatman GF/C g l a s s - f i b e r f i l t e r s , which were t h e n d r i e d and
s t o r e d i n a d e s s i c a t o r . L a t e r , p a r t i c u l a t e m a t e r i a l on t h e f i l t e r s w a s c o n v e r t e d t o molecular n i t r o g e n by Dumas combus- t i o n ( ~ a r s d a t e and Dugdale 1 9 6 5 ) . The
1 5 ~ ~ ' 4 ~
r a t i o of t h e r e s u l t i n g N2 was determined w i t h a mass s p e c t r o m e t e r , t h e r a t i o w a s converted t o atom p e r c e n t 1 5 N , and t h e enrichment over t h e normal atom p e r c e n t I 5 N ( 0 . 3 7 ) of t h e o r g a n i c m a t e r i a l w a s c a l c u l a t e d , The amount of n i t r o g e n t a k e n up w a s c a l c u -l a t e d a s f o l l o w s ;
mg N * l i t e r - ' * h - l = (PN) ( A f )
.
( h ) ( A i )
The t o t a l amount of p a r t i c u l a t e n i t r o g e n (PN) on t h e f i l t e r was determined by a method d e s c r i b e d below. The atom p e r c e n t e x c e s s 15N of t h e ammonia o r n i t r a t e f r a c t i o n i n t h e sample a t t h e beginning of t h e experiment j u s t a f t e r t h e i s o t o p e w a s added i s
Ai.
The atom per cent e x c e s s 1 5 N i n t h e p a r t i c u l a t e n i t r o g e n ( P N ) on t h e f i l t e r a t t h e end of t h e experiment i s A f .The l e n g t h of t h e i n c u b a t i o n p e r i o d i n h o u r s i s h .
14c
and i n c u b a t i o n s were c a r r i e d o u t s i m u l t a n e o u s l y i n a s e t of f o u r t e m p e r a t u r e - c o n t r o l l e d w a t e r b a t h s p l a c e d o u t d o o r s a t t h e Winton l a b o r a t o r y s i t e . Two of t h e t a n k s were h e l d a t t h e ambient r i v e r t e m p e r a t u r e , oneloOc
h i g h e r and one 1 0 ' ~ l o w e r . Five l i g h t l e v e l s( l o o % ,
55%,
33%,
12%, and400 nm t o 700 nm. U s u a l l y , i n c u b a t i o n s were begun a t 1000 and ended a t 1400 EST.
P h o t o s y n t h e s i s w a s measured on e v e r y sampling d a t e
between November 1974 and November 1975, b u t n i t r o g e n uptake w a s measured only between A p r i l and November 1975. Each p h o t o s y n t h e s i s experiment c o n s i s t e d o f : (two r e p l i c a t e s of each l i g h t i n t e n s i t y ) X ( t h r e e t e m p e r a t u r e s ) X ( f o u r s t a t i o n s ) , f o r a t o t a l of 120
1 4 ~
samples. The 1 5 N experiments always i n c l u d e d a s e t of samples c o n s i s t i n g ofr (two r e p l i c a t e s of two l i g h t i n t e n s i t i e s ; ambient and d a r k ) X ( 1 5 ~ 0 andl 5 N ~ 4 )
3
X ( 4 s t a t i o n s ) run a t ambient r i v e r t e m p e r a t u r e . A v a r i e t y of e x t r a
1 5 ~
experiments were conducted from time t o t i m e . On some o c c a s i o n s , f o r example, samples were i n c u b a t e d a t a l l t h r e e t e m p e r a t u r e s . Sometimes uptake r a t e v s . n u t r i e n t con- c e n t r a t i o n w a s determined by i n n o c u l a t i n g s e t s of samples w i t h v a r i o u s amounts of t h e i s o t o p e , u s u a l l y3
p g , 7 p g ,14
y g , and 42 p g 1 5 N .C . N u t r i e n t Analyses and Algai Biomass
Soon a f t e r t h e i n c u b a t i o n s were begun, samples f o r t o t a l K j e l d a h l n i t r o g e n , d i s s o l v e d n i t r o g e n , p a r t i c u l a t e n i t r o g e n , and a l g a l biomass were p r e p a r e d . Whatman GF/C g l a s s - f i b e r f i l t e r s were used t o s e p e r a t e p a r t i c u l a t e and d i s s o l v e d n i t r o - gen samples. These f i l t e r e d samples, a l o n g w i t h samples of whole w a t e r , were q u i c k - f r o z e n ( u s i n g d r y i c e ) i n p o l y e t h y l e n e b o t t l e s and s t o r e d f r o z e n u n t i l n u t r i e n t s could be a n a l y z e d . The f i l t e r s were d r i e d and s t o r e d i n a d e s s i c a t o r . P l a n k t o n samples were p r e s e r v e d w i t h L u g o l ' s a c e t i c a c i d s o l u t i o n .
N i t r a t e and n i t r i t e were a n a l y z e d by s t a n d a r d methods o u t l i n e d i n S t r i c k l a n d and P a r s o n s ( 1 9 6 8 ) . Ammonia w a s mea- s u r e d by a m o d i f i c a t i o n of t h e Solorzano method (Solorzano 1969)
,
as d e s c r i b e d i n L i d d i c o a t e t a l . (1975).
P a r t i c u l a t e n i t r o g e n on t h e f i l t e r s was measured i n a Coleman N i t r o g e n A n a l y z e r * Between May and November 1975 t o t a l Kjeldahl n i t r o -i n Standard Methods (1971). Values f o r d i s s o l v e d organic n i t r o g e n ( D O N ) were obtained by s u b t r a c t i n g PN and NH4 f r o m
t h e TKN v a l u e s . Plankton samples were counted by t h e
Utermohl sedimentation technique (Lund e t a l . 1958) w i t h an i n v e r t e d microscope. Algal bio,mass was c a l c u l a t e d from t h e number of i n d i v i d u a l s per l i t e r and t h e esti,mated average
RESULTS AND DISCUSSION
A. Seasonal Patterns
1. Nitrogen Concentrations
Nitrate levels in the Chowan River are high in the late
winter and low during the summer. For example, at Colerain
the nitrate concentration was around 400
s gN *
liter-' during
January and February 1975 (Fig.
5).
By July and August the
nitrate had decreased to less than 10 a g ~aliter-l.
Then, in
September and October 1975 the nitrate began to increase
again, apparently climbing toward another winter peak, The
same seasonal pattern occurred at the three other sampling
stations (Figs.
4and
5 ) ,
but the winter-to-summer decline
was less pronounced at the upstream stations than at the
river mouth.
There are at least two factors which cause nitrate levels
to fluctuate seasonally in the Chowan. The first is varying
upstream input of nitrate. Gilliam and Lutz (1972) studied
the nitrogen in the ground water of the Coastal Plain and
found that the nitrate in the runoff greatly increased as soon
as the crops were harvested and the ground water was recharged
by the
fallrains. Thus, input
ofnitrate from the Chowan
Basin is much greater in winter than in summer. The second
factor affecting nitrate levels in the river is biological
activity of micro-organisms (algae and bacteria) in the water
and sediments. This will
bediscussed later in more detail,
but can
besummarized here. Because environmental factors
affecting algal growth (e.g.,
temperature and light intensity)
are more favorable in summer, more nitrate is removed from
the water by the growing algae in summer than in winter.
Nitrate levels in the Chowan are similar to those in
other coastal systems of the Mid-Atlantic Region. For example,
Hobbie repeatedly found highest nitrate during the winter
WINTON
HARRELLSVILLE
AMMONIA
NITRATE
r
I
NITRATE '. - - -. ...-
---
River e s t u a r i e s (Hobbie 1974, Hobbie 1975). I n both e s t u a r i e s n i t r a t e was very l o w during t h e summer. T h i s same s e a s o n a l p a t t e r n was noted f o r t h e Chesapeake Bay by Carpenter e t a l .
(1 969)
,
although t h e r e t h e winter c o n c e n t r a t i o n s were some- what higher t h a n i n t h e North C a r o l i n a estuaries, presumably because o f considerable p o l l u t i o n i n t h e upper p a r t o f t h e bay.O f a l l t h e n i t r o g e n f r a c t i o n s measured i n t h e Chowan, n i t r i t e w a s by f a r t h e l e a s t abundant. Concentrations ranged from undetectable e m ,l e s s t h a n 1 p g N S l i t e r - I ) t o only about 1 4 >g N * l i t e r - ' , Furthermore, t h e r e were no s e a s o n a l
o r s p a t i a l t r e n d s i n t h e n i t r i t e c o n c e n t r a t i o n s . The d a t a a r e n o t presented g r a p h i c a l l y , but a r e included i n Appendix A .
S i m i l a r l y , Hobbie (1975) found no more than about 20 p g N D
l i t e r - ' a s n i t r i t e a t any time i n t h e Neuse River E s t u a r y . Indeed, n i t r i t e i s n o t common i n n a t u r a l w a t e r s except i n s i t u a t i o n s where ammonia i s being oxidized t o n i t r a t e o r where n i t r a t e i s being d e n i t r i f i e d t o ammonia. Even t h e n , however, n i t r i t e c o n c e n t r a t i o n s do n o t u s u a l l y b u i l d up, s i n c e t h e s e t r a n s f o r m a t i o n s a r e r e l a t i v e l y r a p i d and complete,
I n comparison t o n i t r a t e , ammonia l e v e l s i n t h e Chowan showed l e s s s e a s o n a l v a r i a t i o n and were u s u a l l y lower t h a n t h e n i t r a t e c o n c e n t r a t i o n s . A t C o l e r a i n t h e range was from around 100 pg
liter-I
i n January t o l e s s t h a n 1 0 p g liter-Ii n J u l y ( F i g .
5 ) .
A s i n t h e case o f n i t r a t e , t h e s e ammonia l e v e l s seem t y p i c a l f o r n a t u r a l systems i n t h i s r e g i o n (Hobbie 1974, 1975; Carpenter e t al. 1969) ,Most o t h e r l a k e s and e s t u a r i e s t h a t have been s t u d i e d a l s o show l i t t l e o r no c l e a r - c u t s e a s o n a l p a t t e r n i n ammonia concerArations. This f a c t i s c i t e d a s evidence t h a t ammonia i s r a p i d l y r e g e n e r a t e d i n t h e water and sediments of a q u a t i c systems. I n a subsequent s e c t i o n we w i l l p r e s e n t o t h e r e v i - dence from
1 5 ~
t r a c e r s t u d i e s t h a t t h i s i s indeed t h e case i n t h e lower Chowan River a t some times of t h e y e a r ,n i t r o g e n and d e t r i t a l n i t r o g e n i n p a r t i c l e s t h a t a r e r e t a i n e d on a f i l t e r t h a t h a s a pore s i z e of about
0 . 5
,urn. P a r t i c u l a t e n i t r o g e n l e v e l s were r e l a t i v e l y high during w i n t e r and summer i n t h e Chowan and lower i n s p r i n g and f a l l ( F i g s .6
and 7 ) . Highest v a l u e s were around 400 s g N - l i t e r - ' and t h e lowest were about 75 g g N o l i t e r - ' . Thus, PN i s an important n i t r o g e n f r a c t i o n i n t h e r i v e r because it r e p r e s e n t s a s i g n i f i c a n tp a r t of t h e t o t a l n i t r o g e n i n p u t and because it i s continuously being broken down i n t o i n o r g a n i c forms, p r i m a r i l y ammonia,
t h a t can be used by t h e phytoplankton. U n f o r t u n a t e l y , t h e r a t e of t h i s breakdown remains unknown.
Apparently, most of t h e PN i n t h e r i v e r i s d e t r i t a l . During t h e 1975 summer t h e average a l g a l biomass was around 1 5 mg wet wgtmliter-' ( s e e n e x t s e c t i o n ) . T h i s is e q u i v a l e n t t o approximately 100 pg N l i t e r - ' , assuming a carbon-nitrogen r a t i o of 7 r l and a wet weight-to-carbon conversion of 0 . 0 5
( S t r i c k l a n d 1958). Thus, s i n c e t h e summer PN l e v e l s were
o f t e n over 200 p g ~ m l i t e r - l , a t l e a s t 50% o f i t must have been d e t r i t a l . During t h e w i n t e r , almost a l l of t h e PN w a s d e t r i t a l s i n c e a l g a l biomass was very low then ( e q u i v a l e n t t o l e s s t h a n
1 0 p g N - l i t e r - ' ) compared t o t h e t o t a l PN c o n c e n t r a t i o n s , which were 1 0 0 p g N * l i t e r - ' o r more ( ~ i g s .
6
and 7).
Dissolved organic n i t r o g e n (DON) makes up a high per- centage ( F i g s . 8 and 9) o f t h e t o t a l n i t r o g e n i n p u t t o t h e Chowan. Between June and November 1975 t h e c o n c e n t r a t i o n s averaged approximately 600 p g Noliter-' and ranged from 200
t o 1 2 0 0 sg N - l i t e r - ' . Often t h i s w a s 1 0 t o 100 times t h e amount of d i s s o l v e d i n o r g a n i c n i t r o g e n p r e s e n t (ammonia, n i t r i t e , and n i t r a t e ) . Except d u r i n g June and August DON
c o n c e n t r a t i o n s were a l s o h i g h e r , by a f a c t o r of 2 t o
5
times, t h a n t h e PN l e v e l s . However, there w a s no c l e a r p a t t e r n i n t h e DON l e v e l s . Likewise, Hobbie found t h a t i n t h e Neuse River and Pamlico River e s t u a r i e s DON was u s u a l l y t h e most abundant f o r m o f n i t r o g e n (range 70-
350 y g N w l i t e r - ' ) b u t t h a t t h e c o n c e n t r a t i o n s d i d n o t appear t o c o r r e l a t e very w e l lI I I I
I
I I II
0 0 0 0 0 0 0 0
0 0 0
z
0 0 0 0e m -
*
ca*
N
F
M
A
M
J
J
1974
1975
DON
DON
I
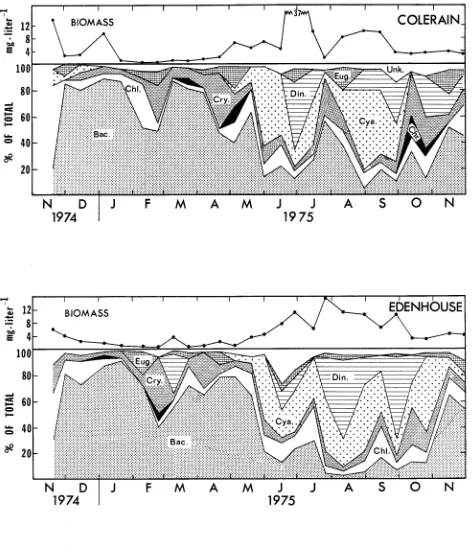
2 . Phytoplankton Composition and Biomass
I n t h e Chowan, diatoms made t h e g r e a t e s t c o n t r i b u t i o n
t o t h e a l g a l biomass d u r i n g t h e w i n t e r , whereas d i n o f l a g e l l a t e s , b l u e - g r e e n , and g r e e n a l g a e formed most of t h e summer b i o -
mass ( F i g s . 10 and 11)
.
A t t h e r i v e r ,mouth (Edenhouse s t a - t i o n ) , f o r example, diatoms, mostly s p e c i e s of M e l o s i r a ,u s u a l l y accounted f o r over 75% of t h e t o t a l biomass i n samples c o l l e c t e d between November and May. Following a r a p i d d e c l i n e i n diatom abundance i n t h e l a t e s p r i n g , blue-green a l g a e
( e . g . , M i c r o c y s t i s , Anabaena, Aphanozomenon) and d i n o f l a g e l l a t e s ( P e r i d i n i u m ) began t o predominate, t o g e t h e r making up as much as 80% of t h e biomass from June through October. Green a l g a e
(Coelosphaerium, M i c r o a s t e r i a s , Scenedesmus), and Eugleno- p h y t a were p r e s e n t i n s m a l l e r q u a n t i t i e s throughout t h e y e a r , and Chrysophyta were observed i n a few samples.
T h i s p a t t e r n
i s
about t h e same as t h a t which Whitford (1958) d e s c r i b e d as b e i n g t y p i c a l f o r North C a r o l i n a C o a s t a l P l a i n l a k e s and ponds. He n o t e d t h a t t h e r e seemed t o be a c o r r e l a t i o n between t h e winter-to-summer s h i f t from diatoms t o g r e e n and b l u e - g r e e n a l g a e and changes i n w a t e r t e m p e r a t u r e , b u t c a u t i o u s l y added t h a t t h e i n t e r a c t i o n of many f a c t o r sd e t e r m i n e s t h e r e l a t i v e abundance of any one s p e c i e s . A l g a l biomass i n t h e r i v e r was l o w e s t d u r i n g w i n t e r (average l e s s t h a n 1 m g 0 l i t e r - ' wet weight) and h i g h e s t i n summer ( a v e r a g e about 15 m g * l i t e r - ' wet weight)
.
However, a s shown i n F i g s . 10 and 11,
s e v e r a l of t h e summer samples con- t a i n e d l a r g e numbers of one o r two s p e c i e s which r a i s e d t h e t o t a l biomass t o as h i g h as 37 m g * l i t e r - I ( e . g . ,30
J u n e 1975 a t C o l e r a i n s t a t i o n ) . I n t h i s c a s e a s p e c i e s of P e r i d i n i u m accounted f o r more t h a n h a l f t h e t o t a l wet weight. L a t e r , i n August, l a r g e numbers of P e r i d i n i u m a l o n g w i t h two s p e c i e sof b l u e - g r e e n s ( i n t h e g e n e r a Synechoccus and Aphanozomenon) produced u n u s u a l l y h i g h biomass peaks of about 21 and 1 9 mga l i t e r - ' a t H a r r e l l s v i l l e and Winton r e s p e c t i v e l y ( F i g . 1 0 ) .
d 1 I I I
I
I I
L
BIOMASS COLERAIN
BA
4
N D I J F M A M J J A S O N
1974
1975
N
D I J
F M A M J J A S O N1974
1975
l a k e s and e s t u a r i e s i n North C a r o l i n a , t h e Chowan biomass l e v e l s d u r i n g 1975 were n o t u n u s u a l . A f t e r s u r v e y i n g 6 9
n a t u r a l l a k e s and inpoundments i n t h e s t a t e , Weiss and
Kueneler (1976) found t h a t most had between 1 and
6
rng.liter-' of a l g a l biomass d u r i n g t h e summer. Also, a l t h o u g h t h e s e a s o n a l p a t t e r n s a r e d i f f e r e n t , t h e Chowan and t h e Pamlico R i v e rE s t u a r y have s i m i l a r q u a n t i t i e s of phytoplankton. I n t h e Pamlico t h e wet weight biomass a v e r a g e s around
5
t o 10 mge l i t e r - ' e x c e p t d u r i n g b r i e f p e r i o d s i n t h e l a t e w i n t e r when blooms of P e r i d i n i u m t r i q u e t r u m r a i s e t h e biomass t o around 50 r n g * l i t e r - ' (Hobbie 1972).
I t s h o u l d be n o t e d , however, t h a t d u r i n g t h e c o u r s e of t h i s s t u d y we d i d n o t e n c o u n t e r any blooms i n t h e Chowan l i k e t h o s e which o c c u r r e d i n t h e summers of 1972-1974, However, r e c e n t l y C . Balducci ( p e r s o n a l communication) c o l l e c t e d samples a t t h e C o l e r a i n s t a t i o n d u r i n g t h e e a r l y summer of 1976 when a n a l g a l bloom covered t h e water s u r f a c e w i t h a v i s i b l e l a y e r
of b l u e - g r e e n a l g a e , mostly Anabaena and M i c r o c y s t i s s p e c i e s . I n t h e s e s u r f a c e samples, t h e a l g a l biomass was a s h i g h as 100 m g . l i t e r - l .
3 .
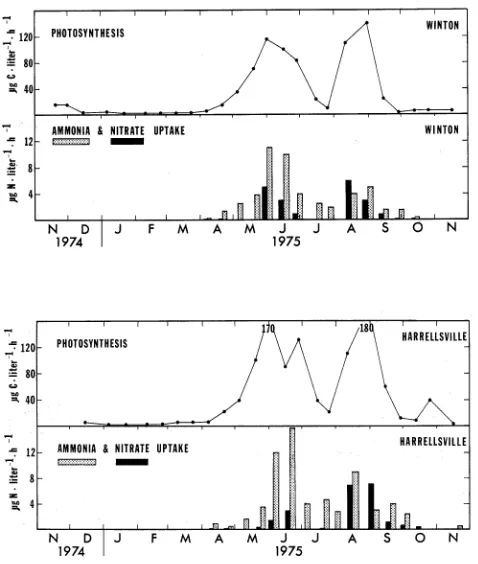
P h o t o s y n t h e s i s and I n o r g a n i c Nitrogen UptakePHOTOSYNTHESIS
N
D I J F M A M J J A S O NFig.
12.Midday rates of algal photosynthesis and nitrate and
ammonia uptake for surface samples
fromthe Winton
PHOTOSYNTHESIS
AMMONIA & NITRATE UPTAKE
There w a s one u n u s u a l d i p i n t h e summertime a l g a l photo- s y n t h e s i s which w a s most n o t i c e a b l e a t t h e two u p - r i v e r
s t a t i o n s , Winton and H a r r e l l s v i l l e , A t t h e s e s t a t i o n s , t h e r a t e s f e l l r a p i d l y d u r i n g J u l y 1975 t o about 10% of t h e May and June r a t e s , b u t t h e n i n c r e a s e d a g a i n i n August t o t h e
t y p i c a l summertime r a t e s ( a b o u t 125 pg
c
* l i t e r m 1 ah-').
T h i s s h o r t - l i v e d b u t p r e c i p i t o u s d e c l i n e d i d n o t occur a t Eden- house and C o l e r a i n ( F i g .1 3 ) $
where, i n s t e a d , t h e h i g h r a t e s of p h o t o s y n t h e s i s p e r s i s t e d throughout J u l y and August. The most l i k e l y cause of t h i s anomaly w a s t h e u n u s u a l l y h i g h r i v e r flow, which peaked a t n e a r l y 50,000 c f s i n mid-July 1975.T h i s w a s 10 t o 20 t i m e s t h e normal flow f o r t h a t time of y e a r and w a s t h e h i g h e s t flow d u r i n g t h e e n t i r e 1975 c a l e n d a r y e a r , ( F i g . 2 ) . Consequently, t h e r e w a s a s e v e r e washout of t h e
a l g a e i n t h e W i n t o n - H a r r e l l s v i l l e r e g i o n . F a r t h e r down-river t h e c r o s s - s e c t i o n a l a r e a of t h e Chowan i n c r e a s e s much more r a p i d l y t h a n t h e volume of water c a r r i e d , s o t h a t flow r a t e s do n o t v a r y n e a r l y s o much a t t h e mouth as f a r t h e r u p r i v e r . T h i s probably e x p l a i n s why t h e washout was n o t n o t i c e a b l e a t t h e C o l e r a i n and Edenhouse s t a t i o n s . T h i s example i l l u s t r a t e s t h e s t r o n g e f f e c t t h a t f l o w r a t e can have on t h e q u a n t i t y of a l g a e i n a r i v e r l i k e t h e Chowan. Another example of t h e e f f e c t w a s r e p o r t e d by Hobbie (1971) f o r t h e Pamlico R i v e r E s t u a r y , where t h e 1968 P e r i d i n i u m bloom w a s t e m p o r a r i l y washed o u t of t h e r i v e r f o l l o w i n g heavy r a i n s .
I n a d d i t i o n t o r i v e r f l o w r a t e t h e r e a r e s e v e r a l o t h e r i m p o r t a n t f a c t o r s t h a t i n f l u e n c e d t h e s e a s o n a l p a t t e r n of a l g a l growth i n t h e Chowan. Among t h e s e a r e s o l a r r a d i a t i o n , w a t e r t e m p e r a t u r e and n u t r i e n t a v a i l a b i l i t y , a l l of which w i l l be examined q u a n t i t a t i v e l y i n a l a t e r s e c t i o n of t h i s r e p o r t .
A s e x p e c t e d , n i t r o g e n uptake by t h e p l a n k t o n f o l l o w e d t h e same s e a s o n a l p a t t e r n a s p h o t o s y n t h e s i s . There i s no n i t r o g e n uptake d a t a between November 1974 and March
1975.
our understanding of t h e s e a s o n a l c y c l e and c a l c u l a t i o n s of t o t a l annual a s s i m i l a t i o n of n i t r o g e n i n t h e r i v e r . For example, assuming t h a t carbon and n i t r o g e n uptake r a t e s approximated t h e Redfield e t a l . (1963) C I N atomic r a t i o of 7 r 1 , we e s t i m a t e d wintertime v a l u e s f o r n i t r a t e and ammonia uptake t o be l e s s than 1 jag N e l i t e r - l - h - ' on most days. By mid-summer, t h e measured r a t e s had r i s e n t o about 1 0 y g N 9
l i t e r - ' ah-' of ammonia and 4 pg N a l i t e r - ' sh-' o f n i t r a t e .
Then a s a l g a l growth r a t e s and biomass decreased during Sep- tember and October, n i t r o g e n uptake r a t e s a l s o decreased.
B. K i n e t i c s of Photosynthesis and Nitrogen Uptake
1. Temperature E f f e c t s
Te,mperature f l u c t u a t i o n s caused p a r t of t h e g r e a t sea- s o n a l v a r i a b i l i t y i n a l g a l growth r a t e s i n t h e Chowan. Experi- ments showed t h a t both photosynthesis and n i t r o g e n uptake
i n c r e a s e d a s water te,mperature i n c r e a s e d . For example, i n one experi,ment i n August 1975, photosynthesis approximately doubled (Q10=2 . 0 ) between 8 ' ~ and 18Oc. I n concurrent e x p e r i - ments, ammonia and n i t r a t e uptake r a t e s t r i p l e d (Q10=2.8-3.3)
( F i g . 1 4 ) . The Q l O v s seemed t o remain about t h e same over t h e whole range o f temperatures o c c u r r i n g i n t h e r i v e r d u r i n g t h e y e a r . Therefore, we conclude t h a t temperature a l o n e , i n t h e absence of s e v e r e l t m i t a t i o n by o t h e r f a c t o r s , w a s respon- s i b l e f o r a 6-to-10 f o l d s e a s o n a l d i f f e r e n c e i n t h e r a t e of a l g a l growth and n i t r o g e n a s s i m i l a t i o n .
2 . L i g h t E f f e c t s and Die1 Uptake
A t y p i c a l s e t of d a t a f o r photosynthesis and n i t r o g e n uptake v s . l i g h t a t d i f f e r e n t te,mperatures a r e shown i n F i g .
PHOTOSYNTHESIS
I I I I I
A M M O N I A UPTAKE
NITRATE UPTAKE / E
C
Q,,
= 3.3E
Q,,
=
3.04
8
12
1620
24
28
TEMPERATURE (OC
)
Fig.
14.
Effect of increasing temperature on rates of algal photosynthesis and nitrate and ammonia uptake at three Chowan River stations: Edenhouse(E),
ColerainPHOTOSYNTHESIS
15 June, 1975
( Colerain 9
AMMONIA
&NITRATE UPTAKE
(@olerain)15 June, 1975
e
Nitrate
20%
SOLAR RADIATION
(
ly
minute-')
Fig. 15. Effect of increasing light intensity on photosynthesis and nitrate and ammonia uptake at the Colerain
water t e m p e r a t u r e . S i m i l a r l y , ammonia and n i t r a t e uptake r a t e s f i r s t i n c r e a s e d w i t h i n c r e a s i n g l i g h t t o a s a t u r a t i o n l e v e l and t h e n d e c l i n e d a t h i g h e r i n t e n s i t i e s . Here a g a i n , t h e degree of l i g h t i n h i b i t i o n w a s i n v e r s e l y r e l a t e d t o l i g h t i n t e n s i t y ( d a t a n o t shown)
.
Our d a t a f o r n i t r o g e n uptake v s . l i g h t a r e similar t o o t h e r s t h a t have been p l o t t e d f o r marine phytoplankton
assemblages and f o r s i n g l e s p e c i e s of a l g a e i n c u l t u r e . The c u r v e s t a k e t h e shape of r e c t a n g u l a r h y p e r b o l a s , up t o t h e p o i n t of l i g h t s a t u r a t i o n . They may be d e s c r i b e d by t h e f o l l o w i n g e q u a t i o n r
where V i s t h e r a t e of n i t r o g e n uptake ( p g N l i t e r - ' * h - l )
,
Vd i s t h e dark uptake r a t e , Vmax i s t h e maximum, l i g h t s a t u r a t e d u p t a k e , and I i s l i g h t i n t e n s i t y . The l i g h t i n t e n s i t y c o r r e - sponding t o$vmaX
i s1 0 , 5 :
it i s c a l l e d t h e l i g h t h a l f - s a t u - r a t i o n c o n s t a n t (MacIssac and Dugdale 19'72).Chowan I
0 . 5 v a l u e s , e s t i m a t e d from g r a p h s l i k e F i g .
15,
u s u a l l y were around 0 . 0 5 ly a min-'.
MacIssac and Dugdale (1 969)r e p o r t e d I
0 . 5
v a l u e s around 0.005-
0.02 lyomin-' f o r phyto-p l a n k t o n i n t h e t r o p i c a l P a c i f i c Ocean, b u t Bates (1976) found t h a t I0 v a r i e d , depending on t h e p r e v i o u s l i g h t h i s t o r y of t h e a l g a l c e l l s . Shade-adapted c e l l s of some s p e c i e s had a
lower I
0 . 5
t h a n sun-adapted c e l l s .N e v e r t h e l e s s , even on cloudy days n i t r o g e n uptake a t t h e s u r f a c e of t h e Chowan must be l i g h t s a t u r a t e d , whereas l i g h t i n t e n s i t y must almost always l i m i t t h e u p t a k e i n t h e deeper w a t e r s o f t h e r i v e r , where l i g h t l e v e l s f a l l below 0 . 0 5 l y * min-l. For example, i f t h e s u r f a c e i n t e n s i t y were 1 . 0 l y s min-'