DOI: 10.1534/genetics.107.073601
Mating Systems and the Efficacy of Selection at the Molecular Level
Sylvain Gle´min
1Institut des Sciences de l’Evolution (UM2-CNRS), Universite´ Montpellier II, 34095 Montpellier Cedex 5, France
Manuscript received March 20, 2007 Accepted for publication July 28, 2007
ABSTRACT
Mating systems are thought to play a key role in molecular evolution through their effects on effective population size (Ne) and effective recombination rate. Because of reducedNe, selection in self-fertilizing species is supposed to be less efficient, allowing fixation of weakly deleterious alleles or lowering adap-tation, which may jeopardize their long-term evolution. Relaxed selection pressures in selfers should be detectable at the molecular level through the analyses of the ratio of nonsynonymous and synonymous divergence,Dn/Ds, or the ratio of nonsynonymous and synonymous polymorphism,pn/ps. On the other hand, selfing reveals recessive alleles to selection (homozygosity effect), which may counterbalance the reduction inNe. Through population genetics models, this study investigates which process may prevail in natural populations and which conditions are necessary to detect evidence for relaxed selection signature at the molecular level in selfers. Under a wide range of plausible population and mutation parameters, relaxed selection against deleterious mutations should be detectable, but the differences between the two mating systems can be weak. At equilibrium, differences between outcrossers and selfers should be more pronounced using divergence measures (Dn/Dsratio) than using polymorphism data (pn/psratio). The difference in adaptive substitution rates between outcrossers and selfers is much less predictable because it critically depends on the dominance levels of new advantageous mutations, which are poorly known. Different ways of testing these predictions are suggested, and implications of these results for the evo-lution of self-fertilizing species are also discussed.
M
ATING systems are thought to have a deep impact on molecular evolution. They affect the effective population size,Ne, which plays a crucial role in molec-ular evolution because it controls the amount of poly-morphism and the efficacy of selection (Charlesworth and Wright 2001). Inbreeding is expected to directly lowerNeby reducing the number of independent gam-etes sampled for reproduction. Because inbreeding also reduces the efficacy of recombination,Necan be reduced further through hitchhiking effects: the elimination of deleterious alleles or the spread of advantageous muta-tions at linked loci increases the local level of genetic drift (Maynard-Smithand Haig1974; Charlesworthet al.1993). Finally, bottlenecks should be more severe in selfers than in outcrossers (Schoenand Brown1991) because in selfers a single seed can found a new popu-lation (Baker1955). The efficacy of selection depends on the productNes, wheresis the selection coefficient, such that selection should be less effective in selfers than in outcrossers. At the molecular level, selection intensity can be estimated due to the comparison of (presumably neutral) synonymous and (presumably selected) non-synonymous polymorphisms or substitutions.
While the effect of selfing on polymorphism levels is well documented (Hamrick and Godt 1996; Nybom 2004; Gle´ min et al. 2006), its impact on selection ef-ficacy has been assessed only in a few studies, without strong evidence. Bustamante et al. (2002) suggested that the self-fertilizing species Arabidopsis thaliana has mainly fixed slightly detrimental mutations, whereas
Drosophila melanogasterhas preferentially fixed beneficial mutations. However, Wrightet al.(2002) did not find any difference in the rate of protein evolution in codon bias betweenA. thalianaand its outcrossing close relative
A. lyrata. More recently, a survey of sequence polymor-phism data in flowering plants revealed a weak increase in the pn/ps ratio in selfers compared to outcrossers, suggesting relaxation of selective constraints in selfers (Gle´ minet al.2006).
Despite that only few studies are available, several hypotheses have been suggested to explain the weak signal of reduced selection efficacy in selfers. First, the strength of selection obviously depends on the (poorly known) genomic distribution of selection coefficients and recombination rates. For instance, under the pure neutral model with just neutral and strongly deleterious mutations, virtually no effect is expected. Second, if selfers are of recent origin, such as suggested for A. thaliana
(Charlesworth and Vekemans 2005; Bechsgaard
et al. 2006), the change in the selective regime could be too recent to have significantly affected the Dn/Ds 1Address for correspondence:UMR 5554, Institut des Sciences de
l’Evolu-tion, CC64 Bat 22, Universite´ Montpellier II, Place Euge`ne Bataillon, 34095 Montpellier Cedex 5, France. E-mail: [email protected]
ratio. According to this hypothesis, a stronger signal should be detectable in intraspecific polymorphism an-alyses, which may explain the results of Gle´ min et al. (2006). Finally, theoretical reasons can also be invoked. Indeed, selfing also affects the efficacy of selection by increasing homozygosity and thus exposing recessive alleles to selection, as in the well-known purging process of deleterious mutations through selfing (Ohta and Cockerham1974). This effect can counteract the effect of reducing Ne. Charlesworth (1992) studied the rate of evolution in selfers through the fixation proba-bility of mutations with any dominance level. Considering the sole reduction inNedue to nonindependent gamete sampling under inbreeding (that is, a 50% reduction under complete selfing), he showed that selection is less efficient under partial selfing for dominant mutations but more efficient for recessive ones. Quantitatively he found a minor effect on the fixation of deleterious mu-tation but a significant one on the fixation of recessive advantageous alleles. However, Charlesworth(1992) did not take into account the reduction inNedue to bottlenecks or hitchhiking effects. It is thus not clear how muchNemust be reduced beyond the twofold level to overwhelm the homozygosity effect.
To address this issue previous population genetic models are expanded by focusing on the impact of partial selfing and dominance level on several measures commonly used in molecular evolution. Genes under purifying selection are considered first, assuming con-stant selection against deleterious mutations or a distri-bution of selection and dominance coefficients. Then, the case of advantageous mutations is presented. For each case, the additional reduction inNethat is necessary to allow detection of relaxed selection in selfers at the molecular level is determined. The effect of population subdivision is also addressed. Different ways of testing these predictions are suggested, and the implications of these results for the evolution of self-fertilizing species are also discussed.
MODEL AND RESULTS
General formulation: The aim of this article is to develop predictions for two commonly used measures of selection in molecular evolution, namely theDn/Ds ratio (vhereafter) and thepn/psratio (f0hereafter).Dn andDs are the mean substitution rate, per generation per nonsynonymous and per synonymous site, respec-tively.pnandpsare nonsynonymous and synonymous nucleotide diversity (Tajima1983). As in previous stud-ies (Piganeau and Eyre-Walker 2003; Loewe et al. 2006), the model assumes an infinite-site mutation model, autosomal inheritance, and independently evolving sites (free recombination). Mutations occur at rate m and synonymous sites are supposed to evolve neutrally so that
ps¼4Nem ð1aÞ
and
Ds¼m: ð1bÞ
Nonsynonymous mutations can be neutral, deleterious, or advantageous, in proportion cn, cd, and ca, respec-tively (cn 1 cd 1 ca ¼ 1). Deleterious mutations may contribute both to polymorphism and to divergence, while new advantageous mutations (distinct from back mutations from a deleterious allele) can spread rapidly to fixation, contributing to substitutions but not to poly-morphism (because they are likely to be rare,ca>1, and fixation occurs rapidly). We thus have
pn ¼cn4Nem1cdHd ð2aÞ
and
Dn¼cnm1cdDd1caDa; ð2bÞ
whereHdis the mean equilibrium diversity at sites under purifying selection, and Dd andDa are the mean sub-stitution rates at sites under purifying and positive se-lection, respectively. It follows that
f0¼cn1cdfd ð3aÞ
and
v¼cn1cdvd1cava; ð3bÞ where indexes d and a stand for the contribution of deleterious and advantageous mutations to f0 and v. Because mating systems do not affect the neutral part of
f0andv,cnis set to 0 for simplicity. Results remain un-changed since only relative values for different mating systems are considered. For simplicity, negative and pos-itive selections are also analyzed separately.
First, consider single populations with effective pop-ulation size Ne¼ aN/(1 1 F), where N is the actual population size, andF¼s/(2s) is the equilibrium Wright’s fixation index with selfing rate s. Compared with classical models, the parameterais introduced as a simple way to summarize the reduction in effective pop-ulation size due to hitchhiking and bottleneck effects. This parameter allows exploringNereduction in selfers without modeling explicitly bottleneck or hitchhiking effects, which would greatly increase the model com-plexity. To compare allogamous and autogamous pop-ulations,a¼1 in the former anda,1 in the latter. The main aim of the model is then to seekNereduction that is necessary to overwhelm the homozygosity effect, that is, to derive the limita-value for whichf0ja;F ¼f0ja¼1;F¼0 orvja;F ¼vja¼1;F¼0.
respectively (s , 0 for deleterious alleles, s . 0 for advantageous ones). Under strong selection (Njsj?1), deleterious alleles never reach fixation, so thatDn¼0. Mcvean and Charlesworth (1999) showed that the contribution to polymorphism of codominant (h¼1
2)
deleterious mutations is well approximated bypn2q, where q is their deterministic equilibrium frequency. This approximation still holds for any dominance level (see numerical results below), usingqm/ (h 1 F hF)jsj (Caballero and Hill 1992; Bataillon and Kirkpatrick2000) orq¼mpffiffiffiffiffiffiffiffiffiffiffiffiffiffiffiffiffi2pN=jsjfor fully recessive alleles (h ¼0) in a panmictic population (F¼0). This second approximation holds for 2Nm > 1 (Wright 1937; Nei1968), which is mostly true at the nucleotide level. From these arguments we get
v¼0 ð4Þ
and
f0 ¼ 11F
2Naðh1F hFÞ jsj forh6¼0 orF 6¼0 ð5aÞ
f0¼
ffiffiffiffiffiffiffiffiffiffiffiffip
2Njsj
r
forh ¼0 andF ¼0: ð5bÞ
According to (5)f0is a decreasing function ofFfor
h,1
2 and an increasing one forh.12. Recessive alleles
are more efficiently purged in self-fertilizing than in outcrossing populations and contribute less to poly-morphism. Under strong selection, the f0 ratio does depend onN, while the frequency of deleterious alleles remains constant (except for fully recessive ones). In such conditions, the interpretation of thef0ratio can be misleading because it does not directly estimate the strength of selection (which remains unchanged) but does estimate the fraction of deleterious mutations contrib-uting to polymorphism. Despite this limitation, we can easily findalimit:
alimit¼ ð11FÞh
F1hhF forh.0 ð6aÞ
alimit ¼
11F
Fpffiffiffiffiffiffiffiffiffiffiffiffiffiffiffiffi2pNjsj forh ¼0: ð6bÞ
For complete selfing, (6a) reduces to 2ffiffiffiffiffiffiffiffiffiffiffiffiffiffiffiffiffi h and (6b) to
p=2Njsj
p
, which is very low for recessive and nearly re-cessive alleles.
Arbitrary purifying selection: If selection is weak, dele-terious alleles can become fixed and then mutate back to the optimal allele. This will contribute both to poly-morphism and to divergence. As far as nucleotide se-quences are concerned, we have to consider four states at each site. To simplify, only two equivalence classes of selected sites are considered, namely the deleterious and
optimal classes, each containing one to three variants (for instance, see Figure 2 in Loeweet al.2006). Within each class, variants are thus neutral. This can be taken into account as in Equations 5a and 5b in Loeweet al. (2006). Provided that all mutation rates from each nu-cleotide are equal (which is implicitly assumed in Loewe
et al.2006), the following results do not depend on the number of variants per class because relative results be-tween selfers and outcrossers (not absolute ones) are con-cerned (numerical results not shown). For clarity only the two-allele case with symmetrical mutation rates is discussed below. Mutation biases induce more complex patterns and are not treated here (for instance, see McVeanand Charlesworth1999).
First, we need to compute the proportion of sites fixed either for the deleterious or for the optimal allele. Fol-lowing Bulmer(1991) or Piganeauand Eyre-Walker (2003), the proportion of sites fixed for the deleterious allele is
pd¼ 1
11uðs;1hÞ=uðs;hÞ; ð7Þ
whereu(s,h) is the fixation probability of an allele with initial frequency 1/2N, selective advantages. 0, and dominance levelh. It is worth noting that both selection coefficients and dominance levels are reversed between the two allelic states. If the deleterious allele (s) is re-cessive (h ¼0), the advantageous one (s) is dominant (h¼1). According to Kimura(1962),
uðs;hÞ ¼
Ð1=2N
0 GðxÞdx
Ð1 0 GðxÞdx
; ð8Þ
where GðxÞ ¼e
Ð
ð2Mdx=VdxÞ.Md
x andVdx are the
infini-tesimal mean and variance of the change in allele fre-quency of the diffusion process. In this model with partial selfing and an arbitrary level of dominance these terms are
Mdx¼sxð1xÞðF1hhF1ð1FÞð12hÞxÞ ð9aÞ
Vdx¼
xð1xÞ
2Ne ¼
xð1xÞð11FÞ
2aN ð9bÞ
(see, for instance, Charlesworth1992). We thus have
GðxÞ ¼Exp 2 aN
11Fsxð2h1ð12hÞð2F1ð1FÞxÞÞ
:
ð10Þ
pnis then given by
pn¼2Nmðpdcðs;1hÞ1ð1pdÞcðs;hÞÞ ð11Þ
and
f0 ¼11F
wherecðs;hÞis the expected contribution to heterozy-gosity of an allele with initial frequency 1/2N, selective advantages.0, and dominance levelh:
cðs;hÞ ¼8Neuðs;hÞ
ð1
0
Ð1
x GðyÞdy
GðxÞ dx ð13Þ
(for instance, see Equation A6 in McVean and Charlesworth1999). Similarly,
Dn ¼2Nmðpduðs;1hÞ1ð1pdÞuðs;hÞÞ ð14Þ
and
v¼2Nðpduðs;1hÞ1ð1pdÞuðs;hÞÞ ð15Þ
Expressions (12) and (15) have been computed using the NIntegrate function of the Mathematica software (Wolfram1996).
As shown in Figure 1, f0 and v are decreasing functions ofF for h,1
2 and increasing ones for h. 1 2.
Whenh¼1
2,GðxÞ ¼e 2aNs;f
0andvare thus indepen-dent of F (see also Charlesworth 1992). Unless mating system also affectsa, we do not expect any con-sequences of mating systems onf0andvfor codominant mutations. Figure 1 also shows a surprising result, which is emphasized in Figure 2. For recessive deleterious al-leles (h,1
2),f0andvreach a maximum,.1, under (very) weak selection (Ns,1), while they monotonically de-crease withNswhen deleterious alleles are codominant or dominant. This effect is stronger for f0than for v. This effect also occurs with partial selfing but the max-imum is reached for very lowNsvalues. Under complete selfing, there is no maximum. For very weak selection, about half of the sites are fixed for the deleterious allele and the other half for the advantageous one. If the del-eterious allele is recessive, its contribution to polymor-phism or divergence is almost the same as the contribution
of a neutral allele, while the reverse dominant advanta-geous mutation contributes more to polymorphism and divergence than neutral alleles. For stronger selection, most sites are fixed for the optimal allele and deleteri-ous mutations contribute very little to both polymor-phism and divergence. This explains the maximum inf0 andvreached for lowNsvalues. Similar patterns occur with mutation bias, without dominance (see Mcvean and Charlesworth1999).
alimit for weak selection:General analytical expressions
forf0andvare tremendous or not available so that only numerical results are presented. Table 1 gives numerical
alimit-values obtained when allogamous populations (F ¼0) and fully autogamous ones (F ¼1) are com-pared. As expected, alimitis lower for recessive muta-tions because they are easily purged by selfing so that strong reductions inNeare necessary to overwhelm this effect. Under strong selection, numerical results are close to analytical deterministic predictions. Under weaker selection,alimitis higher, which means that purging of recessive deleterious alleles by selfing is less efficient in small than in large populations, as already pointed out (Gle´ min2003). However, for very weak selection (Ns, 1),alimitcan be low, even negative for highly recessive mutations. This result comes from the peculiar pattern off0described above. If we do not assume back muta-tion,alimitmonotonically increases asNsdecreases. This result implies that it could be difficult to detect relaxed selection throughf0measure in selfers because weakly deleterious mutations contribute much to polymorphism. However, such mutations are supposed to be close to the codominance level for whichalimitis high and close to one (see below).
Table 2 showsalimit-values forv. The pattern is similar to that of f0but absolute values are much higher and close to one, even for recessive alleles. Without addi-tional reduction in Ne (a ¼ 1), recessive deleterious
Figure 1.—f0 (A) and v (B) for deleterious
mutations as a function ofFfor different domi-nance levels.Ns¼1 anda¼1 is constant. Thick lines correspond toh¼1
2. Other lines from
bot-tom to top: h ¼ 0, h ¼ 0.1, h¼ 0.3, h ¼ 0.7,
h¼0.9,h¼1.
Figure2.—f0(A) andv(B) for weak
deleteri-ous mutations as a function ofNs. Deleterious al-leles are recessive (h¼0, thick line), codominant (h¼1
2, thin line), or dominant (h ¼ 1, dashed
mutations are sheltered in outcrossing populations and reach much higher frequency than in self-fertilizing ones where they are unmasked in homozygotes. Higher
f0values are thus expected under panmixia so thatalimit needs to be rather small to compensate the homozygosity effect. However, such deleterious mutations are eventu-ally selected against with similar intensity in outcrossing as in self-fertilizing populations, and thus rarely reach fixation in both populations.v-values are thus similar in both populations so thatalimit-values close to one are sufficient to compensate for homozygosity. In other words, the dominance level of deleterious mutations, as well as the homozygosity effect, influences polymor-phism more strongly than divergence.
Variation ofawith selfing rate:It is not easy to predict howashould vary with the selfing rate in general. For instance, no model predicts how the frequency of
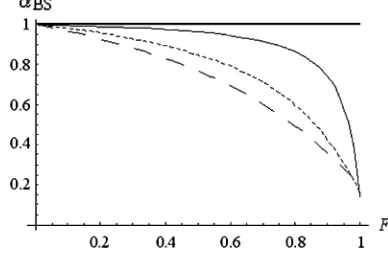
bot-tlenecks should increase with selfing. However, under the background selection (BS) hypothesis we can pre-dict the relationship betweenaandF. Here, this model is used as a quantitative example of howamay decrease withF. According to Charlesworth et al.(1993), the reduction inNedue to BS is
rðFÞ ¼Exp U
ðhd1F hdFÞsd1Rð1FÞ
; ð16Þ
whereUis the genomic deleterious mutation rate,Ris the genomic recombination rate, sdis the mean selec-tion coefficient against strongly deleterious mutaselec-tions, andhdis their dominance coefficient. We thus have
aBS¼rðFÞ=rð0Þ: ð17Þ
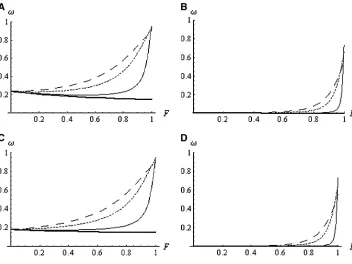
If the recombination rate is high, only highly self-fertilizing species suffer from a reduction inNedue to BS. If the recombination rate is lower,adecreases more linearly withF. Examples are given in Figure 3. Figures 4 and 5 show howf0andvvary as a function ofFunder the BS model.
For partially recessive alleles (h¼0.3), provided that BS is sufficiently strong (Urather high and R not too low)f0mainly increases withF. For fully recessive alleles,
f0reaches a minimum at intermediate selfing rates. The decrease invfor intermediate selfing rates is less pro-nounced, even for fully recessive alleles (Figure 5). In every case, only strong selfers experience significant re-laxation of selection (a strong increase in bothf0andv). Distribution of mutational effects:Previous analyses considered only the fate of alleles with fixed deleterious effect and dominance level while it is much more real-istic to assume variation in selective effects among muta-tions. Several studies showed that selection coefficients against deleterious mutations are well modeled by a gamma distribution
fðsÞ ¼s
a1es=b
baGðaÞ ð18Þ
TABLE 1
alimitfor f0for various combinations ofhandNs
Ns Strong selection
h 0.5 1 2 5 10 50 100
0 ,0 ,0 0.346 0.332 0.249 0.113 0.080
0.252 0.113 0.080
0.05 ,0 ,0 0.425 0.389 0.305 0.178 0.149
0.1
0.1 ,0 0.210 0.496 0.446 0.366 0.254 0.231
0.2
0.2 ,0 0.505 0.627 0.568 0.503 0.427 0.414
0.4
0.3 0.394 0.696 0.752 0.701 0.657 0.613 0.607
0.6
0.4 0.754 0.855 0.875 0.845 0.824 0.805 0.803
0.8
0.45 0.884 0.929 0.937 0.921 0.911 0.902 0.901
0.9
alimit was computed by numerically solving for equation
f0ja;F ¼f0ja¼1;F¼0. Under strong selection, analytical approxi-mations (Equations 6a and 6b) are given in italics.
TABLE 2
alimitforvunder purifying selection for various
combina-tions ofhandNs
Ns
h 0.5 1 2 5 10
0 0.055 0.684 0.833 0.930 0.965
0.05 0.314 0.719 0.848 0.935 0.968
0.1 0.441 0.753 0.864 0.941 0.971
0.2 0.625 0.818 0.897 0.954 0.977
0.3 0.768 0.881 0.930 0.968 0.984
0.4 0.890 0.941 0.965 0.983 0.991
0.45 0.947 0.971 0.982 0.991 0.995
alimit was computed by numerically solving for equation vja;F¼vja¼1;F¼0.
Figure3.—Variation ofawithFunder the BS model
(Keightley 1994; Piganeau and Eyre-Walker2003; Loeweet al.2006), whereais the shape parameter and
b the scale parameter, and G is the gamma function (Abramowitz and Stegun 1970). The mean and the variance of this distribution areabandab2, respectively.
Variation in dominance levels is less documented but both theoretical (Bourguet1999) and experimental ar-guments (Phadnisand Fry2005) suggest that strongly deleterious mutations (lethals, semilethals) are reces-sive while weakly detrimental ones are nearly
codomi-nant. One can thus assume thath ands are inversely related:
h¼ 1
2148s ð19Þ
(for a similar treatment see Higginsand Lynch2001). This expression is such thath¼1
2 fors¼0, whileh¼
0.02 for lethals, roughly reflecting values estimated in Drosophila (Mukai et al. 1972). Equations 12 and 15 become, respectively,
Figure 4.—f0 for deleterious
mutations as a function ofF for constanta¼1 (thick solid line) or a decreasing with F under the BS model (same values as in Figure 3). (A)h¼0 andNs¼2; (B)h¼0.3 andNs¼2; (C)h¼
0 andNs ¼10; (D) h¼0.3 and
Ns¼10.
Figure 5.—v for deleterious
mutations as a function of F for constant a (thick solid line) or a decreasing with F under the BS model (same values as in Fig-ure 3). (A) h ¼ 0 and Ns ¼ 2; (B)h¼0.3 andNs¼2; (C)h¼
0 andNs ¼10; (D) h¼0.3 and
f0¼
ð1
0
11F
2a ðpdcðs;1hÞ1ð1pdÞcðs;hÞ
fðsÞds
ð20Þ
and
v¼
ð1
0
f2Nðpduðs;1hÞ1ð1pdÞuðs;hÞgfðsÞds:
ð21Þ
In this treatment, deleterious mutations and back advan-tageous ones follow the same gamma distribution. In-tegration spans from 0 (neutral alleles) to 1 (lethals), so strictly speaking, the distribution is a truncated gamma but the probability mass between 1 and‘is very low.
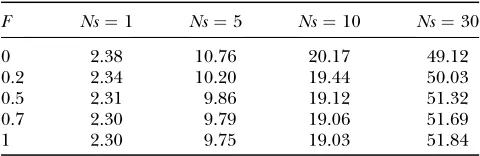
Table 3 gives some examples of the variation invwith
Fassuming either thatais constant or thatadecreases as F increases, as predicted under the BS hypothesis. Under the above assumptions, weakly deleterious muta-tions, which mostly contribute topnandDn, are nearly codominant. With constanta,f0andvare thus nearly invariant with F. With BS, f0 and v increase with F, revealing less efficient selection at the molecular level in selfers than in outcrossers. This is true even under strong recombination and therefore moderate BS effect. As in the previous case, only strong selfers show clear signals of relaxed selection. Results are very similar forf0but numerical integration of (20) is somewhat problematic and results may be imprecise and are not given here.
Positive selection: alimit for weak and strong positive selection: Consider now rare advantageous mutations (s.0). Such mutations either rapidly spread to fixation or become initially lost. They contribute to divergence, increasingDn, but not to polymorphism. Thev-ratio is .1. The following results are mainly similar to those of Charlesworth(1992) with slight modifications. With-out back mutation, we simply have
v¼2Nuðs;hÞ: ð22Þ
As for deleterious mutations, selection for recessive mu-tations ðh,1
2Þ is more efficient in selfers than in
out-crossers while the reverse is true for dominant ones (h.12) (see Charlesworth1992).
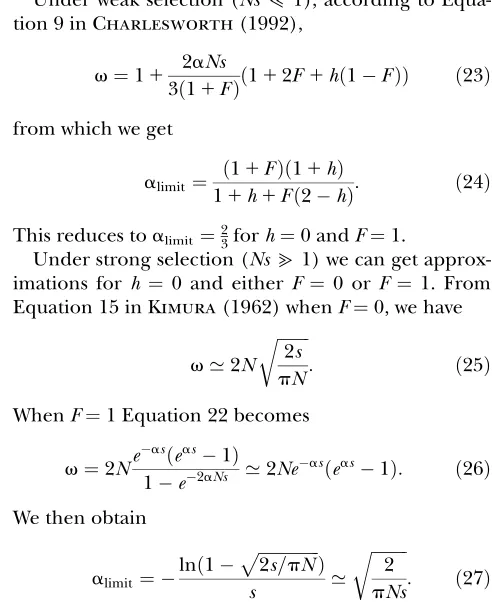
Under weak selection (Ns>1), according to Equa-tion 9 in Charlesworth(1992),
v¼11 2aNs
3ð11FÞð112F1hð1FÞÞ ð23Þ
from which we get
alimit ¼ ð11FÞð11hÞ
11h1Fð2hÞ: ð24Þ
This reduces toalimit ¼2
3forh¼0 andF¼1.
Under strong selection (Ns?1) we can get approx-imations for h ¼0 and either F ¼0 or F ¼ 1. From Equation 15 in Kimura(1962) whenF¼0, we have
v’2N
ffiffiffiffiffiffiffiffi 2s pN
r
: ð25Þ
WhenF¼1 Equation 22 becomes
v¼2Ne
asðeas1Þ 1e2aNs ’2Ne
asðeas1Þ: ð26Þ
We then obtain
alimit¼
lnð1pffiffiffiffiffiffiffiffiffiffiffiffiffiffiffi2s=pNÞ
s ’
ffiffiffiffiffiffiffiffiffi 2
pNs
r
: ð27Þ
alimitis lower than for weak selection. For example, for
Ns¼10alimit0.25. Outcrossers hardly fix fully reces-sive advantageous mutations while self-fertilizing species do, even with lowerNe(see also Charlesworth1992).
Dominance of advantageous mutations: While both the-ory and experimental data support the recessivity of del-eterious mutations over wild-type alleles, we know little about the distribution of dominance coefficients of newly arisen advantageous mutations. A review of pesticide re-sistance alleles showed that they are often dominant or codominant (Bourguetand Raymond1997) but such al-leles have been screened after selection, which is expected to skew the distribution of mutations toward dominant TABLE 3
Comparison ofvfor different levels of selfing (F) assuming a distribution of deleterious mutation effects (sandh)
Exponential distribution ofs(meanNs¼2) Skewed gamma distribution ofs(meanNs¼10)
F Constanta BS (high rec) BS (medium rec) BS (low rec) Constanta BS (high rec) BS (medium rec) BS (low rec)
0 0.427 0.427 0.427 0.427 0.665 0.665 0.665 0.665
0.2 0.427 0.429 0.439 0.449 0.664 0.665 0.667 0.669
0.5 0.426 0.437 0.474 0.504 0.664 0.667 0.675 0.682
0.7 0.426 0.451 0.527 0.578 0.664 0.670 0.687 0.698
1 0.425 0.921 0.900 0.867 0.664 0.802 0.791 0.776
ones, the so-called ‘‘Haldane’s sieve.’’ Charlesworth (1992) used data in selfers where Haldane’s sieve is strongly reduced, such that the dominance spectrum of fixed mutations is very close to the one of newly arisen mutations before selection. He found a bias toward recessive mutations but he pointed out that dominant mutations should be more common among favorable mutations than deleterious ones.
To explore the effect of the dominance spectrum of mutations, one can assume that half of the mutations are recessive and the other half are dominant. Table 4 shows the evolution of v with F for this symmetrical distribution. For constanta,vis higher in outcrossers than in selfers if selection is weak. The reverse is true under strong selection. However, quantitatively the val-ues are very similar. Empirically the limit is2Ns21
but we did not find any demonstration of this result. Under weak selection, taking the average of (22), with
h¼0 andh¼1 we get
v’11aNs; ð28Þ
which is independent ofFsoalimit¼1. Under strong selection, we can show that
alimit¼ 1 sln
11e2s
2
ð29Þ
(see appendix), which is always less than but rather close to 1. IfNeis reduced beyond the 50% threshold, we thus expect to detect a relaxed selection of advanta-geous mutations in selfers if dominance levels are dis-tributed equally. However, if advantageous mutations are mainly recessive, adaptive evolution could go faster in self-fertilizing than in outcrossing species.
Subdivided populations: Most natural populations are subdivided, and geographical structure may affect population evolution. When comparing outcrossing and self-fertilizing species, population subdivision can be crucial because selfers are usually more spatially structured than outcrossers (Hamrickand Godt1996). How does population subdivision affect the above theo-retical results? As an example, consider the case of the island model with no extinction and zygotic migration.
According to Equation 44 from Roze and Rousset (2003), theGfunction becomes
GðxÞ ¼Exp
2kNsx
2h1ð12hÞ
3ð11FÞ
212aNmðFðx2Þ1xÞ
ð11FÞð11F12aNmÞ
;
ð30Þ
where kis the number of demes and mthe migration rate. Here,Nstands for the local population size. First, it is worth noting that for complete selfing,GðxÞ ¼ekaNsx,
which is independent on mand h. In panmictic pop-ulations,G(x) depends both onmand onh. As shown by Rozeand Rousset(2003), subdivision increases the probability of fixation of recessive advantageous muta-tions but decreases it for dominant ones (the reverse is expected for deleterious mutations).
Using (30) in (12), (15) and (22) allow us to explore the effect of subdivision onf0andv. Figure 6 shows that for recessive deleterious mutations, f0 and v increase with migration rate, except under complete selfing when they are independent onmas predicted above. For ad-vantageous recessive mutations, migration reduces v. More importantly, Figure 6 shows that subdivision lessens the differences between self-fertilizing and outcrossing species. Subdivision has a strong effect in outcrossers by increasing local homozygosity, but a limited one in selfers, and even a null effect under complete selfing (see also Rozeand Rousset2003). Consequentlyalimit should be higher in subdivided populations than in single ones. As an example, we give the case of weakly advantageous mutations:
alimit ¼
314Nm
316Nm ð31Þ
(see appendix). As Nm tends toward 0, alimit tends toward 1, while it tends toward23, the single-population value, when Nm tends toward infinity. If both self-fertilizing and outcrossing species are similarly sub-divided (sameNm) it would be easier to detect relaxed selection than in single large populations (becausealimit is higher and close to 1 in the former case). If self-fertilizing species are more subdivided than outcrossing ones, intermediate results are expected (alimit taking intermediate values between the subdivided and the single-population cases). Anyway, the conclusions based on single population models appear robust.
DISCUSSION
Detecting reduced selection efficacy in selfers at the molecular level: It has been claimed that reduced Ne in selfers should leave a signature of relaxed selection against deleterious mutations at the molecular level (Charlesworthand Wright2001). This intuitive ex-pectation comes from the idea that slightly deleterious TABLE 4
vfor advantageous mutations as a function ofFand
selection strength (Ns)
F Ns¼1 Ns¼5 Ns¼10 Ns¼30
0 2.38 10.76 20.17 49.12
0.2 2.34 10.20 19.44 50.03
0.5 2.31 9.86 19.12 51.32
0.7 2.30 9.79 19.06 51.69
1 2.30 9.75 19.03 51.84
mutations, which contribute more to polymorphism and divergence than strongly deleterious ones, should be nearly codominant and weakly affected by increased homozygosity in selfers (see also Charlesworth1992). Here, we give a theoretical and quantitative basis to this hypothesis.
For realistic mutation parameters, f0 and v very slightly decrease asFincreases for constanta. Thus only lowNereduction is necessary to makef0andvincrease withF, as expected under the commonly accepted hy-pothesis. This study also shows that a stronger effect of mating system should be detectable using divergence rather than polymorphism statistics. The dominance level of deleterious mutations has a strong impact on polymo-rphism, somewhat compensating for genetic drift, but a weaker one on substitution rates, which are mainly gov-erned byNe. However, this is true at steady state. If mating systems evolve quickly and if self-fertilizing species are of recent origin (for example,A. thaliana; Charlesworth
and Vekemans2005; Bechsgaardet al.2006), differ-ences in v between selfers and outcrossers should be weak because measures of valong phylogenies corre-spond to averages over the mating system evolutionary path. Comparing f0and vto test the previous predic-tions should be done on species or groups of species for which evidence for the relative stability of mating sys-tems exists.
Both polymorphism and divergence data can be summarized by the so-called McDonald–Kreitman table (Mcdonaldand Kreitman1991) or by the neutrality index (NI) (Rand and Kann 1996). For instance, Bustamante et al. (2002) found an excess of non-synonymous polymorphism compared with divergence, which can also be summarized by a NI?1. However, assuming only deleterious mutations we expect NI closer to 1 in selfers (with lowNe) than in outcrossers (with large Ne). But it is worth noting that this pre-diction does not hold if we assume a fraction of purely neutral mutations. Using (3a) and (3b) without adap-tive mutations (ca¼0), an equivalent to the NI index is given byðcn1cdfdÞ=ðcn1cdvdÞ. As selection against del-eterious alleles increases (outcrossers with largeNe) this ratio tends toward 1 because fdandvdtend toward 0, while it is.1 with weak or moderate selection (selfers with smallNe). If selection against deleterious alleles is relaxed in selfers, we thus expect to detect higher NI in selfers than in outcrossers.
Finally, a way to disentangle the effect of reducedNe from that of increased homozygosity would be to com-pare nuclear and cytoplasmic genes. The second cate-gory is influenced only by hitchhiking and bottleneck effects affectingNe. A related result has been reported in Daphnia where average mitochondrial v is signifi-cantly higher in asexual lineages than in sexual ones (Palandand Lynch2006). However, such a signature of relaxed selection on an organelle genome due toNe reduction through a hitchhiking effect has not been reported yet in self-fertilizing species.
Adaptive evolution in selfers: The difference in substitution rates of advantageous mutations between outcrossers and selfers critically depends on the domi-nance coefficients, which are poorly known. However, as-suming that advantageous new mutations are either recessive or dominant with equal probability, no or low reduction inNeis necessary to detect a signature of re-laxed selection in selfers. Because adaptive mutations are supposed to be much less frequent than deleterious mutations, the average pattern at the gene level can be misleading. For example, the combination of strong selection against deleterious mutations with few adap-tive substitutions in outcrossing species can lead to
v-values higher than those in self-fertilizing species where selection is weak both against deleterious muta-tions and in favor of advantageous ones. Depending on
v being higher or,1, opposite conclusions could be reached.
Figure6.—f0(A) andv(B) for deleterious mutations and
vfor advantageous mutations (C) as a function of the migra-tion rate,m, under thek-island model.N¼100,k¼10,h¼0,
To test previous predictions, sites evolving under positive and purifying selection should be analyzed sep-arately. Phylogenetic methods taking account of het-erogeneous selection pressure among sites (Yanget al. 2000; Guindonet al.2004) can help partition sites into different categories. Removing sites evolving under posi-tive selection can reinforce the detection of relaxed se-lection against deleterious mutations in selfers. On the contrary, to test whether adaptive evolution is more or less frequent in selfers than in outcrossers, only sites detected as evolving under positive selection should be used. However, because such sites are supposed to be rare, specific genes like resistance genes should be used.
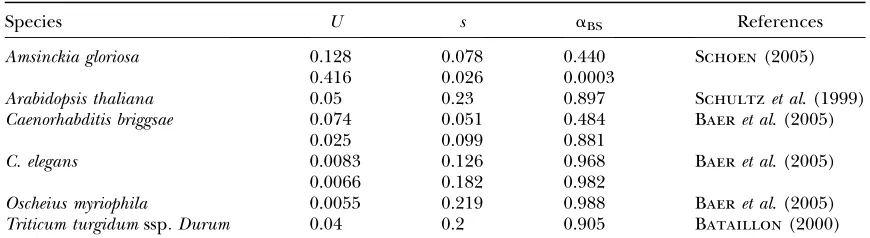
How small is a in natural populations? The main results of this study critically depend ona-values. It is difficult to predict these values from biological data, as already mentioned. Under the BS hypothesis, however, predictions can be made provided genomic deleterious mutation parameters are known. Assuming complete selfing (17) becomes
aBS¼eðð1=2sdÞÞ11=ðR12hdsdÞÞU ’eðU=2sdÞ
forR?2sd?2hdsd: ð32Þ
Using data available in self-fertilizing species,aBSspans between 0.48 and 0.98 but most values are close to one (Table 5). At least in those species, BS seems not suffi-cient to cause a strong decrease inNe. However, strong reductions in Ne have been documented in the self-fertilizing nematodesCaenorhabditis elegansandC. briggsae, suggesting recurrent bottlenecks and/or frequent selec-tive sweeps (Grausteinet al.2002). Irrespective of the underlying causes, a gross estimation of a can be inferred throughpscomparison between self-fertilizing and outcrossing related species,
ˆ
a¼ kpsðselferÞ
psðoutcrosserÞ ð33Þ
withk¼2 for nuclear genes,k¼1 for cytoplasmic genes in hermaphrodite species, and k ¼ 1
2 for cytoplasmic
genes in gonochoric species. Applying (33) to Graustein
et al.(2002) data gives a-values between 0.04 and 0.28 for nuclear genes and0.4 for the mitochondrial gene
they used. On the contrary, inA. thaliana,ais close to or even.1 (Wrightet al.2003). This could explain why no effect of selfing was detected on theDn/Dsratio in this species (Wrightet al.2002).
Evolutionary rate and long-term evolution in selfers:
On short timescales, selfers can efficiently purge strongly deleterious mutations causing inbreeding depression (Ohta and Cockerham 1974; Lande and Schemske 1985), preventing reverse transition to allogamy (Lande and Schemske1985). On longer timescales, reduction inNemay increase drift load and preclude adaptation, suggesting that self-fertilization could be an evolution-ary dead end (Takebayashiand Morrell2001). The results presented here confirm that reduction inNein natural populations of self-fertilizing species should be large enough to allow higher rates of fixation of weakly deleterious mutations than in outcrossing species, even for fully recessive mutations. Phylogenetic analyses offer tools to quantify drift load in self-fertilizing species and investigate further the evolutionary dead-end hypothe-sis. However, the claim of reduced adaptation in selfers is less clear from a theoretical point of view and crucially depends on dominance levels of new advantageous mu-tations. A few adaptive events can prevent an extinction vortex (Whitlock2000) and could help maintain self-ing lineages over a long timescale as observed in the Medicago genus (Benaet al.1998).
I thank Nicolas Galtier and two anonymous reviewers for their comments and suggestions to improve the manuscript. This is pub-lication ISEM 2007-103 of the Institut des Sciences de l’Evolution de Montpellier.
LITERATURE CITED
Abramowitz, M., and I. A. Stegun, 1970 Handbook of Mathematical Functions.Dover, New York.
Baer, C. F., F. Shaw, C. Steding, M. Baumgartner, A. Hawkins et al., 2005 Comparative evolutionary genetics of spontaneous mutations affecting fitness in rhabditid nematodes. Proc. Natl. Acad. Sci. USA102:5785–5790.
Baker, H. G., 1955 Self-compatibility and establishment after ‘‘long-distance’’ dispersal. Evolution9:347–348.
Bataillon, T., 2000 Estimation of spontaneous genome-wide muta-tion rate parameters: Wither beneficial mutamuta-tions? Heredity84:
497–501.
TABLE 5
Estimation ofain self-fertilizing species under the background selection model using Equation 32
Species U s aBS References
Amsinckia gloriosa 0.128 0.078 0.440 Schoen(2005)
0.416 0.026 0.0003
Arabidopsis thaliana 0.05 0.23 0.897 Schultzet al. (1999)
Caenorhabditis briggsae 0.074 0.051 0.484 Baeret al. (2005)
0.025 0.099 0.881
C. elegans 0.0083 0.126 0.968 Baeret al. (2005)
0.0066 0.182 0.982
Oscheius myriophila 0.0055 0.219 0.988 Baeret al. (2005)
Bataillon, T., and M. Kirkpatrick, 2000 Inbreeding depression due to mildly deleterious mutations in finite populations: size does matter. Genet. Res.75:75–81.
Bechsgaard, J. S., V. Castric, D. Charlesworth, X. Vekemansand M. H. Schierup, 2006 The transition to self-compatibility in Arabidopsis thalianaand evolution within S-haplotypes over 10 Myr. Mol. Biol. Evol.23:1741–1750.
Bena, G., B. Lejeune, J. M. Prosperiand I. Olivieri, 1998 Mo-lecular phylogenetic approach for studying life-history evolution: the ambiguous example of the genus Medicago L. Proc. Biol. Sci.
265:1141–1151.
Bourguet, D., 1999 The evolution of dominance. Heredity83(1): 1–4.
Bourguet, D., and M. Raymond, 1997 The molecular basis of dom-inance relationships: the case of some recent adaptive genes. J. Evol. Biol.11:103–122.
Bulmer, M., 1991 The selection-mutation-drift theory of synony-mous codon usage. Genetics129:897–907.
Bustamante, C. D., R. Nielsen, S. A. Sawyer, K. M. Olsen, M. D. Puruggananet al., 2002 The cost of inbreeding inArabidopsis. Nature416:531–534.
Caballero, A., and W. G. Hill, 1992 Effects of partial inbreeding on fixation rates and variation of mutant genes. Genetics131:
493–507.
Charlesworth, B., 1992 Evolutionary rates in partially self-fertiliz-ing species. Am. Nat.140:126–148.
Charlesworth, B., M. T. Morgan and D. Charlesworth, 1993 The effect of deleterious mutations on neutral molecular variation. Genetics134:1289–1303.
Charlesworth, D., and X. Vekemans, 2005 How and when did Arabidopsis thalianabecome highly self-fertilizing? BioEssays27:
472–476.
Charlesworth, D., and S. I. Wright, 2001 Breeding systems and genome evolution. Curr. Opin. Genet. Dev.11:685–690. Gle´ min, S., 2003 How are deleterious mutations purged? Drift
ver-sus nonrandom mating. Evolution57:2678–2687.
Gle´ min, S., E. Bazinand D. Charlesworth, 2006 Impact of mat-ing systems on patterns of sequence polymorphism in flowermat-ing plants. Proc. Biol. Sci.273:3011–3019.
Graustein, A., J. M. Gaspar, J. M. Waltersand M. F. Palopoli, 2002 Levels of DNA polymorphism vary with mating system in the nematode genusCaenorhabditis.Genetics161:99–107. Guindon, S., A. G. Rodrigo, K. A. Dyerand J. P. Huelsenbeck,
2004 Modeling the site-specific variation of selection patterns along lineages. Proc. Natl. Acad. Sci. USA101:12957–12962. Hamrick, J. L., and M. J. W. Godt, 1996 Effects of life history traits
on genetic diversity in plants species. Philos. Trans. R. Soc. Lond. B351:1291–1298.
Higgins, K., and M. Lynch, 2001 Metapopulation extinction caused by mutation accumulation. Proc. Natl. Acad. Sci. USA
98:2928–2933.
Keightley, P. D., 1994 The distribution of mutation effects on via-bility inDrosophila melanogaster.Genetics138:1315–1322. Kimura, M., 1962 On the probability of fixation of mutant genes in
a population. Genetics47:713–719.
Lande, R., and D. W. Schemske, 1985 The evolution of self-fertilization and inbreeding depression in plants. I. Genetic models. Evolution
39:24–40.
Loewe, L., B. Charlesworth, C. Bartolomeand V. Noel, 2006 Es-timating selection on nonsynonymous mutations. Genetics172:
1079–1092.
Maynard-Smith, J., and D. Haig, 1974 The hitch-hiking effect of a favourable gene. Genet. Res.23:22–35.
McDonald, J. H., and M. Kreitman, 1991 Adaptative protein evo-lution at the ADH locus in Drosophila. Nature351:652–654. McVean, G. A., and B. Charlesworth, 1999 A population genetic
model for the evolution of synonymous codon usage: patterns and predictions. Genet. Res.74:145–158.
Mukai, T., S. I. Chigusa, L. E. Mettler and J. F. Crow, 1972 Mutation rate and dominance of genes affecting viability inDrosophila melanogaster.Genetics72:335–355.
Nei, M., 1968 The frequency distribution of lethal chromosomes in finite populations. Proc. Natl. Acad. Sci. USA60:517–524. Nybom, H., 2004 Comparison of different nuclear DNA markers for
estimating intraspecific genetic diversity in plants. Mol. Ecol.13:
1143–1155.
Ohta, T., and C. C. Cockerham, 1974 Detrimental genes with partial selfing and effects on a neutral locus. Genet. Res.23:191–200. Paland, S., and M. Lynch, 2006 Transitions to asexuality result in
excess amino acid substitutions. Science311:990–992. Phadnis, N., and J. D. Fry, 2005 Widespread correlations between
dominance and homozygous effects of mutations: implications for theories of dominance. Genetics171:385–392.
Piganeau, G., and A. Eyre-Walker, 2003 Estimating the distribution of fitness effects from DNA sequence data: implications for the mo-lecular clock. Proc. Natl. Acad. Sci. USA100:10335–10340. Rand, D. M., and L. M. Kann, 1996 Excess amino acid
polymor-phism in mitochondrial DNA: contrasts among genes from Dro-sophila, mice, and humans. Mol. Biol. Evol.13:735–748. Roze, D., and F. Rousset, 2003 Selection and drift in subdivided
populations: a straightforward method for deriving diffusion ap-proximations and applications involving dominance, selfing and local extinctions. Genetics165:2153–2166.
Schoen, D. J., 2005 Deleterious mutation in related species of the plant genusAmsinckiawith contrasting mating systems. Evolution
59:2370–2377.
Schoen, D. J., and A. H. D. Brown, 1991 Intraspecific variation in pop-ulation gene diversity and effective poppop-ulation size correlates with the mating system in plants. Proc. Natl. Acad. Sci USA88:4494–4497. Schultz, S. T., M. Lynchand J. H. Willis, 1999 Spontaneous
del-eterious mutation inArabidopsis thaliana.Proc. Natl. Acad. Sci. USA96:11393–11398.
Tajima, F., 1983 Evolutionary relationship of DNA sequences in finite populations. Genetics105:437–460.
Takebayashi, N., and P. L. Morrell, 2001 Is self-fertilization an evolutionary dead end? Revisiting an old hypothesis with genetic theories and a macroevolutionary approach. Am. J. Bot. 88:
1143–1150.
Whitlock, M. C., 2000 Fixation of new alleles and the extinction of small populations: drift load, beneficial alleles, and sexual selec-tion. Evolution54:1855–1861.
Wolfram, S., 1996 The Mathematica Book. Cambridge University Press, Cambridge.
Wright, S., 1937 The distribution of gene frequencies in popula-tions. Proc. Natl. Acad. Sci. USA23:307–320.
Wright, S. I., B. Laugaand D. Charlesworth, 2002 Rates and pat-terns of molecular evolution in inbred and outbredArabidopsis. Mol. Biol. Evol.19:1407–1420.
Wright, S. I., B. Laugaand D. Charlesworth, 2003 Subdivision and haplotype structure in natural populations of Arabidopsis lyrata.Mol. Ecol.12:1247–1263.
Yang, Z., R. Nielsen, N. Goldman and A. M. Pedersen, 2000 Codon-substitution models for heterogeneous selection pressure at amino acid sites. Genetics155:431–449.
Communicating editor: M. Nordborg
APPENDIX: COMPUTATION OF aLIMIT
The details of the approximation foralimitthat are not fully derived in the main text are given here.
Case i—v, strong positive selection with recessive and dominant mutations:Assume that half of the advantageous mutations are recessive and half are dominant. In fully self-fertilizing populations (F ¼1), vis independent of dominance levels. For strong selection, according to (26)
In outcrossing populations (F¼0 anda¼1), for recessive mutationsvis given by (26) (and see Kimura1962). For dominant ones, (22) becomes
v¼2N 11Erfiðð12NÞ ffiffiffiffiffiffiffiffiffiffiffi
s=2N
p
Þ
Erfiðpffiffiffiffiffiffiffiffi2NsÞ
!
; ðA2Þ
where Erfi is the imaginary error function (Abramowitzand Stegun1970). Using the approximation ErfiðxÞ ffiex2
=xpffiffiffiffipfor largexand assumingN?1, we getv’2Nð1e2sÞ. The average vover half of the mutations being dominant and the other half being recessive is thus given by
vout ¼N
ffiffiffiffiffiffiffiffi 2s pN
r
11e2s
!
’Nð1e2sÞ: ðA3Þ
Solving forvself¼voutinagives
alimit¼ 1 sln
11e2s
2
: ðA4Þ
Case ii—v, weak positive selection in subdivided populations:For new advantageous mutations,
v¼2Nuðs;hÞ ðA5Þ
with
uðs;hÞ ¼
Ð1=2N
0 GðxÞdx
Ð1 0 GðxÞdx
;
where
GðxÞ ¼Exp 2kNsx 2h1ð12hÞð11FÞ
212aNmðFðx2Þ1xÞ ð11FÞð11F12aNmÞ
in thek-island model (Rozeand Rousset2003). Fora¼1 andF¼0,
vout¼2Nk
Erf
ffiffiffiffiffiffiffiffiffiffiffiffiffiffiffiffiffiffiffiffiffiffiffiffiffiffiffiffiffi
ks
4mð112NmÞ
s !
Erf ðk12mÞ
ffiffiffiffiffiffiffiffiffiffiffiffiffiffiffiffiffiffiffiffiffiffiffiffiffiffiffiffiffiffis
4kmð112NmÞ
r
Erf
ffiffiffiffiffiffiffiffiffiffiffiffiffiffiffiffiffiffiffiffiffiffiffiffiffiffiffiffi
ks
4mð112NmÞ
s !
Erf ð114NmÞ
ffiffiffiffiffiffiffiffiffiffiffiffiffiffiffiffiffiffiffiffiffiffiffiffiffiffiffiffiffiffi
ks
4kmð112NmÞ
s !; ðA6Þ
where Erf is the error function (Abramowitzand Stegun1970). For anyaandF¼1,
vself ¼2kNe
asðeas1Þ
1e2kNas : ðA7Þ
Assuming weak selectionNs,1, Taylor expansions of (A6) and (A7) inNs0, and further simplification assuming
N?1 give
vout ’11kNs
314Nm
316Nm ðA8Þ
vself ’11kNas; ðA9Þ
which leads to
alimit ¼
314Nm