On Establishing a Benchmark for Evaluating Static
Analysis Alert Prioritization and Classification Techniques
Sarah Heckman
North Carolina State University890 Oval Drive Raleigh, NC 27695-8206
+1 919 513-5082
[email protected]
Laurie Williams
North Carolina State University890 Oval Drive Raleigh, NC 27695-8206
+1 919 513-4151
[email protected]
ABSTRACT
Benchmarks provide an experimental basis for evaluating software engineering processes or techniques in an objective and repeatable manner. We present the FAULTBENCH benchmark, as a
contribution to current benchmark materials, for evaluation and comparison of techniques that prioritize and classify alerts generated by static analysis tools. Alert prioritization and classification addresses the problem in many static analysis tools of numerous alerts that are not an indication of a fault or unimportant to the developer. We utilized FAULTBENCH to evaluate three versions of the AWARE adaptive ranking model to prioritize and classify static analysis alerts. Individual
FAULTBENCH subjects have different best prioritization and classification techniques. Using a single subject to evaluate a prioritization and classification technique could provide incorrect results. Together, FAULTBENCH subjects provide a precise and general evaluation of alert prioritization and classification techniques.
Categories and Subject Descriptors
D.2.4 [Software Engineering]: Software/Program Verification –
Reliability, D.2.5 [Software Engineering]: Testing and
Debugging – Testing tools
General Terms
Measurement, Reliability, Experimentation, Verification.
Keywords
Automated static analysis, alert ranking, benchmark creation
1.
INTRODUCTION
Several open questions in software engineering involve evaluating processes and techniques to improve aspects of the software development lifecycle. Empirical analysis of research theories are a component for acceptance of the theory within a research community [18]. Benchmarks provide an experimental basis for evaluating software engineering theories, represented by software engineering techniques, in an objective and repeatable manner [18]. A benchmark is defined as “a procedure, problem, or test that can be used to compare systems or components to each other
or to a standard” [8]. Benchmarks represent the research problems of interest and solutions of importance in a research area through definition of the motivating comparison, task sample, and evaluation measures [17]. The task sample can contain programs, tests, and other artifacts dependent on the benchmark’s motivating comparison. A benchmark controls the task sample reducing result variability, increasing repeatability, and providing a basis for comparison between techniques [17]. Additionally, successful benchmarks promote collaboration within a research community [17].
Several benchmarks in the realm of software fault detection have emerged in recent years [14-16] containing subject programs of various sizes, in multiple languages, and with real or seeded faults. Current benchmarks provide meaningful points of comparison; however, they lack a detailed, repeatable process. Our goal is to supplement prior benchmarks by gathering a set of small, real, and faulty Java programs from a variety of domains and providing a process for evaluation of the following software fault detection problem: how to identify which anomalies generated by static analysis tools are program faults.
Static analysis tools can identify anomalies in source code early in the development process [8]. These tools produce reports listing possible program faults, which we call alerts. Inspection of each alert by a developer is required to determine if the alert is an indication of a fault. When an alert is not an indication of a fault or is deemed unimportant to the developer (e.g. the alert indicates a programmer mistake inconsequential to program functionality), we call the alert a false positive [1]. Static analysis tools may generate an overwhelming number of alerts [10], the majority of which are likely to be false positives [6]. Alert prioritization techniques can increase the usability of static analysis tools by presenting developers with alerts likely to indicate important faults first. Additionally, alerts classification techniques can divide static analysis alerts into two groups: alerts likely to indicate important faults and alerts likely to be false positives.
The goal of our research is to propose the FAULTBENCH benchmark to the software fault detection community for comparison and evaluation of static analysis alert prioritization and classification techniques. The literature in the realm of static analysis alert
prioritization and classification is moving towards a definition for conducting and evaluating research [9, 10, 12, 14, 20, 22].
FAULTBENCH provides a basis for comparison of static analysis alert prioritization and classification techniques and contributes
subject programs; an analysis procedure; and evaluation metrics.
The current version of FAULTBENCH contains six, open-source, subject programs written in Java. We validate the selection of
FAULTBENCH subject programsby comparing three versions of the
Permission to make digital or hard copies of all or part of this work for personal or classroom use is granted without fee provided that copies are not made or distributed for profit or commercial advantage and that copies bear this notice and the full citation on the first page. To copy otherwise, or republish, to post on servers or to redistribute to lists, requires prior specific permission and/or a fee.
ESEM ‘08, October 9-10, 2008, Kaiserslautern, Germany
AWARE [5]adaptive ranking model (ARM)alert prioritization and classification technique on static analysis alerts generated by the
FINDBUGS [6] static analysis tool. FINDBUGS is a popular open source static analysis tool. We describe how we created
FAULTBENCH, and present the process of evaluating and comparing alert prioritization and classification techniques. We invite researchers in the static analysis community to critique and improve the current benchmark.
The rest of the paper is structured as follows: Section 2 presents related work, Section 3 describes the FAULTBENCH creation and analysis procedure, Section 4 describes the FAULTBENCH case study, Section 5 presents the case study results, and Section 6 concludes and presents future work.
2.
RELATED WORK
This section describes the related work in the areas of benchmark creation and the ranking of static analysis alerts.
2.1
Current Fault Detection Benchmarks
There are several benchmarks in the realm of software fault detection. The SIEMENS [7] benchmark was created by researchers at Siemens Corporate Research and contains multiple versions of small programs each containing a single fault and a suite of test cases. The benchmarks were created to evaluate control- and data-flow test adequacy criteria and were later used by Rothermel et al. [16] to evaluate regression test case prioritization. The
SIEMENS benchmark has small, C programs with seeded faults.
BUGBENCH[14] is a benchmark containing seventeen buggy, open source, C/C++ applications ranging from seven thousand lines of code (KLOC) to 1028 KLOC in various domains. A Java benchmark was created to evaluate the CHORD race condition detection static analysis tool [15] and contains twelve concurrent programs ranging from 2.5 KLOC to 650 KLOC. PROMISE [3]is a repository for data sets and tools from empirical research in predictive modeling, and half of the 60 data sets are in the area of fault prediction. However, most of the data sets provide metrics about projects without the project source. Some data sets refer to large, open source projects and the remainders refer to commercial products. Other static analysis researchers [9, 10, 12, 20] have used large open source projects (e.g. Apache’s httpd1, Wine2, Sun’s JDK 1.6.03, Columba4) or commercial programs to evaluate alert ranking and classification techniques. While large open-source programs provide confidence and scale in the techniques they evaluate, the size of the sample evaluated (one to three programs) is a threat to external validity (e.g. the generalization of the results). Additional studies and subjects address the threats to external validity, and increase the generalization of experimental results [16]. Commercial examples show scalability of the technique in an industrial setting at the cost of repeatability and comparison.
These current benchmarks are insufficient for our needs for several reasons. First, current benchmarks are lacking a detailed, repeatable process for use and evaluation of static analysis alert prioritization and classification techniques. Additionally, the current benchmarks are mostly for the C and C++ programming
1
http://httpd.apache.org/ 2 http://www.winehq.org/ 3
http://java.sun.com/javase/ 4
http://columba.sourceforge.net/
languages. Finally, alert prioritization research, especially when adaptive ranking is used, requires the removal of faults by a researcher unfamiliar with the program, which is difficult to do with large projects and a high quantity of alerts. Therefore, we want to create a benchmark of relatively small, real, and faulty Java programs from a variety of domains.
2.2
Static Analysis Alert Prioritization
Kim and Ernst [9, 10] describe two static analysis alert prioritization techniques where the lifetime of a static analysis alert is measured from data mined from source code repositories. The lifetime of an alert is the time between alert creation and alert closure. One technique prioritizes static analysis alert types by the average lifetime of alerts sharing the same type in the repository [9]. Alert types with shorter lifetimes have a higher ranking (e.g. alerts fixed quickly are likely important) than alert types with longer lifetimes. The second technique weights alerts types by the number of alerts closed by fault- and non-fault-fixes, where a fault-fix is a source code change where the developer fixes a fault or problem and a non-fault-fix is a change where a fault or problem is not fixed like a feature addition [10]. The history based warning prioritization presented by Kim and Ernst [10] improves the alert precision by over 100% when compared to the alert precision of alerts prioritized by tool severity. However, the precision ranged from 17%-67%, which might be due to alert closures not having a causal relationship with the root cause of a fault-fix. Additionally, both prioritization techniques work best for fine-grained (e.g. many distinct alert types), homogeneous alert types. A homogeneous alert type means that all alerts sharing that type are all either true or false positives. We utilize the idea of alert type homogeneity in our ranking.
Williams and Hollingsworth [20] created a static analysis tool which evaluates how often the return values of method calls are checked in source code. A method is flagged with an alert when the return value for the method is inconsistently checked in calling methods. Williams and Hollingsworth use the HISTORYAWARE
prioritization technique to prioritize methods by the percentage of time the return values of the methods are checked in the software repository and the current version of the code. The results show a statistically significant reduction of the false positive rate when using the HISTORYAWARE prioritization technique on two case studies involving httpd and Wine applications.
Kremenek et al. [12] show that static analysis alerts in a similar alert locations tend to be homogeneous. On average, 88% of methods, 52% of files, and 13% of the directories with two or more alerts contained homogeneous alert populations. Kremenek et al. created a FEEDBACK-RANK algorithm whereby the developer’s feedback is used to prioritize the remaining alerts. The static analysis tools used by Kremenek et al. take advantage of understanding where a static analysis tool checked for an alert, but did not find a potential fault [13]. We also use the developer’s feedback to drive the adaptive ranking of un-inspected static analysis alerts, and our version of the code locality ranking factor was inspired by Kremenek et al.
execution likelihood, the analysis did not investigate if the prioritization identified more alerts of interest to the developer.
3.
BENCHMARK CREATION
The goal of contributing the FAULTBENCH benchmark is to create a (1) suite of subject programs and alert oracles; and (2) repeatable
procedures for evaluating static analysis alert prioritization and
classification techniques. We have created a benchmark of Java programs from various domains, ranging from 1,276 – 14,120 lines of code (LOC) and static analysis alert oracles from alerts generated by FINDBUGS. FINDBUGS uses code scans, control-flow, and data-flow analysis to detect common bug patterns in the source code that are possible faults [6]. FINDBUGS detects 331 distinct alerts at three priority levels. We used the FINDBUGS
Eclipse5 plug-in to generate static analysis alerts on the subject programs with-in the Eclipse workbench. We configured
FINDBUGS to report alerts at all priority and detector effort levels, which maximizes the number of alert detectors used by FINDBUGS.
Below, we define the FAULTBENCH purpose and describe how
FAULTBENCH fulfills properties for successful benchmarks. In addition, we provide the steps for choosing subject programs and for the process of evaluating alert prioritization and classification techniques with FAULTBENCH.
3.1
Definition of
FAULTBENCHfor Prioritizing
and Classifying Static Analysis Alerts
We define FAULTBENCH in terms of the three components presented by Sim et al. [17]: motivating comparison, task sample, and performance measures.
3.1.1
Motivating Comparison
The motivating comparison advocated by Sim et al. [17] describes why the results of comparing two tools or techniques are important for furthering the research surrounding the comparison. The motivating comparison of FAULTBENCH is to find the static analysis alert prioritization or classification technique with the best rate of static analysis fault detection. Static analysis is an effective means of fault removal [21] and is cost effective with the detection of three to four potential field failures [19]. However, a large number of static analysis alerts, especially false positive alerts, leads to rejection of the tool [4]. Specifically, we can use
FAULTBENCH to answer the following research questions:
• [Q1]: Can alert prioritization improve the rate of fault detection when compared to the tool’s output?
• [Q2]: How does the rate of fault detection compare between alert ranking techniques?
• [Q3]: Can alert categorization correctly predict true positive (TP) and false positive (FP) alerts?
3.1.2
Task Sample
The task sample consists of (1) six real Java subject programs ranging from 1,276 – 14,120 lines of code (LOC); (2) the set of
FINDBUGS [6] alerts identified as TP or FP in the context of the
subject programs (alert oracle); (3) a set of source code changes to fix each TP alert; and (4) the experimental control alert prioritizations: OPTIMAL, TOOL, and RANDOM. Section 3.3 describes the subject program selection process for FAULTBENCH.
5
Eclipse is an open source integrated development environment. Eclipse may be found at: http://eclipse.org
The descriptions for creating the remaining task sample data are described in Section 3.4, FAULTBENCH Initialization.
3.1.3
Performance Measures
FAULTBENCH evaluates techniques that predict which alerts generated by static analysis tools are program faults. Alert
prioritization techniques order alerts such that alerts likely to be
indications of important faults are at the top of an alert list. Alert
classification techniques divide static analysis alerts into two
groups: alerts likely to indicate important faults and alerts likely to be false positives. Alert prioritization can classify alerts when a prioritization technique ranks alerts on a divisible numerical scale.
Alert prioritization evaluation uses the Spearman rank
correlation, which evaluates alert orderings by measuring the
distance between the rank of alerts in two orderings. Users of the benchmark compare alert rankings generated by a prioritization technique with an OPTIMAL ordering of alerts. An alert ranking highly correlated with OPTIMAL at a statistically significant level suggests that the prioritization technique correctly ranks alerts such that alerts likely to indicate faults are higher in an alert list.
Alert classification techniques predict if alerts are true or false positives. If we classify an alert as a true positive when the alert is a true positive, then we have correctly classified the alert and we call that classification a true positive classification (TPC).
Additionally, if we classify an alert as a false positive when the alert is not an indication of a fault we have correctly classified a negative prediction, which we call a true negative classification
(TNC). A false positive classification (FPC) is when the
prioritization model predicts that an alert is a true positive (a positive classification) when the alert is actually not an indication of a fault. A false negative classification (FNC) is when the
prioritization model predicts that an alert is a false positive (a negative classification) when the alert is actually a fault. We are focusing on the classification of alerts identified by the static analysis tool; therefore, we are not considering software faults not found by static analysis tools. Figure 1 is a classification table.
The following metrics [10, 20, 22] are used to evaluate the classification and prioritization of static analysis alerts:
• Precision: the percentage of TPC that are actually faults. The precision calculation is presented in Equation 1.
C C
C
FP TP
TP precision
+
= (1)
Figure 1: Classification Table (adapted from [22] Zimmermann et al. used the term defect where we use the
term fault)
Faults are observed. True False
Positive
True Positive
(TP-C)
False Positive
(FP-C)
Precision
M
o
d
el
p
re
d
ic
ts
a
le
rt
s
Negative
False Negative
(FN-C)
True Negative
(TN-C)
• Recall: the percentage of TPC out of all possible faults. The recall calculation is presented in Equation 2.
• Accuracy: the percentage of correct classifications. The
accuracy calculation is presented in Equation 3
C C C C
C C
FN FP TN TP
TN TP accuracy
+ + +
+
= (3)
• Area under the curve: the area under the curve of the
cumulative percentage of true positive alerts detected after each inspection. An example is in Figure 5.
3.2
Desiderata for Benchmarks
Sim et al. [17] describe seven properties of successful benchmarks: accessibility, affordability, clarity, relevance, solvability, portability, and scalability. Lu et al. [14] also provide five benchmark selection criteria: representative, diverse, portability, accessibility, and fairness. The following subsections describe how FAULTBENCH meets these desiderata.
• Accessibility: A benchmark should be easy to obtain and use.
Each of the FAULTBENCH subjects is available online through various open source licenses. The subject programs, generated alerts, fault fixes, and evaluation materials related to
FAULTBENCH are publicly available at http://agile.csc.ncsu.edu/faultbench.
• Affordability: A benchmark’s cost (e.g. human, software, and
hardware resources) should be comparable to the value of the results. To complete the benchmark for a single ranking technique takes 8-10 hours on a single computer. Additional time is required for evaluating further techniques.
• Clarity: A benchmark’s documentation should be clear and
concise. The FAULTBENCH documentation is provided at http://agile.csc.ncsu.edu/faultbench for evaluation and comparison of other alert prioritization and classification techniques to ensure repeatability and disclosure.
• Relevance/Representative: A benchmark must contain
representative subjects and performance measures related to the motivating comparison. FAULTBENCH contains Java programs from various domains created by developers of varying levels of experience. The performance measures are standard in the area of software fault detection and static analysis alert prioritization [20, 22].
• Solvability: Completing the task sample and obtaining correct
metrics is not difficult. The task samples vary in size and number of FINDBUGS static analysis alerts. FINDBUGS identified 55 alert types in the task sample from the 331 possible alert types. Additionally, an analysis program is provided as part of the benchmark materials
• Portability: A benchmark should be useable by different alert
prioritization and classification techniques without bias. Each task sample is a stand alone Java project containing required libraries. Because all of the programs are written in Java, platform portability is assumed.
• Scalability/Fairness: A benchmark should be scalable to
varying alert prioritization and classification techniques and not have bias towards a specific technique. Currently,
FAULTBENCH is contains Java subject programs and can only
evaluate prioritization and classification of alerts generated by Java static analysis tools. FAULTBENCH supplements other
benchmarks in C and C++ and the authors encourage expansion to the benchmark as demonstrated in Section 3.3.
3.3
FAULTBENCHSubject Selection
The goal of FAULTBENCH is to provide a benchmark to the software fault detection community for comparison and evaluation of static analysis alert prioritization and classification techniques. Therefore, the subject programs in the benchmark must meet the following criteria: open source; small (less than 15 KLOC), of various domains, written in Java; and compliable with Java 1.4.2 or Java 1.5. To find possible subject programs, we investigated the benchmarks presented in the related work section. None of the subjects in those benchmarks met our criteria for selection. Next, we investigated programs analyzed by the static analysis, style checker tool PMD6. The PMD website maintains a page reporting results from running PMD on SourceForge7 projects. We investigated the 15 smallest programs (based on the number of analyzed non-commented source LOC) for inclusion into our benchmark and selected 11 as possible subjects. The un-chosen projects did not contain source releases or no longer existed as projects. Then, we searched for small components of commonly-used libraries and applications, like Apache and Eclipse. One subject was identified when satisfying the library requirements of an earlier subject. The final potential subject comes from a student project associated with the authors’ research group. Table 1 presents the set of possible subject programs.
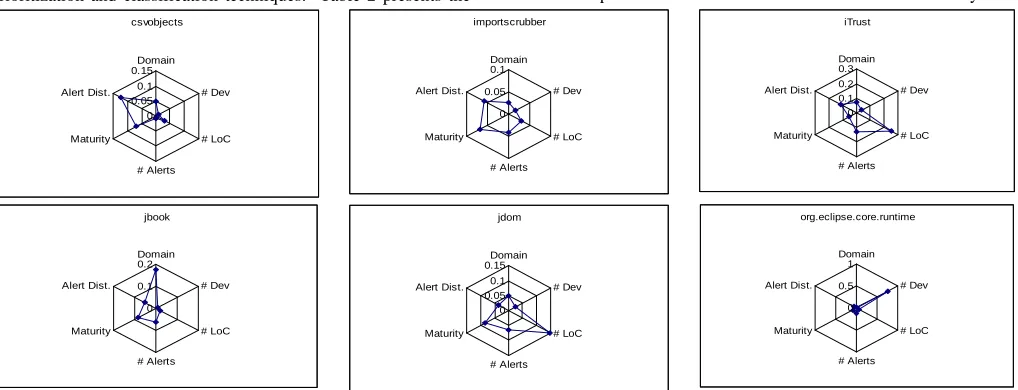
The set of subjects were further refined through an analysis of six characteristics: domain; number of developers; LOC; number of
FINDBUGS alerts; maturity; and alert distribution. First, we quantified each of the characteristics. For the categorical characteristics (e.g. domain and maturity), we assigned a numerical value to each category. The alert distribution is a value describing how many unique alert types FINDBUGS identified in a subject program. The alert distribution is the sum of the number of alerts of the same type in a subject divided by the number of subjects that contain at least one alert of the that type which is then divided by the number of alerts the subject contains. The calculation for alert distribution is presented in Equation 4.
Boehm and Turner [2] use polar charts (also called radar charts) to provide a visualization of agile and plan-driven risks in a software development project. Similarly, we can visualize the characteristics of our possible benchmark subjects’ polar charts. Each of the characteristics becomes an axis on the polar chart. Figure 2 presents the polar charts for the six selected FAULTBENCH
subjects. In Figure 2, the scale of each axis is normalized. The subjects in FAULTBENCH should have different shapes, which are representative of a variety of subject characteristics. Benchmark selection is quantifiable by taking the area of the polar charts. However, when taking the area of polar charts, the order of the six axes matter, starting clockwise from the top as shown in Figure 2.
6 http://pmd.sourceforge.net/
7 SourceForge is a repository for open source projects:
http://sourceforge.net
C C
C
FN TP
TP recall
+
= (2)
subject type
type subject
s
alerts subjects alerts
AD
∑
=
,
We reduced the number of subjects to use in the evaluation of the ARM to six by taking the areas of the polar charts, ordering the subjects by area, and taking every other subject starting with the subject having the largest area. Initially, there were seven subjects, but mflow had complicated alert open and closure patterns due to interrelated alert types requiring removal from the current version of FAULTBENCH. Table 1 contains the areas of the polar charts for the potential benchmark subjects. Additionally, the six subjects chosen for the benchmark are shaded in grey.
3.4
FAULTBENCHSubject Initialization
After FAULTBENCH subject selection, the remaining task sample data (alert oracle, source code changes, and experimental control prioritizations) are defined.
3.4.1
Alert Oracle
The first author inspected the source code associated with each static analysis alert and determined if the alerts generated by
FINDBUGS were indications of faults in the subject programs. The
evaluated alerts provide an oracle for comparing alert prioritization and classification techniques. Table 2 presents the
number of TP and FP alerts for each of the benchmark subjects.
3.4.2
Source Code Changes
Adaptive prioritization and classification techniques modify the ranking of uninspected alerts from developer feedback about an alert being an indication of an important fault or a false positive. Modification of an alert’s ranking occurs after each inspection or a set of inspections. An alert closure occurs when static analysis
Table 1: Potential FAULTBENCH benchmark subjects
Subject Version License Domain # Dev #
LoC #
Alerts Maturity
Alert
Dist. Area
commons 2005.05.30 GNU LGPL 1 - software dev 2 5560 70 5 - Production 0.38 173,497.0
commons-logging
1.1.1 Apache 2.0 1 - software dev 12 5426 126 5 - Production 0.34 324,513.6 csvobjects 0.5beta GNU GPL 2 - data format 1 1577 7 5 - Production 0.64 5,477.5 importscrubber 1.4.3 Apache Software
License
1 - software dev 2 1653 35 4 - Beta 0.31 26,545.7 itrust Fall 2007 Educational 3 - web 5 14120 110 3 - Alpha 0.61 703,277.0 javaserver 5.1 Artistic 6 -communication 1 1752 31 5 - Production 0.39 24,348.0 jbook 1.4 GNU GPL 7 - educational 1 1276 52 5 - Production 0.28 29,400.9 jdom 1.1 Apache-style 2 - data format 3 8422 55 5 - Production 0.19 211,638.6 junit-addons 1.4 Apache Software
License
1 - software dev 1 4856 109 4 - Beta 0.45 231,488.3 kaprekar 3.0 GNU GPL, MPL 1.1 5 - math 1 1869 33 4 - Beta 0.21 27,576.4 mflow 0.1 GNU GPL 6 - communication 1 4172 86 3 - Alpha 0.33 157,283.6 org.eclipse.
core.runtime
3.3.1.1 Eclipse Public License 1 - software dev 100 2791 98 5 - Production 0.30 239,546.9 schemalizer 0.16 GNU LGPL 2 - data format 1 2524 29 3 - Alpha 0.17 32,826.6 xmlwriter 2.2.2 BSD License 2 - data format 2 953 6 5 - Production 0.70 3,318.1
csvobjects
0 0.05 0.1 0.15
Domain
# Dev
# LoC
# Alerts Maturity Alert Dist.
importscrubber
0 0.05 0.1 Domain
# Dev
# LoC
# Alerts Maturity Alert Dist.
iTrust
0 0.1 0.2 0.3 Domain
# Dev
# LoC
# Alerts Maturity Alert Dist.
jbook
0 0.1 0.2 Domain
# Dev
# LoC
# Alerts Maturity Alert Dist.
jdom
0 0.05 0.1 0.15
Domain
# Dev
# LoC
# Alerts Maturity Alert Dist.
org.eclipse.core.runtime
0 0.5 1 Domain
# Dev
# LoC
# Alerts Maturity Alert Dist.
Figure 2: Polar Charts for Potential Benchmark Subjects
Table 2: Benchmark subjects with alert counts Subject TP
Alerts
FP Alerts
% TP Alerts
csvobjects 3 4 42.9%
importscrubber 11 24 31.4%
iTrust 10 100 9.1%
jbook 26 26 50.0%
jdom 9 46 16.4%
mflow 13 73 15.1%
org.eclipse.core.runtime 8 90 8.2%
tools no longer identify the alert in the source code, usually due to a fault fix directly or indirectly associated with the alert description. Alert closures also occur due to configuration changes and file deletions. Alert suppression is an explicit action taken by the developer to indicate that an alert is a false positive.
The evaluation of adaptive prioritization and classification techniques requires fixing true positive alerts. However, static analysis alerts are not orthogonal; several alert types are interrelated and a change to one may open or close another of a complementary type, which may affect prioritization and classification techniques. An alert fix should minimize the number of alert opens and closures when fixing an alert. For example, suppose a method opens and closes a file stream within a try block with an empty catch block, as shown in Figure 3.
FINDBUGS would report two alerts: 1)
OS_OPEN_STREAM_EXCEPTION_PATH at line 3 reporting that the file stream is not closed when there is an exception and 2)
DE_MIGHT_IGNORE at line 8 reporting that the exception is ignored. Fixing the alert at line 3, by closing the stream in the exception block, will also close the alert at line 8. When evaluating the ranking, we only care about closed alerts identified as TP in the baseline. If an alert identified as FP was closed as part of an alert fix, we do not count the alert in our metrics.
Additionally, new alerts may be opened when fixing TP alerts, as shown in the example code in Figure 4. FINDBUGS reports an
ES_COMPARING_PARAMETER_STRING_WITH_EQ at line 2, meaning that checking the equality of a and a constant string does not use the .equals() method. If the alert at line 2 is fixed, a new alert of the same type is opened at line 5 for a similar problem. When inspecting alerts, we ignored alerts opened as part of another fix. Only alerts present in the baseline were inspected and evaluated.
3.4.3
Experimental Controls
The OPTIMAL ordering of static analysis alerts has all TP alerts at the top of the alert list. The OPTIMAL ordering is generated by a greedy analysis of the TP alerts. Alerts are initially sorted hierarchically in the context of the subject program (e.g. by project, source folder, class, method, line number, alert type, and description), which provides a repeatable ordering for alerts. To
reduce potential bias, prioritization techniques should use the same hierarchical alert ordering to break ties when alerts share the same rank. Alerts are added to the OPTIMAL ordering by the number of TP alerts that are closed when making an alert change. When two alerts close the same number of TP alerts, first the number of FP alerts closed is a tiebreaker, followed by the hierarchical ordering of alerts. At a minimum, the optimal curve will fix one TP alert at each inspection until all TP alerts are fixed.
The TOOL ordering of alerts is created from the tool’s alert log information. The RANDOM ordering of alerts is generated via a random number generator8. Cases where more than one alert is closed must be considered when creating the OPTIMAL, RANDOM, and TOOL rankings. The ranking of an uninspected closed alert is a fraction of the number of alerts closed during an inspection. If there were three alerts (a, b, and c) closed at inspection 3, then the inspected alert (a) would have a ranking of 3, the uninspected alert first in the ordered listing (b) would have a ranking of 3.33 and other uninspected alert (c) would have a ranking of 3.66. For an alert inspected prior to a closure via a tangential change (suppose alert b was inspected at inspection 2), the original inspection (2) is maintained as the rank for that alert (b).
3.5
FAULTBENCHProcess
We present the steps for evaluating adaptive alert prioritization and classification techniques with FAULTBENCH. Non-adaptive alert prioritization and classification techniques would only need to evaluate the ranked or classified alerts without fixing or suppressing alerts. For adaptive alert prioritization and classification techniques, the state of the alerts after each inspection is recorded. The project, source folder, file, method, alert type, line number, and description identify an alert. An alert may be in one of three states: uninspected, TP, or FP. The
FAULTBENCH process is as follows:
1. Run a static analysis tool against a clean version of the subject program. (If the static analysis can run automatically, turn on the option.)
2. Record the original state of the alert set.
3. Prioritize or classify the generated alerts with an alert prioritization or classification technique.
4. Starting at the top of the ranked or classified list of alerts, inspect each alert,
a. If the alert oracle indicates the alert is a fault, then fix the alert with the specified change. If the static analysis tool does not run automatically, then rerun static analysis.
b. If the alert oracle indicates the alert is a false positive, then suppress the alert.
5. After each alert inspection, record the state of the alert set. 6. After all alert inspections, evaluate the results via the
evaluation metrics provided in Section 3.1.3.
3.6
Benchmark Limitations
The subject programs in FAULTBENCH satisfy the seven desiderata for benchmarks described by Sim et al. [17]. However, each of the subject programs is relatively small, and may not be representative of larger programs. Additionally, the subject programs are all written in Java. Therefore, results obtained on via FAULTBENCH may not be applicable to alert ranking in other programming languages.
8
A random sequence generator may be found at http://random.org.
1 public void load() {
2 try {
3 BufferedReader in =
4 new BufferedReader(new
5 FileReader(file));
6 //do something with contents
7 in.close();
8 } catch (IOException e) {
9 }
10 }
Figure 3: Code Example – Additional Alert Closure
1 public void compare(String a) {
2 if (a == “”) {
3 //do something
4 }
5 if (a == “null”) {
6 //do something else
7 }
8 }
4.
BENCHMARK CASE STUDY
We assess the suitability of the subjects selected for FAULTBENCH
by evaluating three variants of the AWARE adaptive ranking model (ARM) static analysis alert prioritization and classification technique.
4.1
AWAREAdaptive Ranking Model (
ARM)
AWARE-ARM adaptively prioritizes and classifies static analysis alerts by the likelihood an alert is an indication of an important fault. Alerts are ranked on the continuum, [-1,1] where:• A ranking in [-1,0) implies the alert is likely a false positive, • A ranking in (0,1] implies the alert is likely a fault, and • A ranking of 0 means there is not enough information to
determine if the alert is likely a true or false positive. An alert population (p) is a subset of all alerts, which share a characteristic (e.g. alert type, code location). Static analysis alerts are ranked by their characteristics, called ranking factors, that demonstrate some causality with the likelihood an alert is an indication of a fault. The alert type [5, 10] and alert location [12] are the ranking factors in the current version of AWARE-ARM. These ranking factors are discussed in Section 4.1.3.
4.1.1
Baseline Context
The baseline context represents information about the size of the alert populations relative to the total number of alerts in a subject. Alert populations tend to be homogeneous [5, 12], and by increasing the ranking of large populations, we can quickly categorize many alerts as TP or FP (similar to information gain in [12]). The baseline context is the number of alerts in a population divided by the number of alerts for the project. The formula for calculating the baseline context is presented in Equation 5.
alerts total
alerts
BC p
p
# #
= (5)
4.1.2
Developer Context
The developer context represents information about what the developer has done to close and suppress alerts while using automated static analysis during development. Alert populations containing more than one alert tend to be homogeneous [5, 12]. Therefore, we utilize the developer’s feedback about the alerts to predict the likelihood that other, similar alerts, are faults. The development context is the difference between closed and suppressed alerts divided by the number of inspected alerts in the population as demonstrated in Equation 6.
p p
p p
p
pressed closed
pressed closed
DC
sup # #
sup # #
+ −
= (6)
4.1.3
Alert Ranking Factors
The following subsections describe the calculations of the alert type accuracy (ATA) and code locality (CL) alert ranking factors. The coefficients to the baseline (βBC) and developer (βDC) context for a population have a value of 0.5 implying that the baseline and developer context contribute equally to an alert ranking factor.
Alert Type Accuracy (ATA): ATA is the likelihood an alert (a)
is a fault based on the type of the alert (e.g. null pointer, unclosed stream, etc.) [10, 11]. ATA is the weighted combination of the baseline and developer context of the alert’s type. The ATA calculation is described in Equation 7.
( )
a(
BC BCtype) (
DC DCtype)
ATA = β ∗ + β ∗ (7)
Code Locality (CL): CL is the likelihood an alert (a) is a fault
based on the location of the alert (e.g. at the source folder, class, or method level). CL is the weighted combination of the baseline and developer context of the alert’s location. The contribution of each location is calculated by normalizing the counts of non-singleton source folder, methods, and classes from Table 2b of [12]. The coefficients for the contributions of the source folder, classes, and methods are 0.06, 0.25, and 0.69, respectively and are represented by the coefficients γsf, γc, and γm. We are only interested in the non-singleton populations because any action taken on an alert can be used to predict if the other alerts in the population are likely to be faults [12]. Singleton populations do not provide any predictive data. The calculation for CL is described in Equation 8.
( )
(
(
(
(
(
(
) (
) (
) (
) (
)
)
)
)
)
)
sf sf sf sf sf sf DC
sf sf sf sf sf sf BC
DC DC
DC
BC BC
BC a
CL
∗ + ∗ + ∗ ∗
+ ∗ + ∗ + ∗ ∗ =
γ γ
γ β
γ γ
γ β
(8)
4.1.4
Alert Ranking
The overall alert ranking calculation is the combination of alert ranking factors divided by the number of ranking factors. Three versions of AWARE-ARM prioritization and classification techniques are presented in Table 3.
Table 3: Experimental treatments for benchmark evaluation Treatment Description or Formula
ATA R
( )
a =ATA( )
a CL R( )
a =CL( )
aATA + CL
( )
( )
( )
2
a CL a ATA a
R = +
4.1.5
ARM Limitations
Similarly to [9, 10, 12], out ranking technique works best when the populations of interest are fine-grained (e.g. many alert types and locations) and homogeneous. Further research is required to determine how to prioritize static analysis alerts with non-homogeneous populations.
4.2
Case Study Specifics
Static analysis alerts were ranked and presented to the developer via the AWARE [5] Eclipse plug-in. AWARE gathers static analysis alerts generated from FINDBUGS and ranks the alerts using one of the ranking functions presented in Table 3. AWARE maintains alert closures and suppressions used to modify the ranking of the alerts. We used Eclipse version 3.3.1.1 for all of the benchmark subjects except iTrust. For iTrust, we used the Eclipse IDE for Java EE Developers version 3.3.1.1. Each version of AWARE contains one
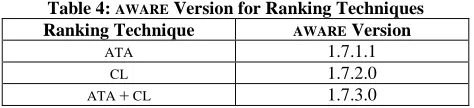
of the three versions of the AWARE-ARM prioritization and classification techniques. Table 4 presents the AWARE version for
each of the ranking techniques.
Table 4: AWARE Version for Ranking Techniques Ranking Technique AWARE Version
ATA 1.7.1.1
CL 1.7.2.0
5.
CASE STUDY RESULTS
FAULTBENCH provides data to answer the following research questions:
• [Q1]: Can alert prioritization improve the rate of fault detection when compared to the tool’s output?
• [Q2]: How does the rate of fault detection compare between alert ranking techniques?
• [Q3]: Can alert categorization correctly predict true positive (TP) and false positive (FP) alerts?
Question 1 and 2 are answered by using the area under the curve metric and the Spearman rank correlation, while question 3 is answered using the precision, recall, and accuracy metrics.
5.1
Q1: Improving Fault Detection Rate
We plot the cumulative percentage of faults detected against the number of inspections and measure the area under the curve to evaluate Question 1. Figure 5 provides an example of these plots for the jdom subject program. When TP alerts are fixed, the percentage of detected faults increases. There are plateaus in the ranking curve when a FP alert is suppressed at an inspection. A large plateau means there were a number of suppressions. A good ranking will minimize the large plateaus until most or all of the TP alerts have been identified.
0.00 0.20 0.40 0.60 0.80 1.00
0 4 8 12 16 20 24 28 32 36 40 44 48 52
Inspection
P
re
c
e
n
t
o
f
F
a
u
lt
s
D
e
te
c
te
d
Optimal Random ATA CL ATA + CL Tool
Figure 5: Area Under the Fault Detection Rate Curve for jdom
Table 5 presents the area under the fault detection rate curve metrics for each of the ranking techniques and benchmark subjects. The first question compares alert prioritization techniques to the TOOL ordering of alerts. In the absence of prioritization, developers only have the static analysis tool’s output for investigation. If the tool’s ordering performs well, then alert prioritization is not needed. However, all prioritization techniques except on csvobjects and iTrust perform better than the tool ordering. On average, all prioritization techniques
have a larger area under the curve (53.94% - 72.57%) than the
TOOL ordering (50.42%) of alerts.
Table 6 presents the Spearman rank correlation values between the alert prioritization techniques and OPTIMAL. A positive correlation implies that the specified ranking is similar to the
OPTIMAL ranking while a negative correlation implies that the specified ranking is opposite OPTIMAL. The closer the correlation is to 1 or -1, the stronger the match or opposition of the specified ranking. Cells containing one star (*) have correlations significant at the 0.05 level, while cells containing two stars (**) have correlations significant at the 0.01 level.
The TOOL experimental control ranking has a moderately strong correlation (e.g. correlation value > 0.600) with OPTIMAL for four of the subject programs. The strong correlation is likely due to a similar ordering of the FP alerts, and is not necessarily an indication of the fault detection capabilities of the TOOL ordering. For example, the TOOL ordering for jdom has a correlation of 0.724; however, the area under the fault detection curve for TOOL
is at least 20% less than ATA, CL, and ATA+CL as seen in Table 5.
5.2
Q2: Comparing Prioritizations
Table 5 presents the area under the fault detection rate curve metrics for each of the prioritization techniques on FAULTBENCH
subjects. The average area under an optimal curve is 90.0%. The
ATA ranking is closer to OPTIMAL than CL ranking. Additionally, the average ATA area is 30% larger than CL’s average area.
ATA+CL splits the difference between ATA’s and CL’s ranking. Table 6 presents the Spearman rank correlation values between the alert prioritization technique and OPTIMAL. The correlations between the alert prioritization techniques and OPTIMAL are similar to the patterns observed in the area under the curve measurement in Table 5. However, the ATA correlation with
OPTIMAL is typically stronger, indicating that ATA is the better prioritization technique.
Table 5: Area under the fault detection curve for ranking techniques
Subject Optimal Random ATA CL ATA + CL Tool
csvobjects 78.57% 59.52% 50.00% 21.43% 30.39% 54.76%
importscrubber 84.29% 71.82% 66.10% 40.91% 66.62% 36.23%
iTrust 95.5% 48.91% 74.36% 68.09% 67.36% 75.09%
jbook 78.55% 49.83% 46.26% 62.57% 74.19% 39.87%
jdom 91.82% 71.66% 86.16% 63.54% 85.35% 46.89%
org.eclipse.core.runtime 96.81% 68.61% 82.53% 67.09% 82.78% 49.67%
Average 87.58% 61.73% 72.57% 53.94% 67.88% 50.42%
Table 6: Spearman rank correlation
ATA CL ATA +
CL
TOOL
csvobjects 0.321 -0.643 -0.393 0.607 importscrubber 0.512** -0.026 0.238 0.203 iTrust 0.418** 0.264** 0.261** 0.772** jbook 0.798** 0.389** 0.599** -0.002 jdom 0.675** 0.288* 0.457** 0.724** org.eclipse.
core.runtime
5.3
Q3: Categorizing Alerts
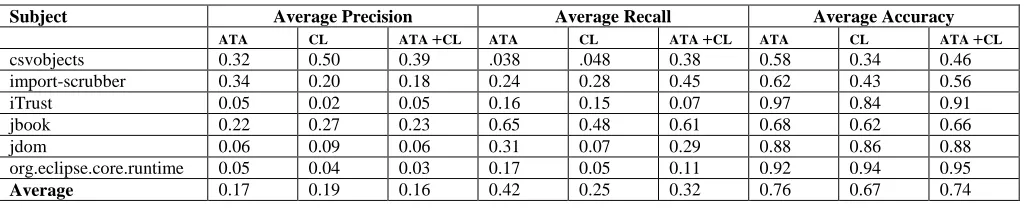
Table 7 presents the average precision, recall, and accuracy metrics before each inspection when adaptively categorizing static analysis alerts. We only consider the precision, recall, and accuracy metrics for uninspected alerts because we are trying to predict if the uninspected alerts are TPs or FPs. A ranking greater than 0 is a prediction that the alert is a TP while a ranking less than 0 is a prediction that an alert is a FP. We then assess the ranking’s classification using the alert oracle and the rank, as shown in Table 8.
Table 8: Alert Classification Assessment
Alert Oracle Ranking True Positive (TPC) TP > 0 True Negative (TNC) FP < 0 False Positive (FPC) FP > 0 False Negative (FNC) TP < 0
If the alert falls in the TPC or TNC categories, the ranking correctly classified the alert as TP or FP. As we learn more about the alerts from the developers, we expect the precision, recall, and accuracy to increase; however, the precision and recall tended to be 0 because after all TP alerts were identified, there was no longer a numerator in the precision and recall equations. The average accuracy is a better measure of how the classification techniques performed. ATA had the best average accuracy, and correctly predicted if an alert is a TP or FP 76% of the time.
5.4
Benchmark Evaluation
FAULTBENCH contains six programs of varying sizes from several domains. The programs with more than 50 static analysis alerts had more statistically significant results when comparing alert prioritizations with OPTIMAL using the Spearman rank correlation, than the smaller programs. Additionally, if jbook or iTrust
were the only subject used to evaluate alert prioritization techniques the ATA+CL and TOOL rankings were the best rankings, respectively, when with a larger sample, ATA was the best
prioritization technique. The same discrepancy applies when evaluating the classification accuracy of ATA+CL on org.eclipse.core.runtime.
The results of the Spearman rank correlation suggest there is bias in the creation of the OPTIMAL order because the TOOL ordering has a moderately strong correlation (> 0.600) with OPTIMAL for four of the subject projects. OPTIMAL defaults to an ordering of alerts by project, source folder, file, method, alert type, line number, and description in the case of a tie. The above ordering is very similar to the TOOL ordering for FINDBUGS due to the use of the Visitor pattern [6]. There are several optimal orderings of alerts, and a semi-randomized ordering may have less bias to the
FINDBUGS-TOOL ordering of alerts.
5.5
Case Study Limitations
We consider the three threats to the validity of our case study [16]: construct validity, internal validity, and external validity.
5.5.1
Construct Validity
Construct validity concerns our measurements. The measurements are straight forward and standard for ranking and classification analysis.
5.5.2
Internal Validity
Internal validity concerns the causal relationship between the dependent and independent variables. The main concern is with the tooling. In AWARE, possible inconsistencies in our measurements could occur when comparing the static analysis alerts due to line and source code changes during fault fix. We consider static analysis alerts to be the same if they share several characteristics including the line number and a hash of the source line. The source hash can change via refactoring and the line number can change through addition or deletion of surrounding code. If both of these characteristics change, we can no longer track the alert. When fixing alerts in the case study, only one of the two characteristics was modified in the source change for surrounding alerts. An additional complication is duplicate alerts. An alert is a duplicate when there are two alerts of the same type on the same line of code. The alert display combines the alerts into one listing. Therefore, suppression of the listing, leads to suppression of both alerts. Additional internal validity concerns come from the program used to analyze the inspection records. The alert comparison problems described above apply to the analysis program.
5.5.3
External Validity
External validity concerns how we can generalize our results. Using FAULTBENCH mitigates some of the concerns about generalizing the prioritization and classification results due to the varying domains of the subject programs and a larger sample size. Additionally, each of the subject programs is an open source application with real faults. However, the programs are relatively small, and there are concerns about scale.
6.
CONCLUSIONS AND FUTURE WORK
The literature in the realm of static analysis alert prioritization and classification is moving towards a definition of how to conduct static analysis alert prioritization research [9, 10, 12, 14, 20, 22]. We present FAULTBENCH to supplement the current benchmarks in other languages (e.g. BUGBENCH [14]) and larger Java benchmarks in specific sub-domains (e.g. CHORD subjects [15] for race detection). FAULTBENCH is available for use and critique at http://agile.csc.ncsu.edu/faultbench.
Table 7: Average precision, recall, and accuracy metrics of un-inspected alerts at before each inspection
Subject Average Precision Average Recall Average Accuracy
ATA CL ATA +CL ATA CL ATA +CL ATA CL ATA +CL
csvobjects 0.32 0.50 0.39 .038 .048 0.38 0.58 0.34 0.46
import-scrubber 0.34 0.20 0.18 0.24 0.28 0.45 0.62 0.43 0.56
iTrust 0.05 0.02 0.05 0.16 0.15 0.07 0.97 0.84 0.91
jbook 0.22 0.27 0.23 0.65 0.48 0.61 0.68 0.62 0.66
jdom 0.06 0.09 0.06 0.31 0.07 0.29 0.88 0.86 0.88
org.eclipse.core.runtime 0.05 0.04 0.03 0.17 0.05 0.11 0.92 0.94 0.95
We evaluated three alert prioritization techniques against the six subjects in FAULTBENCH. Evaluation of the prioritization
techniques against individual benchmark subjects produced varying results. On jbook the ATA+CL prioritization had a larger area under the fault detection curve; however, ATA prioritization had a higher rate of fault detection on average. In addition, the
TOOL ordering performed better than the alert prioritization techniques for csvobjects. Individually, the benchmark subjects provide varying results, but together, a larger sample of subject programs provides a better understanding of how alert prioritization and classification techniques work and increase the generalization of experimental conclusions.
We present FAULTBENCH to foster collaboration and communication within the static analysis alert ranking community. We will continue to evolve the benchmark. Additionally, we will continue to investigate static analysis alert ranking techniques, by analyzing the contributions of the ranking factors via FAULTBENCH, and modifying the ranking calculations accordingly.
7.
ACKNOWLEDGMENTS
This research is funded by an IBM PhD Fellowship awarded to the first author. We would like to thank the RealSearch reading group, particularly Andy Meneely, for their feedback. We would like to thank Ben Smith for suggesting the benchmark name.
8.
REFERENCES
[1] N. Ayewah, W. Pugh, J. D. Morgenthaler, J. Penix, and Y. Zhou, "Evaluating Static Analysis Defect Warnings On Production Software," Proceedings of the 7th ACM
SIGPLAN-SIGSOFT Workshop on Program Analysis for Software Tools and Engineering, San Diego, CA, USA, June
13-14, 2007, pp. 1-8.
[2] B. W. Boehm and R. Turner, Balancing Agility and
Discipline: A Guide for the Perplexed: Addison-Wesley,
2003.
[3] G. Boetticher, T. Menzies, and T. Ostrand, "PROMISE Repository of Empirical Software Engineering Data,"
http://promisedata.org/ repository, West Virginia University, Department of Computer Science, 2007.
[4] C. Boogerd and L. Moonen, "Prioritizing Software Inspection Results using Static Profiling," Proceedings of the
6th IEEE Workshop on Source Code Analysis and Manipulation, Philadelphia, PA, USA, September 27-29,
2006, pp. 149-160.
[5] S. S. Heckman, "Adaptively Ranking Alerts Generated from Automated Static Analysis," in ACM Crossroads. vol. 14, no. 1, 2007, pp. 16-20.
[6] D. Hovemeyer and W. Pugh, "Finding Bugs is Easy,"
Proceedings of the 19th ACM Conference on
Object-Oriented Programming, Systems, Languages, and
Applications, Vancouver, British Columbia, Canada, October
24-28, 2004, pp. 132-136.
[7] M. Hutchins, H. Foster, T. Goradia, and T. Ostrand, "Experiments on the Effectiveness of Dataflow- and Controlflow-Based Test Adequacy Criteria," Proceedings of
the 19th International Conference on Software Engineering,
Sorrento, Italy, May 16-21, 1994, pp. 191-200.
[8] IEEE, "IEEE Standard 610.12-1990, IEEE Standard Glossary of Software Engineering Terminology," 1990.
[9] S. Kim and M. D. Ernst, "Prioritizing Warning Categories by Analyzing Software History," Proceedings of the
International Workshop on Mining Software Repositories, to appear, Minneapolis, MN, USA, May 19-20, 2007.
[10] S. Kim and M. D. Ernst, "Which Warnings Should I Fix First?," Proceedings of the 6th Joint Meeting of the
European Software Engineering Conference and the ACM SIGSOFT Symposium on the Foundations of Software Engineering, Dubrovnik, Croatia, September 3-7, 2007, pp.
45-54.
[11] S. Kim, T. Zimmermann, J. E. James Whitehead, and A. Zeller, "Predicting Faults from Cached History,"
Proceedings of the 29th International Conference on Software Engineering, Minneapolis, MN, USA, May 23-25,
2007, pp. 489-498.
[12] T. Kremenek, K. Ashcraft, J. Yang, and D. Engler, "Correlation Exploitation in Error Ranking," Proceedings of
the 12th ACM SIGSOFT International Symposium on Foundations of Software Engineering, Newport Beach, CA,
USA, 2004, pp. 83-93.
[13] T. Kremenek and D. Engler, "Z-Ranking: Using Statistical Analysis to Counter the Impact of Static Analysis Approximations," Proceedings of the 10th International
Static Analysis Symposium, San Diego, California, 2002.
[14] S. Lu, Z. Li, F. Oin, L. Tan, P. Zhou, and Y. Zhou, "BugBench: Benchmarks for Evaluating Bug Detection Tools," Proceedings of the Workshop on the Evaluation of
Software Defect Detection Tools, Chicago, Illinois, 2005.
[15] M. Naik and A. Aiken, "Effective Static Race Detection for Java," Proceedings of the ACM SIGPLAN 2006 Conference
on Programming Language Design and Implementation,
Ottawa, Canada, June 10-16, 2006, pp. 308-319.
[16] G. Rothermel, R. H. Untch, C. Chu, and M. J. Harrold, "Prioritizing Test Cases For Regression Testing," IEEE
Transactions on Software Engineering, vol. 27, no. 10, pp.
929-948, October, 2001.
[17] S. E. Sim, S. Easterbrook, and R. C. Holt, "Using Benchmarking to Advance Research: A Challenge to Software Engineering," Proceedings of the 25th International Conference on Software Engineering, Portland,
Oregon, USA, May 3-10, 2003, pp. 74-83.
[18] W. F. Tichy, "Should Computer Scientists Experiment More?," in Computer. vol. 31, no. 5, 1998, pp. 32-40. [19] S. Wagner and M. A. Florian Deissenboeck, Johann
Wimmer, Markus Schwalb, "An Evaluation of Two Bug Pattern Tools for Java," Proceedings of the 1st IEEE
International Conference on Software Testing, Verification, and Validation, Lillehammer, Norway, to appear, 2008.
[20] C. C. Williams and J. K. Hollingsworth, "Automatic Mining of Souce Code Repositories to Improve Bug Finding Techniques," IEEE Transactions on Software Engineering, vol. 31, no. 6, pp. 466-480, 2005.
[21] J. Zheng, L. Williams, N. Nagappan, W. Snipes, J. Hudepohl, and M. Vouk, "On the Value of Static Analysis for Fault Detection in Software," IEEE Transactions on
Software Engineering, vol. 32, no. 4, pp. 240-253, April,
2006.
[22] T. Zimmermann, R. Premraj, and A. Zeller, "Predicting Defects in Eclipse," Proceedings of the 3rd International
Workshop on Predictor Models in Software Engineering,
![Figure 1: Classification Table (adapted from [22] Zimmermann et al. used the term defect where we use the](https://thumb-us.123doks.com/thumbv2/123dok_us/1616202.1200587/3.612.319.557.462.598/figure-classification-table-adapted-zimmermann-used-term-defect.webp)