ISSN(Online): 2319-8753 ISSN (Print): 2347-6710
I
nternational
J
ournal of
I
nnovative
R
esearch in
S
cience,
E
ngineering and
T
echnology
(A High Impact Factor, Monthly, Peer Reviewed Journal) Visit: www.ijirset.com
Vol. 6, Issue 12, December 2017
Enhancement of Reconfiguration Problem
Using Particle Swarm Optimization for Power
Distribution System
K.K.S.V.V.Prakasa Rao, Dr.P.Hema Chandu, Dr.V.C.Veera Reddy
Satish Dhawan Space Centre, Andhra Pradesh, India Associate Prof.& HOD, Dept. of EEE, SVTM, MPL, India
Retd Professor, SV University, Tirupati, India
ABSTRACT: This paper introduces a new, fast, Particle swarm Optimization algorithm (PSO) for the purpose of
solving the DSR problem in normal operation by satisfying all objectives simultaneously with a relatively small number of generations and relatively short computation time. The objectives of the problem are to minimize real power losses and improve the voltage profile and load balancing index with minimum switching operations. Instead of generating several ranks from the non dominated set of solutions, this algorithm deals with only one rank; then the most suitable solution is chosen according to the operator's wishes. If there is no preference and all objectives have the same degree of importance, the best solution is determined by simply considering the sum of the normalized objective values. Also, a PSO operation is applied instead of a random one to speed up convergence. Radial system topology is satisfied using graph theory by formulating the branch bus incidence matrix (BBIM) and checking the rank of each topology. To test the algorithm, it was applied to widely studied test systems and a real one. The results show the efficiency of this algorithm as compared to other methods in terms of achieving all the goals simultaneously with reasonable population and generation sizes and without using a mutation rate, which is usually problem dependent.
KEYWORDS: Distribution system reconfiguration, graph theory, guided mutation, Particle swarm Optimization
algorithm (PSO).
I. INTRODUCTION
The distribution system constitutes a significant part of a total power system. A distribution system is one from which the power is distributed to various users through feeders, distributors and service mains. Feeders are conductors of large current carrying capacity and carry the current in bulk to the feeding points. Power losses in the lines account for the major portion of the distribution system losses. These power losses mainly depend on the type of conductor and its resistance, size and length. To meet the present growing domestic, industrial and commercial load day by day, effective planning of the radial distribution network is required. Increasing costs of energy and costs of generating capacity are encouraging the electric utility to spend capital to improve the efficiency of the distribution system. The objective of distribution system planning is to assure the growing demand for electricity, in terms of increasing growth rates and high load densities that can be satisfied in an optimum way by additional distribution systems. The single line diagram of a sample radial distribution feeder is shown in Figure 3.1 where the digits indicate branch and alphabets represent the node. Proper selection of branch conductors for connecting the load point is required to reduce the planning cost. Although the uniform conductor can reduce the loss of the system, it increases the planning cost.
ISSN(Online): 2319-8753 ISSN (Print): 2347-6710
I
nternational
J
ournal of
I
nnovative
R
esearch in
S
cience,
E
ngineering and
T
echnology
(A High Impact Factor, Monthly, Peer Reviewed Journal) Visit: www.ijirset.com
Vol. 6, Issue 12, December 2017
the delivered cost of electric power. The power sources are located in the load area to be served by the distribution system that generates power substations supplied over transmission lines.
(a)Sub-Transmission Circuits
The sub-transmission circuits extend from the bulk power source or source to the various distribution substations located in the load area. They may be radial circuits connected to a bulk power source at only one end or loop and ring circuits connected to one or more bulk power sources at both ends. The sub-transmission circuits consist of underground cable, aerial cable or overhead open-wire conductors carried on poles or some combination of them. The sub-transmission voltage is usually between 11/33KV.
(b)Distribution Substation
Each distribution substation normally serves its own load area, which is a sub division of the area served by the distribution system. At the distribution substation, the sub-transmission voltage is reduced for general distribution throughout the area. The substation consists of one or more power transformer banks together with the necessary voltage regulating equipment, buses and switchgear.
(c)Primary Feeders
The area served by the distribution substation is also sub-divided and each sub-division is supplied by a distribution or primary feeder. The three-phase primary feeder is usually run out from the low-voltage bus of the substation to its load centre, where it branches into three phase sub feeders and single-phase laterals.
(d)Distribution Transformers
Distribution transformers are ordinarily connected to each primary feeder and its sub feeders and laterals. These transformers serve to step down from the distribution voltage to the utilization voltage. Each transformer or banks of transformers supply a consumer or group of consumers over its secondary circuit. Each consumer is connected to the secondary circuit through his service leads and meter. The secondary and service connections may be either cable or open-wire circuits.
(e)Classification of Distribution Systems
Fig1. Classifications of Distribution Schemes
Three different ways exist to lay out a power distribution system used by electric utilities, each of which has variations in its own design. A considerable amount of effort is necessary to maintain an electric power supply within the requirements of the various types of consumers.
ISSN(Online): 2319-8753 ISSN (Print): 2347-6710
I
nternational
J
ournal of
I
nnovative
R
esearch in
S
cience,
E
ngineering and
T
echnology
(A High Impact Factor, Monthly, Peer Reviewed Journal) Visit: www.ijirset.com
Vol. 6, Issue 12, December 2017
II. SOLUTION METHOD
A. Problem Formulation
The DSR problem is to determine the optimum open/closed status of all the switches in the system. The problem is formulated as a multi-objective optimization problem to achieve the following four objectives, which lead to optimum system performance. These objectives are expressed as fitness functions to be implemented in the PSO.
1) Real power loss minimization, expressed as
∑ ……. (1)
where
Nb number of branches; Rk resistance of branch ;
Pk real power at sending end of th branch; Qk reactive power at sending end of th branch' Vk voltage at sending end of th branch.
2) Voltage profile optimization to enhance the system quality. This can be achieved by choosing the topology w
max ∀∈ (2) Where N is the number of buses, and Vj is the voltage at bus.
3) Load balancing optimization to minimize the likelihood of system overloading which is achieved by transferring loads from heavily loaded feeders to less loaded ones. This requires a modification of the radial topology of the system, and it is characterized by minimizing the system load balancing index (SLBI) [35]. This objective is expressed as
min SLBI=min ∑ ….. (3)
Where Sj is the apparent power flow in branch j, and Sjmax is the maximum apparent power capacity of branch . 4) Minimization of the number of switching operations. We assume that there is a switch associated with each branch.
This number of operations should be minimized in order to reduce the switching transients and operating costs due to continuous change in the distribution system. This objective is expressed as
∑ (4) where sw is the number of tie switches, and is the status of the th tie switch in the initial topology after reconfiguration (0 or 1).
These four objectives are subject to the following constraints: 1) The power flow equations must be satisfied. Thus
where (7) take into account the fundamental circuit laws, assume balanced conditions, and are based on the Newton- Raphson algorithm.
2) Voltage should be constrained within maximum and minimum allowable limits, i.e.,
≤ ≤ ∀ ∈ (5)
2) In order to achieve the load balancing objective, branches should not exceed their current capacities, i.e.,
| |≤ ∀ ∈ (6)
ISSN(Online): 2319-8753 ISSN (Print): 2347-6710
I
nternational
J
ournal of
I
nnovative
R
esearch in
S
cience,
E
ngineering and
T
echnology
(A High Impact Factor, Monthly, Peer Reviewed Journal) Visit: www.ijirset.com
Vol. 6, Issue 12, December 2017
The four objectives are evaluated for a given system topology and sorted according to the above-described nondominated set concept, with real power loss minimization chosen as the principal objective. The new algorithm is illustrated by the flowchart shown in Fig. 1 and described in some detail in the following Sections III-B through III-H. It produces a list of the nondominated set of solutions satisfying these four objectives, and the operator has the option of selecting the topology that best fits his requirements.
III. PARTICLE SWARM OPTIMIZATION
There is no known single advancement strategy accessible for taking care of all enhancement issues. A ton of advancement routines have been produced for taking care of diverse sorts of enhancement issues lately. The present day streamlining techniques (some of the time called nontraditional enhancement strategies) is effective and famous systems for taking care of complex building issues. These strategies are molecule swarm improvement calculation, neural systems, hereditary calculations, subterranean insect province advancement, fake insusceptible frameworks, and fluffy streamlining. The Particle Swarm Optimization calculation (truncated as PSO) is a novel populace based stochastic hunt calculation and an option answer for the complex non-direct advancement issue. The PSO calculation was initially presented by Dr. Kennedy and Dr. Eberhart in 1995 and its essential thought was initially enlivened by reproduction of the social conduct of creatures, for example, flying creature running, fish educating et cetera. It is taking into account the common procedure of gathering correspondence to share singular information when a gathering of winged animals or creepy crawlies look sustenance or relocate et cetera in a seeking space, albeit all feathered creatures or bugs don't know where the best position is. In any case, from the way of the social conduct, if any part can figure out an alluring way to go, whatever remains of the individuals will take after rapidly.
The PSO calculation fundamentally gained from creature's movement or conduct to take care of advancement issues. In PSO, every individual from the populace is known as a molecule and the populace is known as a swarm. Beginning with a haphazardly introduced populace and moving in arbitrarily picked bearings, every molecule experiences the looking space and recollects the best past positions of itself and its neighbors. Particles of a swarm convey great positions to one another and in addition powerfully alter their own position and speed got from the best position of all particles. The following step starts when the sum total of what particles have been moved. At last, all particles have a tendency to fly towards better and better positions over the looking procedure until the swarm move to near an ideal of the wellness capacity.
The PSO technique is turning out to be exceptionally main stream in view of its straightforwardness of execution and capacity to quickly unite to a decent arrangement. It doesn't require any angle data of the capacity to be enhanced and utilizes just primitive scientific administrators. As contrasted and other improvement techniques, it is quicker, less expensive and more productive. Likewise, there is couple of parameters to alter in PSO. That is the reason PSO is a perfect advancement issue solver in streamlining issues. PSO is appropriate to explain the direct, non-raised, consistent, discrete, whole number variable sort issues. Points of interest and Disadvantages of PSO. It is said that PSO calculation is the a standout amongst the most intense systems for tackling the non-smooth worldwide enhancement issues while there are a few drawbacks of the PSO calculation. The points of interest and drawbacks of PSO are examined underneath:
ISSN(Online): 2319-8753 ISSN (Print): 2347-6710
I
nternational
J
ournal of
I
nnovative
R
esearch in
S
cience,
E
ngineering and
T
echnology
(A High Impact Factor, Monthly, Peer Reviewed Journal) Visit: www.ijirset.com
Vol. 6, Issue 12, December 2017
particles in gatherings and permitting them to have distinctive individual and social contemplations can enhance the execution of PSO impressively.
IV. SIMULATION RESULTS
The proposed algorithm was programmed using MATLAB7.12 and implemented on a 1.64-GHz Notebook PC with 4 GB of RAM. It was applied to two widely-studied test systems, a 33-bus system. In order to test the convergence performance of the PSO, it was applied 100 times to each system and the most repeated solution set (the mode) was selected as the actual or representative solution set. The mode set represented 92% of all solutions sets for the 33-bus system. And each chromosome was evaluated according to (3)–(6) using a Newton Rap son based load flow program. The results are presented in the following and compared with results from other work.
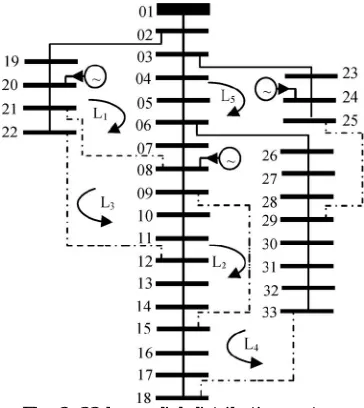
33-Buses Test System
Fig. 2. 33-bus radial distribution system
The system data is given in [8]. As shown in Fig. 2, the system consists of 33 nodes, 37 branches, and five fundamental loops. The base MVA and kV are 10 and 12.66, respectively, and the total system loads are 3715 kW and 2300 kVAR. Initially, branches 33,34,35,36, and 37 are open, as shown in Fig. 3, and the total system power loss is 224.93 kW. The new PSO produced a set of 34 no dominated solutions. Only the optimum topologies (from that set) according to the four objective functions are listed in Table I. The results shown in Table I was obtained after ten generations and with an initial population of 30 chromosomes, and it required 20.2 s of CPU time.
ISSN(Online): 2319-8753 ISSN (Print): 2347-6710
I
nternational
J
ournal of
I
nnovative
R
esearch in
S
cience,
E
ngineering and
T
echnology
(A High Impact Factor, Monthly, Peer Reviewed Journal) Visit: www.ijirset.com
Vol. 6, Issue 12, December 2017
Fig 3. Voltage profile of the IEEE 33 bus System with & without Particle Swarm Optimization (PSO)
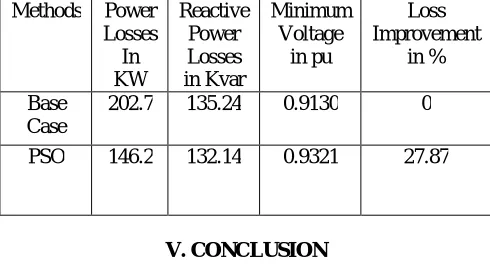
TABLE I
OPTIMUM SOLUTIONS OF THE FOUR OBJECTIVES RESULTING FROM THE APPLICATION OF FNSGA TO THE 33-BUS SYSTEM
Methods Power Losses
In KW
Reactive Power Losses in Kvar
Minimum Voltage
in pu
Loss Improvement
in % Base
Case
202.7 135.24 0.9130 0 PSO 146.2 132.14 0.9321 27.87
V. CONCLUSION
ISSN(Online): 2319-8753 ISSN (Print): 2347-6710
I
nternational
J
ournal of
I
nnovative
R
esearch in
S
cience,
E
ngineering and
T
echnology
(A High Impact Factor, Monthly, Peer Reviewed Journal) Visit: www.ijirset.com
Vol. 6, Issue 12, December 2017
REFERENCES
[1] A. A. Zin, A. Ferdavani, A. Khairuddin, and M. Naeini, “Two circularupdating hybrid heuristic methods for minimum-loss reconfiguration of electrical distribution network,” IEEE Trans. Power Syst., vol. 28, no. 2, pp. 1318–1323, May 2013.
[2] T. Thakur and Jaswanti, “Study and characterization of power distribution network reconfiguration,” in Proc. 2006 IEEE Power and Energy Society Transmission and Distribution Conf., pp. 1–6.
[3] D. Shirmohammadi and H. Wayne Hong, “Reconfiguration of electric distribution networks for resistive losses reduction,” IEEE Trans.Power Del., vol. 4, no. 2, pp. 1492–1498, Apr. 1989.
[4] S. Civanlar, J. J. Grainger, H. Yin, and S. S. H. Lee, “Distribution feeder reconfiguration for loss reduction,” IEEE Trans. Power Del., vol. 3, no. 3, pp. 1217–1223, Jul. 1988.
[5] M. E. Baran and F. F. Wu, “Network reconfiguration in distribution systems for loss reduction and load balancing,” IEEE Trans. PowerDel., vol. 4, no. 2, pp. 1401–1407, Apr. 1989.
[6] T. P. Wagner, A. Y. Chikhani, and R. Hackam, “Feeder configuration for loss reduction: An application of distribution automation,” IEEETrans. Power Del., vol. 6, no. 4, pp. 1922–1931, Oct. 1991.
[7] S. K. Goswami and S. K. Basu, “A new algorithm for the reconfiguration of distribution feeders for loss minimization,” IEEE Trans. PowerDel., vol. 7, no. 3, pp. 1484–1491, Jul. 1992.
[8] T. E. McDermott, I. Drezga, and R. P. Broadwater, “A heuristic nonlinear constructive method for distribution system reconfiguration,” IEEE Trans. Power Syst., vol. 14, no. 2, pp. 478–483, May 1999.
[9] W. M. Lin and H. C. Chin, “A new approach for distribution feeder reconfiguration for loss reduction and service restoration,” IEEE Trans. Power Del., vol. 13, no. 3, pp. 870–875, Jul. 1998.
[10] M. A. Kashem, G. B. Jasmon, A. Mohamed, and M. Moghavvemi, “Artificial neural network approach to network reconfiguration for loss minimization in distribution networks,” Int. J. Elect. Power EnergySyst., vol. 20, no. 4, pp. 247–258, May 1998.
[11] A. Augugliaro, L. Dusonchet, M. G. Ippolito, and E. R. Sanseverino, “Minimum losses reconfiguration of MV distribution networks through local control of tie-switches,” IEEE Trans. Power Del., vol. 18, no. 3, pp. 762–771, Jul. 2003.
[12] K. Nara, Y. Mishima, A. Gjyo, T. Ito, and H. Kaneda, “Loss minimum reconfiguration of distribution system by tabu search,” in Proc. 2002 IEEE Conf. Transmission and Distribution, Asia, pp. 232–236.
[13] Y. Jeon and J. Kim, “Network reconfiguration in radial distribution system using simulated annealing and tabu search,” in Proc. 2000 IEEE Power Engineering Society Winter Meeting, pp. 2329–2333.
[14] A. Skoonpong and S. Sirisumrannukul, “Network reconfiguration for reliability worth enhancement in distribution systems by simulated annealing,” in Proc. 2008 IEEE Int. Conf. Electronics, ComputerTelecommunications, and Information, pp. 937–940.
[15] K. H. Jung, H. Kim, and Y. Ko, “Network reconfiguration algorithm for automated distribution systems based on artificial intelligence approach,” IEEE Trans. Power Del., vol. 8, no. 4, pp. 1933–1941, Oct. 1993.
[16] S. H. K. Vuppalapati and A. K. Srivastava, “Application of ant colony optimization for reconfiguration of shipboard power system,” Int. J.Eng., Sci., Technol. (IJEST), vol. 2, no. 3, pp. 119–131, 2010.
[17] A. Ahuja, S. Das, and A. Pahwa, “An AIS-ACO hybrid approach for multi-objective distribution system reconfiguration,” IEEE Trans.Power Syst., vol. 22, no. 3, pp. 1101–1111, Aug. 2007.
[18] Y. T. Hsiao, “Multi-objective evolution programming method for feeder reconfiguration,” IEEE Trans. Power Syst., vol. 19, no. 1, pp. 594–599, Feb. 2004.