MODAL ANALYSIS WITH CONSIDERATION OF MISSING MASS
AS PER RG 1.92
Javed Iqbal 1, Hing-Ho Tsang 2, Munir Ahmad3
1 Principal Engineer, Pakistan Atomic Energy Commission ([email protected]) 2 Lecturer, Department of Civil Engineering, The University Hong Kong
3Chief Engineer, Pakistan Atomic Energy Commission
ABSTRACT
In the use of response spectrum method, it is typically impractical to calculate all mode shapes and natural frequencies. Research conducted in the last decade has shown that in the regions of rigid modal responses, the appropriate method to combine rigid responses is the algebraic sum method. SSCs in some nuclear power plants may however have a number of important modes with natural frequencies above the frequency at which the response spectrum returns to the Zero Period Acceleration (ZPA), namely fZPA. The Missing Mass Method is a convenient method to account for the contribution of all modes with frequencies above fZPA. It constitutes the total effects of all system masses which do not participate in (missing) modes with frequencies below fZPA. The system response to the missing mass is calculated by performing a static analysis for the applied loads equal to the missing mass multiplied by the spectrum ZPA. This method is mathematically rigorous and is considered the only acceptable method to account for high frequency modal contributions
The report describes the details of application of Missing Mass Method through analysis of a typical radioactive building according to USNRC RG 1.92 (2002). The building is a 20.3 m high rigid shear wall structure (including 6 m basement) with stack height of 28.5 m. It has been modeled to calculate the participation mass ratio. The participating mass is well below 90% at 33 Hz (i.e. ZPA). Therefore, the missing mass is added during the dynamic analysis in order to yield the true response of the structure.
INTRODUCTION
In seismic analysis and design of structures, a direct integration of the dynamic equation of motion could yield the “true” (more accurate) response of a structure when subjected to a particular earthquake time history. Practical difficulties associated with the analysis of large real life structural models lead to the use of response spectrum method instead of the direct integration method. Furthermore, the earthquake input needed in the design of structures subjected to future earthquakes is defined in terms of a response spectrum. The response spectrum method utilizes the concept of modal superposition. In typical regular building structures only a few lower order modes are sufficient to evaluate the total response with reasonable accuracy. Unlike regular structures, high frequency modes and non-linear effects contribute significantly to the seismic analysis of irregular structures.
Revision 1 methods for combining modal responses, their analyses should address the residual rigid response of the missing mass modes
DESCRIPTION OF MODAL RESPONSE COMBINATION METHODS
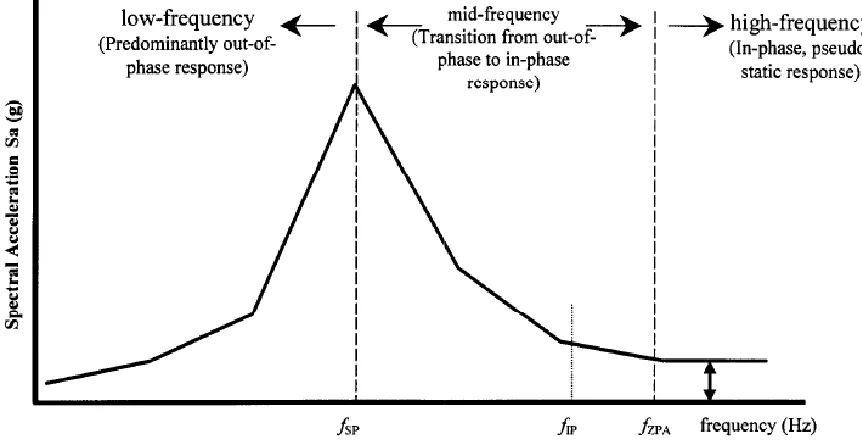
The major application of seismic response spectrum analysis is for systems and components attached to building structures. A building-filtered in-structure response spectrum depicting spectral acceleration vs. frequency is the typical form of seismic input for such analyses. This type of spectrum usually exhibits a sharp peak at the fundamental frequency of the building/soil dynamic system. An idealized in-structure response spectrum is shown in Figure 1, in which the spectral regions and key frequencies are indicated.
fSP = frequency at which the peak spectral acceleration is reached; typically the fundamental frequency of the building/soil system
fZPA = frequency at which the spectral acceleration returns to the zero period acceleration (ZPA)
f1P = frequency above which the SDOF modal responses are in-phase with the time varying acceleration input used to generate the spectrum
Figure 1: An idealized in-structure response spectrum
The high frequency region of the spectrum (> fZPA) is characterized by no amplification of the peak acceleration of the input time history. A SDOF oscillator having a frequency greater than fZPA is accelerated in-phase and with the same acceleration magnitude as the applied acceleration, at each instant in time. A system or component with fundamental frequency fZPA is correctly analyzed as a static problem subject to a loading equal to mass times ZPA. This concept can be extended to the high frequency (> fZPA) modal responses of multi-modal systems or components. The mass not participating in the amplified modal responses (i.e., “missing mass”) multiplied by the ZPA is applied in a static analysis, to obtain the response contribution from all modes with frequencies greater than fZPA.
that the peak modal responses are randomly phased, the square root of the sum of the squares (SRSS) method was developed and adopted. Modifications to SRSS were subsequently developed, in order to account for potential phase correlation when modal frequencies are numerically close (i.e., “closely spaced modes”).
In the mid-frequency region (fSP < f < fZPA), it has been postulated that the peak SDOF oscillator modal responses consist of two distinct and separable elements. The first element is the out-of-phase response component and the second element is the in-phase response component. It is further postulated that there is a continuous transition from out-of-phase response to in-phase response. If f1P < fZPA can be defined, then the mid-frequency region can be further divided into two sub-regions:&, fSP < f < f1P and f1P < fSP < fZPA.
Conventional practice in the nuclear power industry has been to assume that individual modal responses in the mid-frequency region (fSP < f < fZPA are out-of-phase, and combination methods applicable to the low-frequency region are applicable to the mid-frequency region.)
Terms used in the following sections are:
Sai = Spectral Acceleration for mode i R = Response of mode i
αi = In-phase response ratio for mode i Ri = In-phase response component for mode i Rpi = Out-of-phase response component for mode i Rr = Total in-phase response component from all modes Rp = Total out-of-phase response component from all modes Rt = Total combined response from all modes
Cjk = Modal response correlation coefficient between modes j and k.
Combination of Out-Of-Phase Modal Responses Components
In generalized form, all of the out-of-phase modal response combination methods can be represented by a single equation
[∑
∑
]
The coefficients Cjk has to be uniquely defined for each method.
Square Root Of Sum of Squares (SRSS) Method
SRSS Method is typically adopted in all methods for combining uncorrelated modal responses. Other methods for combination of the out-of-phase response components are equivalent to SRSS if there are no “closely spaced” modes (i.e. natural frequencies).
In the case of SRSS, Cjk = 1.0 for j = k Cjk = 0.0 for j ≠ k
SRSS Combination reduces to: Rp =
[∑
]
The definition of modes with closely spaced frequencies is a function of the critical damping ratio:
(1) For critical damping ratio < 2%, modes are considered closely spaced if the frequencies are within 10% of each other (i.e., for fi < fj , fj ≤ 1.1 fi ).
For response spectrum analysis, in which each of the three spatial components are calculated separately, Chu, Amin, and Singh (1972) concluded that for an SCC subjected to the action of the three components of earthquake ground motions, the representative maximum response of interest of the SSC can be satisfactorily obtained by taking the SRSS of the corresponding maximum response of each of the three components calculated separately.
The SRSS procedure for combining the responses of the three components of earthquake ground motions is based on the consideration that it is very unlikely that the maximum response for each of the three spatial components would occur at the same time during an earthquake.
Separation of Modal Responses into Out-Of-Phase Components and In-Phase Components
Three methods have received considerable prior review and evaluation: Lindley-Yow (1980) Hadjian (1981), and Gupta (1993). The mathematical statement of each method is not restricted to the mid-frequency range (fSP < f < fZPA) of the response spectrum. However, it is in the mid-frequency range that the separation of individual peak modal responses into out-of-phase and in-phase modal response components is applicable.
RG 1.92 PROVISIONS
This guide describes methods for complying with the regulations regarding the following aspects of seismic response analysis:
(1) Combining the responses of individual modes (in the use of the response spectrum method) to a component of the three orthogonal spatial components of earthquake ground motions (two horizontal and one vertical), to find the representative maximum response of interest (such as displacement, acceleration, shear, moment, stress, or strain) for a given element of the SSC in a nuclear power plant;
(2) Combining the maximum response of each of the three orthogonal spatial components (two horizontal and one vertical) of earthquake ground motions.
The seismic response of interest with regard to an SSC consists of two parts, which are referred to as the “damped-periodic” or simply “periodic” response and the “rigid” response in fundamental structural dynamics theory.
MISSING MASS METHOD
The Missing Mass method is a convenient, computationally efficient and accurate method for the following uses:
(1) Account for the contribution of all modes with frequencies above the frequency (fZPA) at which the response spectrum returns to the zero period acceleration (ZPA).
(2) Account for the contribution to support reactions of mass that is apportioned to system support points.
The Missing Mass method constitutes the total effects of all system mass that is not included in the modes with frequencies below fZPA. The system response to the missing mass is calculated by performing a static analysis for the applied load that equals the missing mass multiplied by the spectrum ZPA. This method is considered the only acceptable method to account for high-frequency modal contributions (f ≥ fZPA) and the effects of mass apportioned to system support points.
missing mass contribution is not limited to response spectrum analyses alone. Modal superposition time-history analysis is most accurately and efficiently performed by a procedure similar to that employed in response spectrum analysis. Only modes that vibrate at frequencies below fZPA need to be included in the transient mode superposition solution. The missing mass contribution, scaled to the instantaneous acceleration, is then algebraically summed with the transient solution at the corresponding time to obtain the total solution.
This method is more rigorous and accurate than including additional modes in the transient mode superposition solution. Even if additional modes are included, it is still necessary to calculate the missing mass for the excluded, higher frequency modes and system support points.
Mathematically, the complete solution is represented as follows:
[
]
[∑
∑
]
(1)
he re n=number of modes belo
f
ZPA
[
]
where
is the rigid response for the Ith component of seismic input motion (I = 1, 2, 3, for one vertical and two horizontal components), calculated by using the Static ZPA method.
CASE STUDY: A TYPICAL RADIOACTIVE BUILDING
A typical radioactive structure has been selected for application of the Missing Mass Method. UBC (1997) design spectrum has been applied in two orthogonal and one vertical direction (2/3rd of horizontal). The structure has the following dimensions.
Length = 42.0 m Breadth = 21.0 m Basement Level = -6.0 m Stack Height = 28.5 m
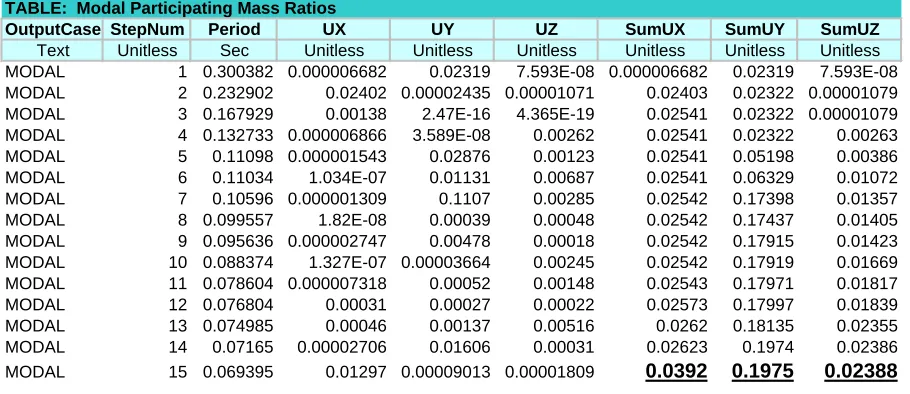
The structure has 5 levels. Therefore, the modal analysis was performed with 15 modes (5x3 = 15). The modal mass participation ratio results are as shown in Table 1. The values of cumulative modal participation ratio in X, Y & Z direction are 3.92 %, 19.75 % & 2.38 % respectively. The period of the 15th mode is 0.069 sec (i.e. 14.5 Hz). For the response spectrum analysis, the current code states that “at least 90 percent of the participating mass of the structure must be included in the calculation of response for each principal direction.” Therefore, the number of modes to be evaluated must satisfy this requirement.
In order to capture the true response at 33 Hz, the number of modes was increased gradually to 78. At Zero Period Acceleration (0.0303 sec), the cumulative modal mass participation values in X, Y and Z directions are 61.5 %, 69.8 % & 14.05 % respectively as shown in Table 2.
Missing Mass Calculations
X Direction = (1- 0.61) (%) x 0.15 (g) = 0.058 (g) x 9.8 = 0.573 m/s2 Y Direction = (1- 0.69) (%) x 0.15 (g) = 0.046 (g) x 9.8 = 0.455 m/s2 Z Direction = (1- 0.14) (%) x 0.15 (g) = 0.129 (g) x 9.8 = 1.234 m/s2
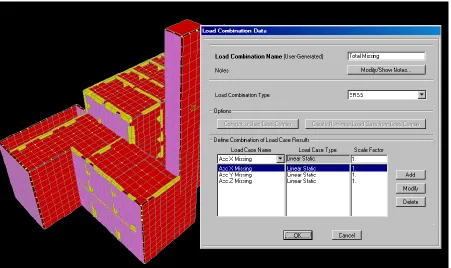
The resulting acceleration values are to be applied by creating Missing Mass Load Cases in X, Y & Z directions. The typical Missing Mass Load Case in X direction is shown in Figure 2.
mass effect in UBC (97) spectrum (considering modes up to ZPA) to take into account the total effects of all masses that are not included in the modes with frequencies below fZPA. The system response to the missing mass is calculated by performing a static analysis for the applied load that equals the missing mass multiplied by the spectrum ZPA. As shown in Table 3, the results demonstrate significant contribution of the missing masses at the support nodes of the model.
Table 1. Modal Participation Mass Ratios of 15 Modes
Table 2. Modal Participation Mass Ratios of 78 Modes TABLE: Modal Participating Mass Ratios
OutputCase StepNum Period UX UY UZ SumUX SumUY SumUZ
Text Unitless Sec Unitless Unitless Unitless Unitless Unitless Unitless
MODAL 1 0.300382 0.000006682 0.02319 7.593E-08 0.000006682 0.02319 7.593E-08
MODAL 2 0.232902 0.02402 0.00002435 0.00001071 0.02403 0.02322 0.00001079
MODAL 3 0.167929 0.00138 2.47E-16 4.365E-19 0.02541 0.02322 0.00001079
MODAL 4 0.132733 0.000006866 3.589E-08 0.00262 0.02541 0.02322 0.00263
MODAL 5 0.11098 0.000001543 0.02876 0.00123 0.02541 0.05198 0.00386
MODAL 6 0.11034 1.034E-07 0.01131 0.00687 0.02541 0.06329 0.01072
MODAL 7 0.10596 0.000001309 0.1107 0.00285 0.02542 0.17398 0.01357
MODAL 8 0.099557 1.82E-08 0.00039 0.00048 0.02542 0.17437 0.01405
MODAL 9 0.095636 0.000002747 0.00478 0.00018 0.02542 0.17915 0.01423
MODAL 10 0.088374 1.327E-07 0.00003664 0.00245 0.02542 0.17919 0.01669
MODAL 11 0.078604 0.000007318 0.00052 0.00148 0.02543 0.17971 0.01817
MODAL 12 0.076804 0.00031 0.00027 0.00022 0.02573 0.17997 0.01839
MODAL 13 0.074985 0.00046 0.00137 0.00516 0.0262 0.18135 0.02355
MODAL 14 0.07165 0.00002706 0.01606 0.00031 0.02623 0.1974 0.02386
MODAL 15 0.069395 0.01297 0.00009013 0.00001809 0.0392 0.1975 0.02388
TABLE: Modal Participating Mass Ratios
OutputCase StepNum Period UX UY UZ SumUX SumUY SumUZ
Text Unitless Sec Unitless Unitless Unitless Unitless Unitless Unitless
MODAL 1 0.300382 0.000006682 0.02319 7.593E-08 0.000006682 0.02319 7.593E-08
MODAL 2 0.232902 0.02402 0.00002435 0.00001071 0.02403 0.02322 0.00001079
MODAL 3 0.167929 0.00138 2.47E-16 4.365E-19 0.02541 0.02322 0.00001079
MODAL 70 0.0314 0.00023 0.01288 3.05E-08 0.59864 0.69064 0.12916
MODAL 71 0.031354 0.00197 0.00001107 1.245E-08 0.6006 0.69065 0.12916
MODAL 72 0.031198 0.00681 0.00259 0.00417 0.60741 0.69324 0.13333
MODAL 73 0.031071 2.61E-08 0.00034 0.00449 0.60741 0.69358 0.13782
MODAL 74 0.031027 0.00435 0.00004731 0.00058 0.61176 0.69363 0.1384
MODAL 75 0.030942 2.515E-07 0.00032 1.93E-10 0.61176 0.69395 0.1384
MODAL 76 0.030895 0.0009 0.00002399 0.00049 0.61266 0.69397 0.13889
MODAL 77 0.030633 0.00003737 0.00414 0.00086 0.61269 0.69811 0.13976
Figure 2. Missing Mass Load Case in X Direction
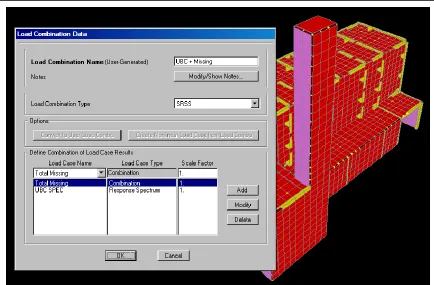
Figure 4. Corrected UBC Spectra Load Combination
Table 3: Comparative Results of Typical Support Reactions
TABLE: Joint Reactions
Joint OutputCase CaseType StepType F1 F2 F3 M1 M2 M3
Text Text Text Text KN KN KN KN-m KN-m KN-m
65 UBC SPEC LinRespSpec Max 0.454 7.005 4.213 0.5262 0.2139 0.0135
65 Total Missing Combination Max 9.15 15.394 25.777 1.0439 1.3282 0.1574 65 Total Missing Combination Min -9.15 -15.394 -25.777 -1.0439 -1.3282 -0.1574
65 UBC + Missing Combination Max 9.162 16.913 26.119 1.169 1.3453 0.158
65 UBC + Missing Combination Min -9.162 -16.913 -26.119 -1.169 -1.3453 -0.158
159 UBC SPEC LinRespSpec Max 0.507 6.928 2.272 0.5681 0.4358 0.0057
159 Total Missing Combination Max 7.906 13.894 28.983 0.826 7.0445 0.1183 159 Total Missing Combination Min -7.906 -13.894 -28.983 -0.826 -7.0445 -0.1183
159 UBC + Missing Combination Max 7.923 15.525 29.072 1.0025 7.058 0.1185
159 UBC + Missing Combination Min -7.923 -15.525 -29.072 -1.0025 -7.058 -0.1185
161 UBC SPEC LinRespSpec Max 1.006 9.391 5.444 0.7188 0.798 0.0123
161 Total Missing Combination Max 8.109 17.735 31.163 1.0539 3.9916 0.1443 161 Total Missing Combination Min -8.109 -17.735 -31.163 -1.0539 -3.9916 -0.1443
161 UBC + Missing Combination Max 8.171 20.068 31.635 1.2757 4.0706 0.1448
161 UBC + Missing Combination Min -8.171 -20.068 -31.635 -1.2757 -4.0706 -0.1448
163 UBC SPEC LinRespSpec Max 0.274 7.488 5.536 0.5867 0.3504 0.0013
163 Total Missing Combination Max 5.553 14.479 28.17 0.8483 2.013 0.0515 163 Total Missing Combination Min -5.553 -14.479 -28.17 -0.8483 -2.013 -0.0515
163 UBC + Missing Combination Max 5.56 16.3 28.709 1.0314 2.0433 0.0515
163 UBC + Missing Combination Min -5.56 -16.3 -28.709 -1.0314 -2.0433 -0.0515
172 UBC SPEC LinRespSpec Max 7.958 7.944 3.223 0.969 0.7114 0.0594
172 Total Missing Combination Max 20.778 17.957 42.984 4.7339 1.2863 0.051 172 Total Missing Combination Min -20.778 -17.957 -42.984 -4.7339 -1.2863 -0.051
172 UBC + Missing Combination Max 22.25 19.636 43.105 4.8321 1.4699 0.0783
CONCLUSIONS
The report describes the details of an application of the Missing Mass Method through an analysis of a typical radioactive building according to USNRC RG 1.92 (2002). It was modeled to calculate the participation mass ratio. As the cumulative mass ratio is well below 90% at 33 Hz (i.e. Zero Period Acceleration, ZPA), therefore, the missing mass is added in order to yield the “true” response of the structure. The Missing Mass Method constitutes the total effects of all system masses that are not included in the modes with frequencies below fZPA. This method is considered the acceptable method to account for the high-frequency modal contributions (f ≥ fZPA) and the effects of mass apportioned to system support points. Only modes that vibrate at frequencies below fZPA need to be included in the transient (periodic) mode superposition solution. The missing mass contribution, scaled to the instantaneous acceleration, is then algebraically summed with the transient solution at the corresponding time to obtain the total solution.
The structural analysis of typical radioactive building with Missing Mass Method demonstrates significant contribution of missing mass of high frequency modes at the supports (as highlighted in Table 3).
REFERENCES
Gupta, A.K.(1993). “Response Spectrum Method in Seismic Analysis and Design of Structures,” CRC Press, Inc.
Hadjian, A.H. (1981). “Seismic Response of Structures by the Response Spectrum Method,” Nuclear Engineering and Design, Vol. 66, no. 2, pp. 179-201.
Lindley, D.W., and Yow, T.R.(1980). “Modal Response Summation for Seismic Qualification,” Proceedings of the Second ASCE Conference on Civil Engineering and Nuclear Power, Vol. VI, Paper 8-2, Knoxville, TN
Moranto Richard et. al, (1998). “Evaluation of Modal Combination Methods for Seismic Response Spectrum Analysis” Paper ID K4-A4-US. BNL-NUREG-66410.
R.P. Kennedy (1984). “Position Paper on Response Combinations,” Report No. SMA 12211.02-R2-0, (Published in “Report of the U.S. Regulatory Commission Piping Review Committee: Evaluation of Other Dynamic Loads and Load Combinations,” NUREG-1061, Vol. 4)
S.L. Chu, M. Amin, and S. Singh. (1972). “Special Treatment of Actions of Three Earthquake Components on Structures” Nuclear Engineering and Design, Vol. 21, No. 1, pp. 126-136.
Uniform Building Code. (1997). Volume 1
USNRC RG 1.92. (1976). Combining Modal Responses and Spatial Components in Seismic Response Analysis.