DOI: 10.1534/genetics.107.081414
Few Mendelian Genes Underlie the Quantitative Response of a Forest
Tree,
Eucalyptus globulus, to a Natural Fungal Epidemic
Jules S. Freeman,
1Brad M. Potts and Rene´ E. Vaillancourt
School of Plant Science and Cooperative Research Centre for Forestry, University of Tasmania, Hobart, Tasmania 7001, Australia
Manuscript received August 31, 2007 Accepted for publication November 7, 2007
ABSTRACT
Foliar fungal pathogens from the genus Mycosphaerella affect eucalypts in natural forests and plantations worldwide. QTL analysis was conducted to dissect the genetic control of resistance in Euca-lyptus globulusto a natural infection by Mycosphaerella leaf disease, using a clonally replicated outbred F2 family (112 genotypes) planted in a field trial. Two major QTL, with high LOD support (20.2 and 10.9) and high genomewide significance, explained a large proportion (52%) of the phenotypic variance in the severity of damage byMycosphaerella cryptica, which may be indicative of oligogenic control. Both QTL were validated in a second F2family and one was validated in a third F2family. The mean values of different genotype classes at both major QTL argue for Mendelian inheritance with resistance dominant over susceptibility. There were strong correlations between the levels of Mycosphaerella damage in related genetic material planted in three widely separated locations in Tasmania. These findings together provide evidence that the genes controlling resistance to Mycosphaerella damage are stable in different genetic backgrounds and across different environments.
T
HE genus Eucalyptus (Myrtaceae) forms an in-tegral part of the Australian flora, including.800 species that dominate most forest types, from coastal to subalpine habitats (Williamsand Brooker1997).Eucalyptus globulus(sensuBrooker2000) is native to
south-eastern Australia, including Tasmania and the Bass Strait Islands (Williamsand Potts1996) where it is an
im-portant component of low-altitude forest ecosystems. Eucalypts are the major hardwood species grown in pulpwood plantations throughout the world (Cossalter
and Pye-Smith2003) andE. globulusis the main species
grown in temperate regions (Pottset al. 2004).
Foliar diseases, mostly caused by fungi, are common on eucalypts (Park et al. 2000). One of the most
prevalent is Mycosphaerella leaf disease (MLD), a foliar fungal disease affecting eucalypts in natural forests and plantations worldwide (Carnegieet al. 2001; Van Zyl
et al. 2002; Mohammedet al. 2003). Over 30 species of
Mycosphaerella have been detected on eucalypt leaves (Mohammedet al. 2003), of whichMycosphaerella cryptica
and M. nubilosa are the most common in southern Australia (Carnegie et al. 1998; Park et al. 2000).
M. crypticaappears to be a more generalized pathogen than M. nubilosa, as it infects both juvenile and adult foliage of many eucalypt species and is able to penetrate directly through the leaf cuticle. In contrast,M. nubilosa
is largely confined to juvenile leaves of a limited range of closely related eucalypt species and can penetrate the leaf only via stomatal pores (Parket al. 2000).
Mycos-phaerella leaf disease causes leaf necrosis and defolia-tion that can be highly detrimental to growth (Carnegie
and Ades2002; Milgateet al. 2005b). Crown damage
from MLD can range from,10% necrosis of leaves to extreme cases of complete defoliation and tree death. However, even relatively minor damage can cause a significant loss in growth (Carnegieand Ades 2002)
because the disease adversely affects photosynthesis beyond a simple reduction in photosynthetic area (Pinkardand Mohammed2006).
Mycosphaerella pathogens are hemibiotrophic fungi that must spend part of their life cycle living and reproducing on living plant tissue. These fungi infect foliage via wind-dispersed ascospores and/or splash-dispersed conidia (Park1988). Ascospore development
requires free water and is temperature dependent; con-sequently warm wet weather (i.e., summer rain) is con-ducive to disease epidemics (Park1988; Carnegieet al.
1994). Furthermore,E. globuluslike many eucalypt spe-cies is markedly heteroblastic and newly formed juvenile foliage is particularly susceptible to infection. As a result, significant leaf disease will occur only in areas where climatic conditions suitable for leaf infection, lesion development, and spore discharge coincide with the disease-prone stage of the host (Mohammedet al. 2003).
In contrast to native forests, where epidemics may be restricted by the variable age structure and diversity of
1Corresponding author:School of Plant Science, University of Tasmania,
Private Bag 55, Hobart, Tasmania 7001, Australia. E-mail: [email protected]
forest communities, eucalypt plantations are particu-larly susceptible to damage by MLD (Burgess and
Wingfield2002). This is especially notable in
planta-tions on sites outside the normal range of the species, suggesting that MLD may influence the ecological niches of different eucalypt species and the suitability of different species for plantation development in certain areas. For example, in the northwest of Tasma-nia (a center for the expanding plantation industry on the island), E. globulus plantations have suffered re-peatedly from outbreaks of MLD, prompting the forest industry to favor planting E. nitens in this area (Mohammedet al. 2003). Severe outbreaks of MLD have
also affected eucalypt plantations outside Australia, in countries such as New Zealand, Chile, and South Africa; MLD was one of the factors that prevented the devel-opment of a commercial plantation industry for E. globulusin South Africa (Parket al. 2000). Although
coevolution of eucalypts with their foliar parasites ap-pears to maintain a balance between the hosts and their parasites in many native forests, the disturbance of natural forest communities can also promote disease epidemics (Parket al. 2000).
While the genetic control of disease resistance in crop plants has received considerable attention, relatively little is known about the inheritance of disease resis-tance in forest trees. In these long-lived organisms most of the existing knowledge comes from QTL studies of diseases such as rust in pines (Cronartium sp.; e.g., Deveyet al. 1995; Liet al. 2006) and poplar
(Melamp-sora sp.;e.g., Cervera et al. 1996; Lefe` vre et al. 1998;
Dowkiw and Bastien 2004; Jorge et al. 2005) and
chestnut blight (Cryphonectria sp.;e.g., Kubisiaket al.
1997). In comparison, very few studies have addressed the issue of disease resistance in Eucalyptus and most have used a quantitative genetic approach (e.g., Carnegie
et al. 1994; Dungeyet al. 1997; Carnegieand Ades2002;
Milgateet al. 2005b). However, in the case ofE. grandis,
bulked segregation analysis has allowed the identifi-cation of a major gene influencing resistance to rust (Puccinia psidii; Junghanset al. 2003).
Quantitative genetic studies have reported genetic variation in the susceptibility ofE. globulusto MLD, both within and between provenances (Carnegieet al. 1994;
Dungeyet al. 1997; Milgateet al. 2005a,b) as well as
within segregating families (Milgate et al. 2005a).
There is some evidence for a positive correlation be-tween resistance to the disease and rainfall, consistent with more intense natural selection for disease re-sistance in high-rainfall areas (Carnegie et al. 1994;
Dungey et al. 1997). In terms of genetic variability
within the pathogen, in general, a broad range of host adaptation as evident inM. crypticawould suggest a lack of specialization in response to host species or resistance (Milgroomand Peever2003). However, Milgateet al.
(2005a) provided evidence for a close association be-tween host and pathogen, finding specialization in the
occurrence of two different biotypes of M. cryptica between resistant and susceptibleE. globulusindividuals. Specifically, RAPD analysis showed that 18 M. cryptica genotypes clustered into two biotypes, one of which was more frequent on resistant trees, whereas the other was more frequent on susceptible trees (Milgateet al. 2005a).
The genetic control of resistance to MLD remains poorly understood and consequently intraspecific variabil-ity in resistance has yet to be exploited at an operational level, either in breeding or in deployment programs. A thorough understanding of MLD resistance inE. globulus is necessary for effective management of the disease. This requires a detailed understanding of the genetic variation within both the host and the pathogens and the genetic control of the host–pathogen interactions (Keaneet al. 2000; Burdon2001).
Quantitative trait loci (QTL) analysis has been the main approach used to obtain insights into the number and location of loci affecting quantitative traits in forest trees (Sewelland Neale2000). The moderate to high
heritability previously reported for MLD inE. globulus (Dungey et al. 1997; Milgate et al. 2005b) suggests
there are good prospects for finding QTL influencing MLD resistance. Such information would be a signifi-cant step toward understanding the inheritance of resistance to MLD inE. globulusand would be relevant to disease management in both breeding populations and natural forests. This study aims to determine the number and location of QTL underlying the variation in MLD resistance of E. globulus, using a clonally replicated F2family. The QTL were validated in
differ-ent F2families and the stability of resistance was assessed
in different environments.
MATERIALS AND METHODS
Genetic material, trial design, and disease assessment:To study genetic variation in E. globulussusceptibility to MLD, three large outcross F2families (families 1–3) were generated, with grandparents originating from King Island (KI) in Bass Strait and Taranna (T) in the southeast of Tasmania (Figure 1). Family 1 (T7/KI157//T144/KI5) was used to construct a linkage map and perform QTL analysis, while the two other controlled-cross families½families 2 (T7/KI157//KI5/KI157) and 3 (KI2/KI161//KI5/KI157)were used for QTL valida-tion. The F2families were designed to have varying levels of resistance to MLD. Family 1 was constructed from crossing unrelated F1’s each derived from grandparents predicted by Dungeyet al. (1997) to have highly divergent breeding values
individuals representing a single genotype having low disease severity solely due to disease escape, as opposed to genetically governed resistance.
The three controlled-cross families were planted in a field trial at Woolnorth in northwest Tasmania (Figure 1) in May 1998, as part of an experiment also containing open-pollinated families collected from four of the grandparents (KI2, KI5, T7, T5; see Milgateet al. 2005a for a full description of the
trial design). The trial featured an incomplete block design, consisting of two replicates, each with 20 incomplete blocks of 30 or 36 trees. The ortet and the ramet of each cloned ge-notype were assigned to separate replicates at random. The same and closely related genetic material was planted at two other sites in Tasmania, Weilangta in the southeast and Ridgley in the central north of the state (Figure 1), which allowed us to assess the environmental stability of MLD resistance. The genetic material planted at Ridgley in 1990 comprised an (inter- and intraprovenance) F1factorial mating design with parents from King Island and Taranna (see Dungeyet al. 1997
for a full description of the trial design). The F2families grown at Woolnorth and Weilangta were derived from crossing between the F1families grown at Ridgley. The Weilangta field trial was planted in 1999 and also contained 14 open-pollinated families, including 7 families from King Island and 7 from Taranna, 6 of which were derived from the grand-parents of the F2families (1–3), in addition to the same F2 families as planted at Woolnorth. Each family contained be-tween 18 and 56 trees at the time of disease assessment. All families were planted in a randomized single-tree plot, in 20–51 replicates.
All field trials became naturally infected with MLD ½M. crypticaat Woolnorth, identified by Milgateet al. (2005a),
and bothM. crypticaandM. nubilosaat Ridgley (Carnegieand
Ades 2002) and possibly also at Weilangta (Pinkard and
Mohammed2006) ,1 year after planting. Both species of
Mycosphaerella are capable of causing severe damage in isolation (Milgate et al. 2005a,b), although they often
co-occur in diseased trees. When they coco-occur, such as at Ridgley, it is not feasible to separately assess the damage by each
path-ogen species; hence following previous studies (Carnegie
et al. 1994; Dungeyet al. 1997) only total disease severity was
assessed. Disease severity was recorded after 12 months at Woolnorth, 15 months at Weilangta, and 18 months at Ridgley. Disease severity (myco) was quantified by estimating the per-centage area of necrotic lesions present on each tree, on a 10-point scale (see Milgateet al. 2005a).
Analysis: The myco trait values used for QTL analysis in family 1 were least-square means calculated for each of the 112 genotypes with map information, by fitting to the logn -trans-formed data a mixed model including the effects of replicate (fixed), genotype (fixed), incomplete block within replicate (random), and random error. All families in the field trial were included and analysis was undertaken with PROC MIXED of SAS V9.1 (SAS Institute, Cary, NC). The distribution of genotype least-square means was examined for myco(by the Kolmogorov–Smirnov test using PROC UNIVARIATE of SAS), to test the assumption of a normal distribution for interval and multiple-QTL model (MQM) mapping. Even with trans-formation, the distribution of least-squares means departed from normality (P,0.01).
In the case of the analysis examining the stability of sus-ceptibility to MLD across different environments, Pearson’s correlation coefficients were calculated between the parental breeding values and the myco least-square means in open-pollinated and controlled-cross families grown at Woolnorth and Weilangta. The least-square means for the Woolnorth families were calculated by fitting a mixed model with replicate and families as fixed effects and incomplete blocks as random effects. In the case of Weilangta, replicate was treated as random and family as a fixed effect. Breeding values were from Dungeyet al.’s (1997) analysis of a factorial mating design at
Ridgley and the performance of the three F2 families was predicted assuming complete additivity.
QTL analysis was conducted with MAPQTL 4.0 (Van
Ooijen et al. 2002), using the consensus linkage map
con-structed in family 1 (described in detail in Freeman et al.
2006). Putative QTL were declared at two different levels, significant (genomewide type I error,0.05) and suggestive (chromosomewide type I error rate,0.05). A relaxed type I error rate (i.e., presenting QTL at the suggestive level) was adopted to facilitate comparative QTL mapping (Beavis1998;
Van Ooijen 1999). Comparative QTL mapping will be
particularly useful in a genus such as Eucalyptus, in which QTL mapping is in its infancy. The inclusion of numerous transferable microsatellite markers in the linkage map used for QTL analysis in this study (Freemanet al. 2006) will
facil-itate comparative mapping. The LOD threshold for genome-wide significance was determined by permutation testing (1000 replications; Churchilland Doerge1994). An average
chromosomewide LOD threshold (LOD 3) for suggestive QTL was determined by empirical simulations (VanOoijen
1999). Interval mapping was initially performed to scan the genome for map intervals significantly associated withmyco, using the default parameters of MAPQTL 4.0 (VanOoijen
et al. 2002). The suggestive threshold was used to select pu-tative QTL as cofactors for the MQM procedure. Where map intervals exceeding this threshold existed, a single marker closest to the peak LOD was chosen as a cofactor for the MQM ( Jansen1993, 1994; Jansenand Stam1994). MQM mapping
removes the residual variance attributable to the selected cofactors, thereby increasing the power in subsequent scans for multiple QTL. An iterative approach combining forward and backward selection of cofactors was used for QTL de-tection, as suggested by VanOoijenet al. (2002). All methods
of QTL discovery have their biases, so a combination of ap-proaches can increase confidence in the detection of putative QTL (Kearseyand Farquhar 1998; Asins 2002). Because
Figure1.—Map of Tasmania, showing the provenances of
myco distribution departed from normality, single-marker Kruskal–Wallis tests were also used for QTL detection. Where the closest marker to the QTL peak segregated from the opposite parent, the significance of the closest marker segregating from the same parent as the QTL was tested. This analytical method is robust to departures from normality (Van
Ooijenet al. 2002). Where more than one unlinked marker
significantly affectedmyco(genomewide type I error,0.05 in interval mapping), they were tested for epistasis by testing for an interaction effect using PROC GLM of SAS.
Validation of the two major putative QTL for MLD severity was attempted in two other F2 families (families 2 and 3, described above), using a selective genotyping strategy. Al-though each of the F2families was interrelated (see above), in each case where they shared grandparents, a different in-dividual of the F1generation was used for crossing. Themyco scores were logntransformed to optimize residual normality and least-square means were calculated from two clones of each genotype, as described above for family 1. The extremes in genotype least-square means (25 and 20 genotypes from each extreme in families 2 and 3, respectively) were assayed using the closest polymorphic SSR marker(s) to each of the putative QTL. A putative QTL was considered validated if the marker genotypes significantly affected MLD severity (P , 0.05) in a Kruskal–Wallis test. The Kruskal–Wallis test allowed an assessment of the effects of different allelic combinations on the mean trait value, for the major QTL in each F2family.
RESULTS
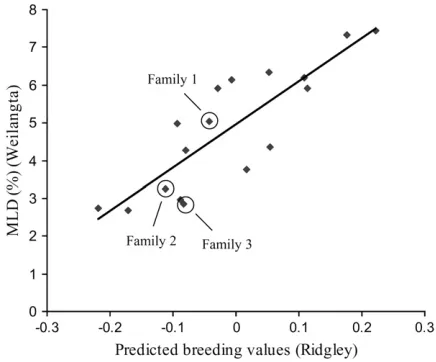
The frequency distribution of myco phenotypes at Woolnorth departed significantly from normality in each family (Figure 2). Each family exhibited a right-skewed distribution (i.e., skewed toward resistance), which may reflect some plants escaping the disease. However, escapees must have been a minority, since the effects of both replicate (P ¼ 0.16) and incomplete block (P ¼ 0.26) were not significant, suggesting in-fection was uniform across the field trial. Furthermore, the within-family clonal repeatability was high (H2 ¼ 0.59 across all families), indicating a genetic basis to variation in disease severity. Family 1 exhibited the greatest variance followed by family 2 and then family 3, consistent with the proportion of King Island and Taranna in the pedigrees of each family. Disease severity was strongly positively correlated in the same families planted at Woolnorth and Weilangta (d.f.¼6,r¼0.98, P¼0.0001). Furthermore, breeding values calculated from the field trial at Ridgley by Dungeyet al. (1997)
provided a good prediction of the disease severity in families planted at Woolnorth (d.f.¼6,r¼0.95,P ¼
0.001) and Weilangta (d.f.¼16,r¼0.81,P,0.0001; Figure 3).
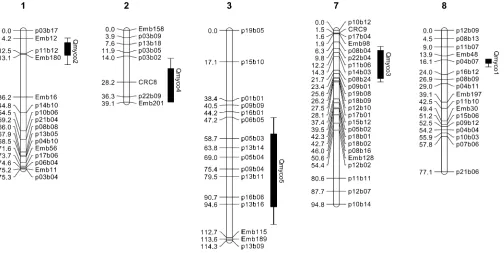
Three putative QTL with significant (genomewide type I error,0.05) effect onmycowere located by MQM analysis on linkage groups 1, 7, and 8 (Qmyco2, Qmyco3, and Qmyco1, respectively; Table 1; Figure 4). The two most significant of these (Qmyco1 and Qmyco2) also exceeded the genomewide significance threshold from interval mapping and were confirmed by single-marker Kruskal–Wallis tests. Two additional putative QTL
re-gions were located at the suggestive level (chromosome-wide type I error ,0.05), on linkage groups 2 and 3 (Qmyco4 and Qmyco5, LOD 4.0 and 3.5, respectively; Table 1). The closest markers to four of the five putative QTL were AFLPs, and for the remaining QTL it was a microsatellite (CRC8). Importantly, the two most signif-icant QTL regions were located close to microsatellite markers. For example, while Qmyco1 peaked (LOD 20.2) closest to AFLP marker p04b07, it was very close to microsatellite marker Emb48 (Figure 4). Similarly, Qmyco2 peaked (LOD 10.9) closest to AFLP marker p11b12, but was closely flanked by microsatellites Emb12 and Emb180 (Figure 4).
In combination, the two major putative QTL ex-plained 51.7% of the phenotypic variance (i.e., the variation in genotype least-square means) in myco. All putative QTL formycodamage segregated on the female side, except Qmyco5 (Table 1). The interaction between the two major QTL was nonsignificant (F¼0.20;P ¼
Figure 2.—Frequency distributions for the severity of
0.9), suggesting that there is no epistasis between them. Assuming strictly additive effects, the presence of the positive alleles at both of the major QTL in family 1 (the a allele for Emb12 and thef allele for Emb48) would lead to 7.4% less damage (myco), compared to the nega-tive alleles (theballele for Emb12 and thee allele for Emb48; Table 2).
The use of transferable microsatellite markers al-lowed validation of the two major QTL formycoin two independent families. Both of the major QTL for the severity ofM. crypticadamage (myco) were validated in family 2 ½Qmyco2 (Emb12, P , 0.01) and Qmyco1 (Emb48,P,0.05)by the Kruskal–Wallis test (Table 2). The QTL on linkage group 1 (Qmyco2) was also vali-dated in family 3 (Emb180,P,0.005; Table 2). Assum-ing resistance is dominant and a sAssum-ingle Mendelian gene
controls each QTL, both families 1 and 2 appeared to inherit the alleles for resistance at each QTL from only one heterozygous parent, resulting in segregation of two resistant genotypes to two susceptible ones. In contrast, both parents in family 3 appeared to be heterozygous for resistance at Qmyco2 (Table 2), resulting in segre-gation of three resistant genotypes to one susceptible.
DISCUSSION
This study is the first report of QTL affecting disease resistance inE. globulusand is the second such report for a eucalypt species. Two major QTL regions have been detected for M. cryptica severity (myco), both of which explain a large proportion of the phenotypic variance. Contrary to predictions from an infinitesimal (or poly-genic) model, QTL studies of numerous traits (exclud-ing growth) in forest trees have often suggested oligogenic or major gene control, with a few major genes re-sponsible for much of the total phenotypic variability (reviewed by Sewell and Neale2000). However, the
common finding of oligogenic control must be inter-preted with caution in light of the fact that the power of QTL detection is influenced by numerous factors in-cluding the sample size, the magnitude of the QTL effect, and the heritability of the trait (Beavis 1998;
Kearsey and Farquhar 1998; Erickson et al. 2004).
Furthermore, only loci that are heterozygous with a de-tectable effect in the crosses and environments studied will be discovered (Marqueset al. 2002). In
combina-tion, these factors can result in an oversimplified view of the genetic control of quantitative traits, by under-estimating the number of QTL affecting a trait and overestimating their phenotypic effects.
Nonetheless, oligogenic control is the most likely hypothesis to explain the discovery of just two major QTL for resistance to myco. These explained a large proportion of the phenotypic variance in family 1 and were also significant in at least one other
controlled-Figure 3.—Scatter plot of observed Mycosphaerella leaf
disease (MLD %) in open-pollinated and controlled-cross families of Eucalyptus globulus at Weilangta, vs. predicted breeding values for MLD damage from related genetic mate-rial at Ridgley. Breeding values are centered on a population mean of zero. The three controlled-cross F2families are circled.
TABLE 1
Putative QTL for the severity of foliar damage caused byMycosphaerella crypticainEucalyptus globulus
family 1, identified by MQM mapping and single-marker Kruskal–Wallis tests
QTL
Linkage
group Segregationa
Adjacent marker
Map position
(cM) LODb
% expd
Kruskal– WallisP
Qmyco2 1 F p11b12 12.5 10.9*** 15.4 ***
Qmyco4 2 F CRC8 28.2 4.0c 5.8 *
Qmyco5 3 M p09b04 75.4 3.5c 6.2
Qmyco3 7 F p08b24 21.7 6.0* 9.0
Qmyco1 8 F p04b07 16.1 20.2*** 36.3 ***
a
The parent from which the QTL effect segregates: M, male; F, female.
bPeak LOD score for each QTL. Genomewide significance (
P) is indicated by *P,0.05, **P,0.01, and ***P,0.001.
cSuggestive QTL based on a chromosomewide significance
P,0.05.
cross family. This hypothesis is consistent with the moderate to high heritability previously reported for damage from MLD within E. globulus (narrow-sense heritability¼0.12–0.60; Dungey et al. 1997; Milgate
et al. 2005b). However, the possibility that the regions with QTL of large effect represent clusters of closely
linked genes cannot be dismissed since resistance genes are commonly clustered in plants (Wanget al. 2001;
Chu et al. 2004; Mondragon-Palomino and Gaut
2005). Due to the lack of QTL studies for disease resistance in Eucalyptus, comparative mapping is not possible. However, Junghanset al. (2003) reported that
Figure4.—The location of each putative QTL forMycosphaerella crypticaresistance ofEucalyptus globulusexceeding the
chro-mosomewide significance level from MQM mapping. Linkage groups and loci are as described by Freemanet al. (2006) with
microsatellite markers named starting with Emb or CRC. Solid bars and lines represent 1- and 2-LOD support intervals, respec-tively. The 2-LOD support interval corresponds to an95% confidence interval (Landerand Botstein1989).
TABLE 2
Genotype means for fully informative microsatellite markers adjacent to the major QTL for severity ofMycosphaerella cryptica
damage in each F2family ofEucalyptus globulus
Family LGa QTL Markerb
Parental
genotypesc Genotype means (% damage) Family means (%)
1 1 Qmyco2 Emb12*** ab3cd ac ad bc bd 4.7
(rs) (ss) (rs) (rs) (ss) (ss)
4.4 3.1 5.9 7.6
8 Qmyco1 Emb48*** ef3eg ee ef eg fg
(sr) (ss) (ss) (sr) (ss) (rs)
6.7 2.7 8.7 3.9
2 1 Qmyco2 Emb12** ab3cd ac ad bc bd 2.5
(ss) (rs) (sr) (ss) (sr) (ss)
1.9 5.9 2.6 5.4
8 Qmyco1 Emb48* ab3cd ac ad bc bd
(sr) (ss) (ss) (ss) (rs) (rs)
5.3 3.9 2.3 1.8
3 1 Qmyco2 Emb180** ef3eg ee ef eg fg 1.9
(rs) (rs) (rr) (rs) (rs) (ss)
2.3 1.9 1.7 3.8
a
Linkage group.
b
Kruskal–Wallis significance levels *P,0.05, **P,0.01, and ***P,0.001.
cHypothesized genotypes are in parentheses, where
one major gene controlled a large proportion of the phenotypic variation for rust resistance in E. grandis, which appeared to display Mendelian inheritance. In other forest trees, QTL studies have commonly found that few genomic regions explain a large proportion of the phenotypic variation in disease resistance. For exam-ple, one or two major QTL explained most of the variance in resistance to rust in poplar (Newcombeet al.
1996; Lefe` vreet al. 1998; Dowkiwand Bastien2004;
Jorgeet al. 2005) and pines (Deveyet al. 1995). Similar
results have also been found in QTL studies investigating quantitative disease resistance in crop plants (reviewed by Young1996). Hence, the control of quantitative disease
resistance by one or two major loci, in combination with a few minor ancillary loci, appears representative of many pathosystems.
The suggestion of oligogenic control is consistent with specialized associations that may exist between hemibiotrophic pathogens such as Mycosphaerella and their host. Biotrophic and hemibiotrophic pathogens invade living cells and subvert metabolism to favor their growth and reproduction; hence minor differences in either organism can upset the balance (Hammond
-Kosack and Jones 1997). The genetics of host
resis-tance and pathogen virulence in biotrophic pathogens often fit the classic gene-for-gene model (Flor1971),
whereby, due to coevolution of host and parasite, com-plementary pairs of dominant genes in both the path-ogen and the host govern resistance. This model may apply to the control of resistance to M. cryptica in E. globulus. In support of this hypothesis, the specializa-tion of different biotypes ofM. cryptica on resistantvs. susceptible trees in the same trial and the same disease epidemic as this study (Milgateet al. 2005a) suggests a
degree of specificity in the resistance ofE. globulustoM. cryptica, similar to loci for rust resistance in poplar (Taboret al. 2000; Dowkiw and Bastien 2004) and
pine (Wilcoxet al. 1996).
The genotype means for both of our major QTL fit a model of Mendelian inheritance in each family with resistance dominant over susceptibility (Table 2). This fits the gene-for-gene model and observations in other forest trees (e.g., Devey et al. 1995; Junghans et al.
2003). The differences in mean level of resistance of families in the present study (Table 2) are consistent with one QTL segregating in family 3 (assuming it is fixed for the resistant allele at Qmyco1), two in family 2, and two, plus minor QTL, segregating in family 1. This model also accords with the increasing variability within these families (Figure 2). The higher resistance of fam-ily 3 is likely to reflect its pedigree of solely King Island grandparents, since trees from King Island are generally more resistant than those from Taranna (Dungeyet al.
1997).
The specificity of QTL or genes for disease resistance in their interaction with different races of a pathogen has implications for their durability. The literature
abounds with examples from crop plants (e.g., Cowger
et al. 2000; Talukderet al. 2004) and forest trees such as
poplar (e.g., Pinon1995; Freyet al. 2005) of breeding
programs concentrating on selection for major genes controlling qualitative race-specific resistance, only for the pathogen to evolve new virulent types, resulting in the resistance being overcome. However, although the genetic basis of durable resistance is not fully under-stood, it is believed that durable host resistance is often conferred by minor genes (Newcombe 1998). Hence
durable resistance may be achieved from a combination of major ‘‘pivotal genes’’ and ancillary genes or QTL of lesser effect (Newcombe 1998), as is evident in this
study. The low amount of genetic variability and prev-alence of asexual reproduction evident in a preliminary study of the pathogenM. cryptica(Milgateet al. 2005a)
also bode well for the durability of resistance. A greater understanding of the potential durability of the QTL for resistance to M. cryptica identified herein will require testing against multiple races and/or species of MLD and more knowledge regarding the genetic variability and adaptive potential of the pathogen.
A limitation of QTL analysis is that the QTL are often specific to the pedigree, the environment, and the devel-opmental stage in which they are found. This is par-ticularly true in forest trees as opposed to crop plants, due to their longevity, genetic heterogeneity, and the variety of sites in which they are grown (Grattapaglia
2000; Sewelland Neale2000). However, in this study,
the validation of the major QTL forM. crypticaresistance is promising, suggesting the QTL may affect disease severity in trees with a range of genetic backgrounds. QTL regions influencing disease resistance in several different pedigrees have also been demonstrated in forest trees such as E. grandis( Junghans et al. 2003)
and hybrid Populus (Lefe` vreet al. 1998). The results
of this study are also promising in terms of the environ-mental stability of MLD resistance. Strong intercorre-lations were observed across three widely separated locations (Figure 1). Furthermore, these correlations were between predicted breeding values (from Ridgley) and observed disease severity in different but related genetic material (grown at Woolnorth and Weilangta). Hence, these findings suggest that the genetic control of disease resistance may be stable in different environments and also provide further evidence for stability of the genetic control of resistance in different genetic backgrounds. Environmental stability of MLD resistance has also been previously suggested between families from a single provenance (Reinoso1992). While the direct
applica-tion of QTL for marker-assisted selecapplica-tion in forest trees is limited (Strauss et al. 1992; Henery et al. 2007),
quanti-tative genetic studies that there is ample scope to breed for increased disease resistance. Importantly, the fact that resistance appears to be dominant at both major QTL suggests the level of resistance could easily be improved in breeding programs by conventional selec-tion of elite genotypes following disease outbreaks. Furthermore, the apparent stability of resistance in dif-ferent environments and genetic backgrounds increases the value of resistant genotypes.
In summary, this is the first study to report QTL influencing the severity of damage by M. cryptica in Eucalyptus and the second report of loci influencing disease resistance in the genus. The discovery, and inde-pendent validation, of two major QTL explaining a large proportion of the phenotypic variance in M. crypticaseverity may be indicative of oligogenic con-trol for the severity of damage byM. cryptica. The severity of damage in different genotype classes at each major QTL is consistent with Mendelian control, with resis-tance dominant. The validation of both of the major QTL for the severity of damage byM. crypticain at least one independent pedigree and the demonstration that disease expression is stable across different environ-ments add substantially to the findings of this study by suggesting the QTL may be influential beyond the mapping population. Furthermore, the presence of microsatellites close to the major QTL will allow them to be tested more widely, in different pedigrees of E. globulusand other eucalypt species.
We thank Kelsey Joyce and Gunns Ltd. for access to the field trials and assistance with their establishment; Andrew Milgate and Paul Tilyard for data collection; and Adam Smolenski, Rebecca Jones, Dorothy Steane, Merv Shepherd, and Haobing Li for their help in the laboratory or with analysis. We also acknowledge financial support from the Australian Research Council (project DP0773686).
LITERATURE CITED
Asins, M. J., 2002 Present and future of quantitative trait locus
anal-ysis in plant breeding. Plant Breed.121:281–291.
Beavis, W. D., 1998 QTL analysis: power, precision, and accuracy,
pp. 145–162 in Molecular Dissection of Complex Traits, edited by H. A. Patterson. CRC Press, Boca Raton, FL.
Brooker, M. I. H., 2000 A new classification of the genus Eucalyptus
L’Her. (Myrtaceae). Aust. Syst. Bot.13:79–148.
Burdon, R. D., 2001 Genetic diversity and disease resistance: some
considerations for research, breeding, and deployment. Can. J. For. Res.31:596–606.
Burgess, T., and M. J. Wingfield, 2002 Impact of fungal pathogens
in natural forest ecosystems: a focus on Eucalyptus, pp. 285–306 inMicroorganisms in Plant Conservation and Biodiversity, edited by K. Sivasithamparam, K. W. Dixonand R. L. Barrett. Kluwer
Academic Publishers, The Netherlands.
Carnegie, A. J., and P. K. Ades, 2002 Mycosphaerella leaf disease
reduces growth of plantation-grown Eucalyptus globulus. Aust. For.66:113–119.
Carnegie, A. J., P. J. Keane, P. K. Ades and I. W. Smith,
1994 Variation in susceptibility ofEucalyptus globulusprovenances to Mycosphaerella leaf disease. Can. J. For. Res.24:1751–1757. Carnegie, A. J., P. K. Ades, P. J. Keane and I. W. Smith,
1998 Mycosphaerella diseases of juvenile foliage in a eucalypt species and provenance trial in Victoria, Australia. Aust. For.
61:190–194.
Carnegie, A. J., P. K. Adesand R. Ford, 2001 The use of RAPD-PCR
analysis for the differentiation of Mycosphaerella species from Eucalyptus in Australia. Mycol. Res.105:1313–1320.
Cervera, M. T., J. Gusmao, M. Steenackers, J. Peleman, V. Storme et al., 1996 Identification of AFLP markers for resistance against
Melampsora larici-populinain Populus. Theor. Appl. Genet. 93:
733–737.
Chu, Z., Y. Ouyang, J. Zhang, H. Yangand S. Wang, 2004
Genome-wide analysis of defense-responsive genes in bacterial blight resis-tance of rice mediated by the recessive R genexa13. Mol. Genet. Genomics271:111–120.
Churchill, G. A., and R. W. Doerge, 1994 Empirical threshold
values for quantitative trait mapping. Genetics138:963–971. Cossalter, C., and C. Pye-Smith, 2003 Fast Wood Forestry: Myths and
Realities. Center for International Forestry Research, Jakarta, Indonesia.
Cowger, C., M. E. Hofferand C. C. Mundt, 2000 Specific
adapta-tion byMycosphaerella graminicolato a resistant wheat cultivar. Plant Pathol.49:445–451.
Devey, M. E., A. Delfino-Mix, B. B. Kinloch and D. B. Neale,
1995 Random amplified polymorphic DNA markers tightly linked to a gene for resistance to white pine blister rust in sugar pine. Proc. Natl. Acad. Sci. USA92:2066–2070.
Dowkiw, A., and C. Bastien, 2004 Characterization of two major
genetic factors controlling quantitative resistance toMelampsora larici-populinaleaf rust in hybrid poplars: strain specificity, field expression, combined effects, and relationship with a defeated qualitative resistance gene. Phytopathology94:1358–1367. Dungey, H. S., B. M. Potts, A. J. Carnegie and P. K. Ades,
1997 Mycosphaerella leaf disease: genetic variation in damage toEucalyptus nitens,Eucalyptus globulus, and their F1hybrid. Can.
J. For. Res.27:750–759.
Erickson, D. L., C. B. Fenster, H. K. Stenøien and D. Price,
2004 Quantitative trait locus analyses and the study of evolu-tionary processes. Mol. Ecol.13:2505–2522.
Flor, H. H., 1971 Current status of the gene-for-gene concept.
Annu. Rev. Phytopathol.9:275–296.
Freeman, J. S., B. M. Potts, M. Shepherdand R. E. Vaillancourt,
2006 Parental and consensus linkage maps ofEucalyptus globu-lususing AFLP and microsatellite markers. Silvae Genet.55:4–5. Frey, P., P. Ge´rard, N. Feau, C. Hussonand J. Pinon, 2005 Variability
and population biology of Melampsora rusts on poplars, pp. 63– 72 inRust Diseases of Willow and Poplar, edited by M. H. Peiand
A. R. McCracken. CAB International, Wallingford, UK.
Grattapaglia, D., 2000 Molecular breeding of Eucalyptus, pp.
451–474 in Molecular Biology of Woody Plants, Vol. 1, edited by S. M. Jain and S. C. Minocha. Kluwer Academic Publishers,
The Netherlands.
Hammond-Kosack, K. E., and J. D. G. Jones, 1997 Plant disease
resis-tance genes. Annu. Rev. Plant Physiol. Plant Mol. Biol.48:575–607. Henery, M. L., G. F. Moran, I. R. Wallis and W. J. Foley,
2007 Identification of quantitative trait loci influencing foliar concentrations of terpenes and formylated phloroglucinol com-pounds inEucalyptus nitens. New Phytol.176:82–95.
Jansen, R. C., 1993 Interval mapping of multiple quantitative trait
loci. Genetics135:205–211.
Jansen, R. C., 1994 Controlling the type I and type II errors in
map-ping quantitative trait loci. Genetics138:871–881.
Jansen, R. C., and P. Stam, 1994 High resolution of quantitative
traits into multiple loci via interval mapping. Genetics 136:
1447–1455.
Jorge, V., A. Dowkiw, P. Faivre-Rampant and C. Bastien,
2005 Genetic architecture of qualitative and quantitative
Melampsora larici-populinaleaf rust resistance in hybrid poplar: genetic mapping and QTL detection. New Phytol.167:113–127. Junghans, D. T., A. C. Alfenas, S. H. Brommonschenkel, S. Oda, E.
J. Melloet al., 2003 Resistance to rust (Puccinia psidiiWinter)
in Eucalyptus: mode of inheritance and mapping of a major gene with RAPD markers. Theor. Appl. Genet.108:175–180. Keane, P. J., G. A. Kile, F. D. Podgerand B. N. Brown, 2000 Diseases
and Pathogens of Eucalypts. CSIRO, Melbourne.
Kearsey, M. J., and A. G. L. Farquhar, 1998 QTL analysis in plants;
Where are we now? Heredity80:137–142.
interspecific cross in the genus Castanea. Phytopathology 87:
751–759.
Lander, E. S., and D. Botstein, 1989 Mapping Mendelian factors
underlying quantitative traits using RFLP linkage maps. Genetics
121:185–199.
Lefe` vre, F., M. C. Goue´-Mourier, P. Faivre-Rampantand M. Villar,
1998 A single resistance gene cluster controls incompatibility and partial resistance to variousMelampsora larici-populinaraces in hybrid poplar. Phytopathology88:156–163.
Li, H., H. Amersonand B. Li, 2006 Genetic models of host-pathogen
gene interactions based on inoculation of loblolly pine seedlings with the fusiform rust fungus. New For.31:245–252.
Marques, C. M., R. P. V. Brondani, D. Grattapagliaand R. Sederoff,
2002 Conservation and synteny of SSR loci and QTLs for vegeta-tive propagation in four Eucalyptus species. Theor. Appl. Genet.
105:474–478.
Milgate, A. W., R. E. Vaillancourt, C. Mohammed, M. Powelland
B. M. Potts, 2005a Genetic structure of aMycosphaerella cryptica
population. Aust. Plant Pathol.34:345–354.
Milgate, A. W., B. M. Potts, K. Joyce, C. Mohammed and R. E.
Vaillancourt, 2005b Genetic variation inEucalyptus globulus
for susceptibility toMycosphaerella nubilosaand its association with tree growth. Aust. Plant Pathol.34:11–18.
Milgroom, M. G., and T. L Peever, 2003 Population biology of
plant pathogens. Plant Dis.87:608–617.
Mohammed, C., T. Wardlaw, A. Smith, E. Pinkard, M. Battaglia et al., 2003 Mycosphaerella leaf diseases of temperate eucalypts around the Southern Pacific Rim. NZ J. For. Sci.33:362–372. Mondragon-Palomino, M., and B. S. Gaut, 2005 Gene conversion
and the evolution of three leucine-rich repeat gene families in
Aribopsis thaliana. Mol. Biol. Evol.22:2444–2456.
Newcombe, G., 1998 Association ofMmd1, a major gene for
resis-tance toMelampsora medusaef.sp.deltoidae,with quantitative traits in poplar rust. Phytopathology88:114–121.
Newcombe, G., H. D. Bradshaw, G. A. Chastagner and R. F.
Stettler, 1996 A major gene for resistance to Melampsora medusaef.sp.deltoidaein a hybrid poplar pedigree. Phytopathology
86:87–94.
Park, R. F., 1988 Effect of certain host, inoculum, and
environmen-tal factors on infection by two Mycosphaerella species. Trans. Br. Mycol. Soc.90:221–228.
Park, R. F., P. J. Keane, M. J. Wingfield and P. W. Crous,
2000 Fungal diseases of Eucalyptus foliage, pp. 153–240 in Dis-eases and Pathogens of Eucalypts, edited by P. J. Keane, G. K. Kile,
F. D. Podgerand B. N. Brown. CSIRO, Melbourne.
Pinkard, E. A., and C. L. Mohammed, 2006 Photosynthesis of Euca-lyptus globulusLabill. with Mycosphaerella leaf disease. New Phy-tol.170:119–127.
Pinon, J., 1995 Variability in poplar rusts and evolution of their
pop-ulations. Consequences for control strategies. C. R. Seances Acad. Agric. Fr.81:99–109.
Potts, B. M., R. E. Vaillancourt, G. Jordan, G. Dutkowski,
J. Costa eSilvaet al., 2004 Exploration of theEucalyptus
glob-ulus gene pool, pp. 46–61 in Eucalyptus in a Changing World, edited by N. Borralho, J. S. Periera, C. Marques, J. Coutinho,
M. Madeiraet al. Proceedings of the IUFRO Conference, RAIZ,
Instituto Investigacxa˜o de Floresta e Papel, Aveiro, Portugal. Reinoso, C., 1992 Variation inEucalyptus globulusin susceptibility to
Mycosphaerella leaf diseases. Honours Thesis, University of Mel-bourne, Melbourne.
Sewell, M. M., and D. B. Neale, 2000 Mapping quantitative traits in
forest trees, pp. 407–423 inMolecular Biology of Woody Plants, Vol. 1, edited by S. M. Jainand S. C. Minocha. Kluwer Academic
Pub-lishers, Dordrecht, The Netherlands.
Strauss, S. H., R. Landeand G. Namkoong, 1992 Limitations of
molecular marker-aided selection in forest tree breeding. Can. J. For. Res.22:1050–1061.
Tabor, G. M., T. L. Kubisiak, N. B. Klopfenstein, R. B. Halland
H. S. J. McNabb, 2000 Bulked segregant analysis identifies
mo-lecular markers linked toMelampsora medusaeresistance inPopulus deltoides. Phytopathology90:1039–1042.
Talukder, Z. I., D. Tharreauand A. H. Price, 2004 Quantitative
trait loci analysis suggests that partial resistance to rice blast is mostly determined by race-specific interactions. New Phytol.
162:197–209.
VanOoijen, J. W., 1999 LOD significance thresholds for QTL analysis
in experimental populations of diploid species. Heredity83:613– 624.
Van Ooijen, J. W., M. P. Boer, C. Jansen and C. Maliepaard,
2002 MapQTL 4.0, Software for the Calculation of QTL Position on Genetic Maps. Plant Research International, Wageningen, the Netherlands.
VanZyl, L. M., T. A. Coutinho, M. J. Wingfield, K. Pongpanich
and B. D. Wingfield, 2002 Morphological and molecular
relat-edness of geographically diverse isolates ofConiothryium zuluense
from South Africa and Thailand. Mycol. Res.106:51–59. Wang, Z., G. Taramino, D. Yang, G. Liu, S. V. Tingey et al.,
2001 Rice ESTs with disease-resistance gene- or defence-response gene-like sequences mapped to regions containing major resistance genes or QTLs. Mol. Genet. Genomics 265:
302–310.
Wilcox, P. L., H. V. Amerson, E. G. Kuhlman, B. H. Liu, D. M.
O’Malleyet al., 1996 Detection of a major gene for resistance
to fusiform rust disease in loblolly pine by genomic mapping. Proc. Natl. Acad. Sci. USA93:3859–3864.
Williams, J. E., and M. I. H. Brooker, 1997 Eucalypts: an
introduc-tion, pp. 1–15 inEucalypt Ecology: Individuals to Ecosystems, edited by J. E. Williamsand J. C. G. Woinarski. Cambridge University
Press, Cambridge, UK.
Williams, K., and B. M. Potts, 1996 The natural distribution of Eucalyptusspecies in Tasmania. Tasforests8:39–164.
Young, N. D., 1996 QTL mapping and quantitative disease
resis-tance in plants. Annu. Rev. Phytopathol.34:479–501.