POPULATION GENETICS OF A POULTRY FLOCK UNDER ARTIFICIAL SELECTION
I. MICHAEL LERNER, University of California, Berkeley L. N. HAZEL, Kimber Poultry Breeding Farm, Niles, Calqornial
Received February 7, 1947
HE subject of population genetics first received attention shortly after
T
the rediscovery of MENDEL’S work. I n the last thirty years purely deduc- tive studies of the consequences of Mendelian heredity in biological popula- tions have been carried out by many investigators, culminating in the defini- tive summaries of FISHER (1930) and WRIGHT (1931 and 1942). The principles derived in this fashion are being gradually tested by observations and experi- ments under both natural and laboratory conditions. Much of this work has been summarized by HUXLEY (1940) and by DOBZHANSKY (1941) with particu- lar reference to the evolutionary aspects of population genetics.The same principles have been applied to problems of breeding and improve- ment of domestic animals by WRIGHT (1939) and more particularly by LUSH (1945) and his students. The deve1o;ment of systematic breeding plans de- signed to control and manipulate the forces acting in population dynamics have proceeded largely on the basis of the deductive studies mentioned above, with but little direct aid from experiments on either laboratory or domestic animals. Not only are properly designed experiments with animals of economic value expensive to conduct, but the relatively long span between generations places a definite limitation on the study of long-range changes in the genetic makeup of such populations. Most herds and flocks have not been maintained for suf- ficiently long periods of time, and records generally are not complete enough for a satisfactory study. Suitable material for a study of some of these prob- lems is found in the complete pedigree and production records which have been kept on the production-bred Single Comb White Leghorn flock a t the UNIVERSITY OF CALIFORNIA from 1933 to date. Using these records of this flock we compared some of the actual changes which have occurred in the flock with those expected to occur on the basis of current theories of population genetics.
The forces causing genetic changes in biological populations have been iden- tified as selection, migration, chance and mutation. The material a t hand per- mits a thorough study of the first of these. Some information is available on the r6les of migration and of chance. The effects of mutation could not be in- vestigated directly, but these must have been small in view of the low muta- tion rate commonly observed in laboratory experiments and of the relatively small number of generations. Hence, the specific objectives of the present
AND
326 I. MICHAEL LERNER AND L. N. HAZEL
study were to examine the changes which have occurred in our material in re- lation to the rbles of selection, migration and chance.
FLOCK HISTORY AND T H E BREEDING PLA?;
The flock originated in 1933 from birds kept for various experimental pur- poses. At that time and for several years previously the average production in the first laying year per original pullet housed a t five months of age fluctuated around an average of 1 2 0 eggs, roughly similar to that observed then on com-
mercial egg-production farms in California. The actual averages were I 17.5
eggs in 1931, 118.6 eggs in 1932 and 125.6 eggs in 1933, when part of the flock was set aside for selection for high egg production. Thereafter, a systematic plan of family- and progeny-testing in breeding for productive characters was pursued under the direction of DR. LEWIS W. TAYLOR and the senior author.
Several males originating from other flocks were introduced during the course of the years; however, only the introductions made in 1933 and 1934 were incorporated into the flock to any large extent. Females from other groups of birds on the University plant were used as breeders in the production flock occasionally until 1941, since which date the flock has been entirely closed.
The number of pullets each year varied from 402 to 704, except in 1944 when only 260 were retained because about half the flock was diverted to another experiment. The birds were hatched in March and April each year, care being exercised to maintain their pedigree identity throughout life. Pullets were housed a t about five months of age and no culling was practiced until the end of the first laying year.
The essential features of the breeding plan were:
I) emphasis in selection was largely placed on sister and progeny per- formance;
2 ) with a few exceptions in the early stages the breeding was from hens two
or more years old;
3) as already noted, occasional outcrosses were made in the early years of flock formation, the flock being closed after 1941;
4) the size of the flock varied from 400 to 700 pullets each year from approxi- mately I I sires and 85 dams, with the previously noted exception in 1944; 5) mating of closely related individuals was consciously avoided.
POPULATION GENETICS I N POULTRY 3 2 7
The average annual hen-housed egg production of the flock from 1933 to 1944 is shown in figure I . The decrease during the period from 1937 to 1939
which gives the appearance of a cyclic trend was caused by increased mortality from lymphomatosis (TAYLOR, LERNER, DEOME and BEACH 1 9 4 3 ) ~ presuma- bly due to greater exposure to the disease. This factor and a consequent re- duction in selection for egg production due to additional emphasis on resistance to lymphomatosis may account for the considerable drop in the production index in 1938. The slope of a linear regression fitted to the data indicated an annual change in production of 5.6 eggs per year. Although the trend is not
IMPROVEMENT IN EGG PRODUCTION
2/40
T
-/20-
-
-
-
e
-
I I I I I I I I I I 1
Year o f Hatch
FIGURE I .-Average production index by years in the UNIVFRSITY OF CALIFORNIA production- bred flock. The flock had an increase in incidence of lymphomatosis in 1937-38. The slope of the least squares' regression line is 5.6 eggs per year.
necessarily uniform throughout the twelve years, this figure may be accepted as the average increase in egg number per year.
It is possible to compare the observed rate of improvement with therate expected on the basis of a priori information in this population. The agreement between the actual and the expected rates would partially test whether or not the genetic principles of breeding for egg production are correctly understood. The expected rate of improvement depends on the I ) intensity of selection; 2)
accuracy of selection, i.e., heritability; and 3 ) interval between generations which is measurable in terms of the age of parents (DICKERSON and HAZEL
1944). Estimates of all three of these factors were available in this population, and from them the expected rate of improvement was computed.
328 I. MICHAEL LERNER AND L. N. HAZEL
remated after their progeny had been tested. Sires were first used for breeding when one year old, their selection being based primarily on the incomplete records of their sisters, while older sires were selected on basis of their progeny tests.
TABLE I
Selection differentials, heritabilities and expected genetic gains front the three stages of selection.
~. _ _ . _ ~
~-~
STATISTIC BASIS FOR SELECTION SIRES DAMS
Individual performance
First-year progeny record
Individual performance
First-year progeny record Selection differential Sisters’ record
Heritability Sisters’ record
Expected genetic Individual performance
gain Sisters’ record
First-year progeny record
-
26.0
24.4
4.03 11.03
9 9 . ’ 39.8 29.0
0,045
0.138
0 . 1 5 5
4 . 4 6 5.49 4.50
Table I presents in its first part the average selection differentials for four
years (1935, 1937, 1939 and 1941) used as a sample representative of the whole period. It may be seen that selection differentials based on sisters’ records were greater for dams than for sires. Although the number of dams was nearly eight times as great as that of sires, the completed records of sisters were avail- able for them as against incomplete records for the sisters of sires mated for the first time. The selection differentials for the breeding birds selected on the basis of progeny records were also higher for the dams than for sires (29.0 vs. 24.4 eggs). This presumably is due to the fact that a smaller number of offspring was obtained from dams than from sires. I n consequence of this smaller num- ber, the variation in progeny averages was much wider for dams than for sires and the same percentage of culling on progeny-test information gave a larger selection differential (in actual units) for the dams than for the sires.
The advantages shown in the records of selected birds were in part due to differences in environment, exposure to disease, or other intangible but non- hereditary factors. The regression expected to occur must be considered in computing the genetic gain accomplished by selection. The fractions of the selection differentials supposed to represent heritable differences are given in the second part of table I. The following considerations led to their formula-
tion. LERNER and TAYLOR (1g43), using records chiefly from this flock, esti- mated that the heritability of differences in the production index between fami- lies averaging eight daughters was 0.155. This figure is equal to
POPULATION GENETICS IN POULTRY 329 where n is the number of sisters in a family (in this case S), r the genetic cor- relation between them (in this case o . ~ ) , and G the heritability between individ- uals (see LUSH 1945). Solving the above equation for%, the heritability of in- dividual records is found to be 0.045. I n the present case, the sisters’ records of sires and dams were averages of eight and seven pullet records respectively, while the first-year progeny records were averages of 36 pullet records for sires and eight for dams. With these figures as a basis, the respective heritabilities for each of the selection differentials in table I can be similarly computed.
The genetic gain which theoretically should have resulted from the selection practiced was then computed as the product of each selection difffrential and its corresponding estimate of heritability. These figures, given in the third part of table I , represent the genetic gain expected by selection of the parents a t the various stages when selection was practiced. I t is noteworthy that early selection was considerably more effective in dams than in sires, whereas the reverse was true of later selection. The first selection of dams was based on both individual performance and completed sisters’ records, whereas in sires it was of necessity based only on incomplete sisters’ records. This type of selection required two years in the case of the dams and only one in the case of the sires. Progeny-testing was approximately 2 . 5 times as effective in sires as in dams,
the difference being due to the greater accuracy attained by having 4.7 times as many progeny per sire as per dam.
All of the birds in a given year were from sires and dams upon which the first selection had been practiced, while 46 and 32 percent were from progeny- tested sires and dams, respectively. Hence, the average genetic gain of the offspring over the genetic merit of the parental generations may be written as follows
gain from sires = [4.03+0.46 (11.03)]/2 = 4.55
gain from dams= [4.46+5.49+0.32 (4.50)]/2= 5.70
gain from both parents IO. 2 5
The gain of 1 0 . 2 5 eggs represents the improvement expected during the period
from the hatching of the parents to the hatching of the offspring, which cor- responds to the average age of parents. As shown later, the average age of par- ents was 1.94 years. Thus the ratio 10.25/1.94=5.28 represents the annual gain in production which should have resulted from the selection practiced.
The agreement with the actual gain of 5.6 eggs per year is as close as could reasonably be expected. The heritabilities used in the computations are based on a n estimate intended by LERNER and TAYLOR (1943) as a minimum figure and some selection not included in the selection differentials which were used in the computations may have been practiced. This study provides good evi- dence that a knowledge of selection intensity, heritability and inter-generation span actually enables a breeder to predict the rate of improvement expected from selection (DICKERSON and HAZEL 1944).
EFFECTIVENESS OF PROGENY TESTING
330 I. MICHAEL LERNER AND L. N HAZEL
prove an effective tool in promoting genetic improvement which would be ap- plicable to all kinds of livestock and for all economic characters. This belief developed because attention had been centered on the greater accuracy of progeny-test information as compared with that obtained from individual performance or from collateral relatives. Deductive research has indicated more recently that the use of progeny-tested parents may actually result in decreasing the rate of progress as compared with t hat attainable by earlier selection (DICKERSO~ and HAZEL 1944). This seems to be particularly true where
(I)
the length of generation is increased considerably by requiring t h at the parents be progeny-tested before use, ( 2 ) the reproductive rate is high,a nd (3) the basis for making early selections is relatively accurate. It can be inferred from these conditions that progeny-testing is likely to be more effec- tive for some kinds of animals and for some traits than for others, since these conditions are largely beyond artificial control or manipulation
T A B L E 2
Increases i n average production of the ojspring of part-tested and progeny-tedpd parents over that from untested #arents.
- -~ -~
UNTESTED PART-TESTED TESTED
TOTAL
SIRES SIRES SIRES
-
NUMBER EGGS NUMBER EGGS NUMBER EGGS NUMBER EGGS
Untested dams 619 o 344 1.5 118 1.3 1081 0.3
Part-testeddams 191 10.1 . 132 -2.4 59 11.6 382 6 . 0
1 2 1 8.7
Tested dams 42 9.5
Total 852 1.8 5oj 1 . 1 227 7 . 2 1584 2.3
29 11.6 jo 22.2
The data from the present flock afforded an opportunity for investigating experimentally the effectiveness of progeny testing for egg production. Mat- ings were made between untested, partially tested, and fully progeny-tested sires and dams in most of the years. The years 1935, 1937, 1939 and 1941 were again chosen for study. Weighted differences between the progeny from each type of mating and those from untested parents were calculated for each of the four years and combined as shown in table 2. Although the figures appearing
therein are not wholly consistent, apparently due to the small numbers of off- spring involved, they show that in general the offspring from tested and par- tially tested parents tended to have higher production than the progeny of un- tested parents. Thus the progeny from partially tested sires averaged 1.1 eggs and those from partially tested dams 6.0 eggs more than those from untested parents, while those from tested sires and dams, respectively, averaged 7.2 and 8.7 eggs higher. The advantages of the older parents are based on the per- formance of progeny hatched after the parents were promoted to tested rat- ings, as compared with the performance of progeny hatched in the same years from younger parents which had not yet been tested. These figures are not large in themselves, but when they are compared with the annual rate of gain
POPULATION GENETICS I N POULTRY TABLE 3
331
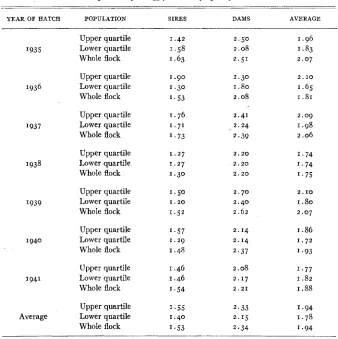
Average age of parents ( i n years) for the entire j o c k and for the families i n the upper and lower quartiles of the egg production frequency distribution.
~-
_ _
YEAR OF HATCH POPULATION SIRES DAMS AVERAGE
Upper quartile 1.42 2 . 5 0 1.96
'935 Lower quartile 1 . 5 8 2 . 0 8 1.83
Whole flock 1.63 2.51 2 . 0 7
Upper quartile 1.90 2.30
'936 Lower quartile I .30 1 . 8 0
Whole flock 1.53 2 . 0 8
Upper quartile 1.76 2.41
I 9 3 7 Lower quartile 1.71 2 . 2 4
Whole flock 1.73 2.39
Upper quartile 1.27 2 . 2 0
1 9 3 8 Lower quartile 1.27 2 . 2 0
Whole flock 1.30 2.20
Upper quartile 1.50 2 . 7 0
'939
1 9 4 0
1941
Lower quartile 1 . 2 0 2.40
Whole flock 1.52 2.62
Upper quartile 1.57 2 . 1 4
Lower quartile 1.29 2 . 1 4
Whole flock 1.48 2.37
2 . 1 0
1.65
1 . 8 1
2.09
1.98
2 . 0 6
1.74
1 ' 74 1.75
2.10
I .80 2.07
1.86
1.72
1.93
Upper quartile I .46 2.08 1.77
Lower quartile 1.46 2 . 1 7 I .82
Whole flock 1 . 5 4 2.21 1.88
Upper quartile 1.55 2.33 1.94
Average Lower quartile 1.40 2.15 1.78
Whole flock 1.53 2.34 1.94
~ _ _
INTERVAL BETWEEN GENERATIONS
332
I t may be noted t ha t the sires and dams of the full sister families in the up- per quartiles of the frequency distribution of egg production did not average consistently older than those in the lower quartile. Great consistency in this respect is not to be expected, since the heritabilities of the information upon which the parents were selected indicate that many mistakes must have been made in selection. However, the average age of the parents of families in the upper quartile was greater than t h at of the parents of families in the lower quartile, as might be expected from the conclusion reached concerning the ef- fectiveness of progeny-testing in the preceding section (Table 2 ) . It may also be noted that the parents of families in the lower quartile wereconsistently younger than the average of all parents.
I. MICHAEL LERNER AND L. N. HAZEL
INTRODUCTION OF BREEDING STOCK
The introduction of breeding stock into herds and flocks of domestic ani- mals corresponds to migration between partially isolated populations. WRIGHT (1940) has shown that partial isolation with limited migration provides a basis for the inter-group selection of genetic systems which is important for the
TABLE 4
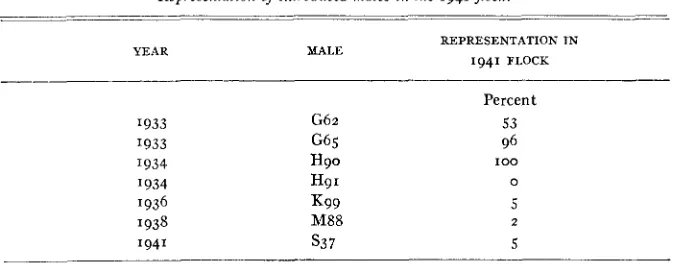
Representation o j introduced males i n the 1941 flock.
YEAR MALE REPRESENTATION I N
1941 FLOCK
I933 G62
I933 G65
I934 H9o
'934 H9 I
'936 K99
1941 s 3 7
'938 M88
Percent 53 96 IO0
0
5
5
2
evolution of the species as a whole. It should be even more effective in herds and flocks of dohestic animals, where the multiplication or elimination of genes from introduced stock can be rigidly controlled by the breeder. LUSH (1946), in summarizing investigations on breeds of domestic animals, found that some degree of subdivision existed in about half of the breeds which have been studied.
POPULATION GENETICS IN POULTRY 333 difference in the extent to which their genes have spread through the flock) H9o being represented in the pedigrees of all of the 1941 flock and H91 in none. Additional introductions of one male each in 1936, 1938 and 1941 were made but these had little effect upon the genetic composition of the present flock. The genes of M88 and S37, which probably were present in low fre- quency in 1941 (table 4), have since been eliminated entirely, so that they are absent from the 1945 flock, while those of K99 are still present in low fre- quency. Thus genes from two of the introduced males have been disseminated widely through the flock while those from three others have been eliminated entirely.
Females have been introduced into the production-bred flock from experi- mental groups on the University farm from time t o time. However, i t does not seem likely that they could have had much influence in changing the genetic composition of the flock, particularly since they were from the same founda- tion stock as the original production-bred flock or from families removed from that flock for other studies.
INBREEDING AND RELATIONSHIP
The average coefficients of inbreeding (WRIGHT 1923) are given in table 5 for 1935, 1937, 1939 and 1941, calculated from 1931 as the base year. These coefficients represent the expected average percentage loss or “decay” in heterozygosis since 1931 as a result of gene segregation and subsequent sam- pling between generations where the effective number of breeding animals is
TABLE 5
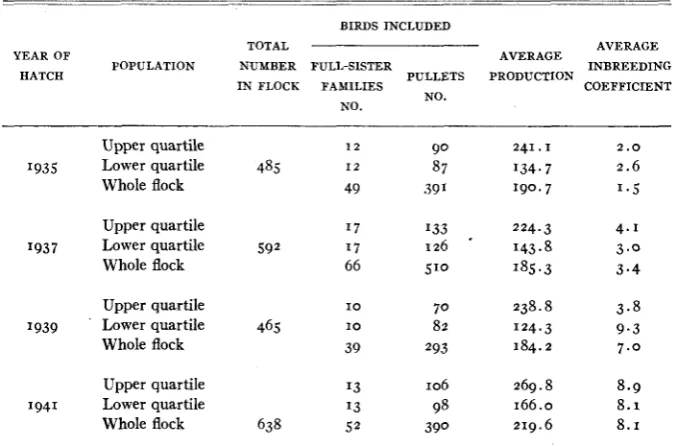
Production, inbreeding and relationship data on full-sister families containing jive or more birds i n relation to the family’s position i n the flock w d h respect to egg production.
~ ____ __ _ _ _ _ _ _ _ _ _ _ _ _ _ _ _ ~
BIRDS INCLUDED
TOTAL AVERAGE
YEAR OF AVERAGE
POPULATION NUMBER FUL1.-SISTER INBREEDING IN FLOCK FAMILIES COEFFICIENT
HATCH PULLETS PRODUCTION
NO. NO.
Upper quartile I 2 90 241. I 2.0
Whole flock 49 ,391 190.7 1.5
193 5 Lower quartile 485 I 2 87 134.7 2.6
Upper quartile ‘7 ‘33 224.3 4.1
1937 Lower quartile 592 17 126 ‘ 143.8 3.0
Whole flock 66 5’0 785.3 3.4
Upper quartile 1 0 7 0 238.8 3.8
1939 ’ Lower quartile 465 I O 82 ‘24.3 9.3
Whole flock 39 293 184.2 7.0
Upper quartile ‘3 106 269.8 8.9
1941 Lower quartile ‘3 98 166.0 8.1
334 I. MICHAEL LEKNER AND L. N. HAZEL
finite. Changes in heterozygosis which may have occurred due to mutation or selection per se are not included in these estimates.
The average inbreeding in 1935 was 1.5 percent, after which it rose to 8.1 percent in 1941. This corresponds to an average increase of about 1.1 percent
per year or 2.1 percent per generation. From nine to 14 sires were used in the
flock each year, the average number being about 11. The number per genera-
tion would be somewhat larger than 11, but would not be more than 17, since
about half of the offspring were from sires used more than one year. The num- ber of hens used each year was from about 60 to 90. According to WRIGHT'S approximate formula (1931), the rate of inbreeding expected per generation is 1oo/8M percent in a random mated population consisting of a large number of females and M equally used sires. The actual increase of 2.1 percent per genera-
tion corresponds to M = 1oo/8 (2.1) = 5.95 or approximately 6 as the effective
number of sires per generation in the University flock.
Several factors in the mating system tended to make the actual inbreeding differ from t ha t expected on the basis of WRIGHT'S formula. Close inbreeding was avoided in most cases by mating birds which had no parents or grandpar- ents in common. Some males and females were introduced after 1931 so t h at the flock was not strictly closed. These factors would tend to reduce the in- breeding and make the effective number of males larger than the actual num- ber. Family selection was practiced rather intensively (table I) and required
the use of larger numbers of full brothers and sisters as breeders than would have been the case if males had been chosen a t random or without reference to the performance of their sibs or parents. I n addition, the intensive use of pro- geny-tested parents made large families of closely related birds available for use as parents. Thus the actual situation in any year was that the males used for breeding consisted of a few sires and their sons (and occasionally grand- sons), while many of the females were daughters of the older sires and full sis- ters of the younger ones. The net result was that the effective number of sires was distinctly smaller than the actual number.
Another aspect of the inbreeding picture is shown by the inter se relation- ship between families. If matings were made a t random (except for avoiding full siblings) the inbreeding coefficient would be R/( 2 -
R),
where R is the interse relationship between families. The relationships between f'imilies in the up- per quartile of the egg-production frequency distribution are shown in table 6 for each of four years. The actual inbreeding coeflicient is smaller than the co- efficient expected on the basis of random mating among non-siblings in each case. This shows t h at closely related individuals were mated together less fre- quently than would have occurred under random mating. The two practices followed in the breeding plan, intense family selection and deliberate avoid- ance of close matings, had opposite effects on the rate of approach to homozy- gosis, but it is evident that the former was more powerful than the latter.
EFFECT O F INBREEDING O N E G G PRODUCTION
POPULATION GENETICS IN POULTRY 335 frequency. Since the last two factors are likely to remain unknown for produc- tive characters, the matter can be decided only by experimentation and obser- vation. There are indications (see JULL 1940 for numerous references) that intense inbreeding systems lead to significant deterioration in the productive characters of poultry. In the flock under study, production (figure I ) and in-
breeding (table 5 ) were positively correlated due to a temporal trend. Appar- ently intense selection can override the deleterious effects of inbreeding when the latter proceeds a t the observed rate of 2.1 percent per generation. Never-
theless, it must be kept in mind that the inbreeding is calculable in theoretical
TABLE 6
Inbreeding and relationship i n the upper quartile of the j o c k .
_ _ _ _ _ _ _ _ ~ _ _ ~
Inter se INBREEDING EXPECTED 1NBREEDING COEFFICIENT YEAR OF KATCH
RELATIONSHIP COEFFICIENT
9.2
14.0
12.7
17.4
5.1
8.2 7.3
10.5
terms only, and that selection of heterozygotes may have retarded slightly the approach to homozygosis indicated by the inbreeding coefficient. Hence it is of
interest to determine whether within a given year (where the effect of the time trend would be absent) a relation between production and inbreeding exists. This relation was investigated in three different ways.
Firstly, the inbreeding coefficients for the families in the upper and lower quartiles of the egg-production frequency distribution were computed for the years 1935, 1937, 1939 and 1941 (table 5 ) . The average inbreeding coefficients were larger in the upper than in the lower quartile in two years and smaller in the other two. Secondly, the inbreeding coefficients were calculated for par- ents of families in these quartiles (table 7). Once more no definite differences were noted. Finally, regression coefficients of kgg production on the coefficients of inbreeding were calculated. They were found to be -0.54, -0.46, -5.81 and 0.84 for 1935, 1937, 1939 and 1941, respectively. Since the average for the four years (- 1.20) was not statistically significant it cannot be stated with cer-
tainty that inbreeding had a detrimental effect on egg production, bu t a t least one of the negative regressions (- 5.81) was significant. Hence, the question whether a relatively slow loss of heterozygosis is detrimental to egg production must be left open, but the effect in the concrete case under discussion could not have been large.
R ~ L E OF CHANCE
336 I. MICHAEL LERNER AND L. N. HAZEL
7
zN
q being the frequency of the allele in the generation from which the gametes come. In populations where generations overlap, the rcile of chance is most con-
TABLE 7
Average inbreeding coefiipnts of the sires and dams of the upper and lower quartiles and of the entire flock by years.
__ ~ - ~~~~~
PULLETS IN UPPER PULLETS IN LOWER
YEAR OF ALL PULLETS
QUARTILE QUARTILE
__________
______
__-_
_ _ _ _ ~ _ _ _ _HATCH OF FLOCK
SlRES DAMS SIRES DAMS SIRES DAMS
I935 0 1 . o 0 0 0 0.3
I937 0.2 2.9 0.4 2.8 0.6 1.6
I939 5 . 9 1.6 8. I 1.7 6.3 2.7
1941 8.6 4.6 7.3 6.4 8.2 5.2
veniently measured by the inbreeding coefficient. Thus the standard error per generation in the present flock is IOO\/.OZI q (I-q) = 1 5 4 9 (I-q) percent. This is about 7.5 percent for genes with a frequency near 50 percent and 1.5 percent for genes with a frequency near one percent.
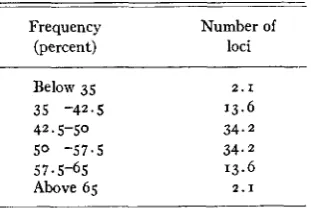
As an example of the importance of chance, we may consider the gene fre- quency array expected for 100 loci with an original frequency of 50 percent
after one generation of segregation. The expected array is:
Frequency Number of
(percent) loci
Below 35 2.1
35 -42.5 13.6
42.5-50 34.2
5 0 -57.5 34.2
57-5-65 13.6
Above 65 2 . 1
When gene frequency is near o or 100 percent, chance operates with greater
finality, although with less magnitude quantitatively than when frequency is in the intermediate range. Thus genes having a frequency of less than 5 per- cent would appear to be in danger of extinction each generation. Of IOO genes
POPULATION GENETICS IN POULTRY 337
Hence, the genetic constitution of a flock no larger than this is likely to be altered considerably in a few generations by the effects of chance alone.
DISCUSSION
The actual improvement in egg production in the 1 2 years covered by this
study was from an average of about 1 2 0 eggs to about 2 2 0 eggs per bird per
year. This does not necessarily represent the maximum possible rate of prog- ress, but is sufficient to attest to the power of the genetic forces brought t o bear on the flock.
I n general, breeding programs may be designed to emphasize the r8les of selection, of migration, or of chance, individually, so that only one force is responsible for changes in the genetic composition of the population (except that mutation cannot be controlled). Deductive studies (summarized by
WRIGHT 1942) indicate that most favorable conditions for genetic advance are attained when the evolutionary forces are balanced against each other rather than when any one completely dominates the situation. The breeding program used in this flock seems to be well balanced from this standpoint, although un- doubtedly some refinements might make it more effective. I t s chief criticism may be that selection has been so intense that rare beneficial genes have been eliminated by chance or that certain beneficial combinations of genes have been prevented from occurring. All of the selection has been in one direction and for one kind of genetic system, whereas, if control by selection had been some- what less rigid, a greater number of gene combinations and genetic systems would have been formed and tested. The specific effects of chance, migration and selection, together with interrelations between them, may be next consid- ered in that order.
The r81e of chance in determining changes in gene frequency from one gene- ration to another has been quite important in this flock. This was in part a con- sequence of the kind of selection practiced. LUSH (1946) pointed out that in- tense selection was accompanied by restriction of ancestry in small populations of domestic animals. Although close mating was avoided where possible in this flock, inbreeding rose more rapidly than would have been expected in a flock of equal size where the parents were chosen a t random. The intense family selec- tion was responsible for the additional inbreeding and for the corresponding increase in the importance of random changes in gene frequency.
It seems probable that selection has been sufficiently intense to avoid the random fixation of genes which had undesirable effects unless their initial fre- quency was very high. The evidence concerning the detrimental effect of in- breeding was inconclusive but the effect was not pronounced if it existed a t all.
LUSH (1945, p. 284) stated “It is unlikely that inbreeding rates as high as three or four percent (per generation) can go on forever without harm, bu t certainly they can be continued for many generations.” Nothing can be added to this statement from the present study except that an appreciable rate of improve- ment was maintained for several generations while the rate of inbreeding was more than two percent per generation.
338 I. MICHAEL LERNER AND L. N. HAZEL
tor quantitatively, since only seven sires have been introduced among approxi- mately IOO used. Family selection, when combined with migration, provides
an effective means of testing new gene combinations and accepting or rejecting them more quickly than is likely to occur in nature. I n this case, the intense family selection practiced quickly eliminated genes from three of these sires and carried the frequency of genes from two others to relatively high levels.
Selection was the only directive force utilized in the breeding program. Con- siderable significance is attached to the general agreement between the actual rate of improvement and that calculated on the basis of the selection which has been practiced. Since this seems to be the first experimental test of the selection principles deduced in theoretical studies, the agreement between actual im- provement and expected improvement was sufficiently close to be gratifying. T o some extent then, those principles can be employed in applied breeding pro- grams with greater confidence in their validity.
The three factors that determine the effectiveness of selection are selection intensity, selection accuracy or heritability, and the average age of parents. Although they can be manipulated by the breeder, they are not independent of each other. Thus accuracy of selection and the average age of parents exer- cise a pull in opposite directions. Similarly, as shown in table I , the selection bases with lower heritabilities permit higher selection differentials than those with higher heritabilities. Hence, there undoubtedly must exist an optimum combination of these forces to provide the maximum rate of improvement. Whether or not the optimum combination was attained in the present flock
is not an important question in this discussion. The significant point is t h a t the rate of progress predictable from the factors discussed was realized, thereby substantiating the statistical and genetic principles upon which they were based.
SUMMARY
The r8les of selection, chance and migration were analyzed with respect t o
the improvement in egg production in the UNIVERSITY OF CALIFORNIA poultry
flock over a period of 12 years. The important features of the mating system
used were: annual flock size from 400-700 pullets, semi-closed system of breed- ing, emphasis on family and progeny performance, selection and breeding from females two years of age or older, and deliberate avoidance of close mating.
The analysis indicated t h at the theoretical gains expected on the basis of known selection intensity, heritability and average interval between genera- tions were in close agreement with the actual gains realized (5.28 vs. 5.6 eggs per year). This is interpreted as a verification of the principles of population genetics derived deductively by earlier workers.
Progeny-testing was found to have made a significant contribution to the improvement obtained in spite of the increase in the average age ofparents incident to its use.
POPULATION GENETICS I N POULTRY 339 from 11-17 actual sires per generation to a calculated number of six effective
sires. No significant detrimental effects of this rate of inbreeding on egg p r o d u e tion could be established.
The r61e played by chance in changing gene frequencies was found to be rather large, the standard error of chance segregation being between 7.5 per- cent for genes with a frequency of 50 percent and 1.5 percent for genes with frequencies near one percent.
Migration was not an important factor quantitatively in this population, since the number of introduced sires was relatively low. It was shown that artificial selection provides potent means for rapid incorporation or elimina- tion of introduced genes.
As a general conclusion, it may be stated that the currently accepted prin- ciples of population genetics (excluding the r61e of mutation) are empirically verifiable and lead to predictable rates of improvement in populations sub- jected to artificial selection.
LITERATURE CITED
DICKERSON, G. E., and I,. N. HAZEL, 1944 Effectiveness of selection on progeny performance as
DOBZHANSKY, TH., 1941 Genetics and the origin of species. 2nd ed. Ix+446 pp. New York:
FISHER, R. A., 1930 The genetical theory of natural selection. XIVS272 pp. Oxford: Clarendon
HUXLEY, J. S., (editor), 1940 The new systematics. 583 pp. Oxford: Clarendon Press.
JULL, M. A., I940 Poultry breeding. 2nd ed. x I v + 4 8 4 pp. New York: Wiley. LERNER, I. M., and L. W. TAYLOR, 1943
Amer. Nat. 77: 119-132.
LUSH, J. L., 1945 Animal breeding plans. 3rd ed. VIII+443 pp. Ames: Collegiate Press.
1946 Chance as a cause of changes in gene frequency within pure breeds of livestock. Amer. Nat. 80: 318-342.
TAYLOR, L. W., I. M. LERNER, K. B. DEOME, and J. R. BEACH, 1943 Eight years of progeny- test selection for resistance and susceptibility to lymphomatosis. Poult. Sci. 22: 339-34 7.
WRIGHT, S., 1923 Mendelian analysis of the pure breeds of livestock. I. The measurement of breeding and relationship. J. Hered. 14: 339-348.
1931 Evolution in Mendelian populations. Genetics 16: 97-159.
1939 Genetic principles governing the rate of progress of livestock breeding. Proc. Amer. Soc. Animal Prod. 1939: 18-26.
1940 Breeding structure of populations in relation to speciation. Amer. Nat. 74: 232-248. 1942 Statistical genetics and evolution. Bull. Amer. Math. Soc. 48: 225-246.
a supplement to earlier culling in livestock. J. Agric. Research 6g: 459-476.
Columbia University Press.
Press.