©
DOI: 10.1534/genetics.104.037051
Rapid Subfunctionalization Accompanied by Prolonged and Substantial
Neofunctionalization in Duplicate Gene Evolution
Xionglei He and Jianzhi Zhang
1Department of Ecology and Evolutionary Biology, University of Michigan, Ann Arbor, Michigan 48109 Manuscript received September 30, 2004
Accepted for publication November 16, 2004
ABSTRACT
Gene duplication is the primary source of new genes. Duplicate genes that are stably preserved in genomes usually have divergent functions. The general rules governing the functional divergence, however, are not well understood and are controversial. The neofunctionalization (NF) hypothesis asserts that after duplication one daughter gene retains the ancestral function while the other acquires new functions. In contrast, the subfunctionalization (SF) hypothesis argues that duplicate genes experience degenerate mutations that reduce their joint levels and patterns of activity to that of the single ancestral gene. We here show that neither NF nor SF alone adequately explains the genome-wide patterns of yeast protein interaction and human gene expression for duplicate genes. Instead, our analysis reveals rapid SF, accompa-nied by prolonged and substantial NF in a large proportion of duplicate genes, suggesting a new model termed subneofunctionalization (SNF). Our results demonstrate that enormous numbers of new functions have originated via gene duplication.
G
ENE duplication is believed to be the primary NF-II. In recent years, an alternative to the NF hypothe-sis termed the subfunctionalization (SF) hypothehypothe-sis has source of new genes (Ohno1970) and “evolutionby gene duplication” has emerged as a general principle been developed. The SF hypothesis argues that ancestral functions of the progenitor gene are partitioned be-of biological evolution, evident from the prevalence be-of
duplicate genes in all sequenced genomes of Bacteria, tween the duplicates so that the joint levels and patterns of activity of the duplicates are equivalent to that of Archaea, and Eukaryota (reviewed inZhang2003).
Pop-ulation genetic theories predict that an entirely redun- the progenitor gene (Hughes1994;Forceet al.1999;
Stoltzfus 1999). It should be noted that there are dant duplicate copy cannot be maintained in the
ge-nome for a long time, as deleterious mutations will several versions of the SF hypothesis depending on the meaning of “gene function.” For example, Hughes
accumulate and render the gene nonfunctional. The
only exception may be the concerted evolution among (1994) meant protein function when he formulated the SF hypothesis, whereasForceet al. (1999) emphasized certain duplicate genes for which a larger amount of gene
product is beneficial (Zhang 2003). In other words, the pattern of gene expression when they proposed SF.
LynchandForce(2000) further formulated their SF functional divergence between duplicates is usually
re-hypothesis mathematically in a so-called “duplication-quired for their long-term retention in the genome.
degeneration-complementation (DDC)” model. Because The evolutionary process of this divergence, however,
gene function includes both gene expression and pro-is not well understood. The neofunctionalization (NF)
tein function, we do not attempt to differentiate the hypothesis proposes that after duplication one daughter
different forms of SF in this work. gene retains the ancestral function while the other can
Several authors have attempted to test the NF and gain novel functions (Ohno1970). In Ohno’s view, the
SF hypotheses at the genomic level by comparing the duplicate gene that eventually acquires new function
nucleotide substitution rates of duplicate genes (Van
experiences a period of complete functional relaxation,
de Peer et al.2001;Kondrashovet al.2002;Kelliset
behaving like a pseudogene (Ohno 1973). This,
how-al.2004). Their results were equivocal because the two ever, does not have to be the case during NF. We
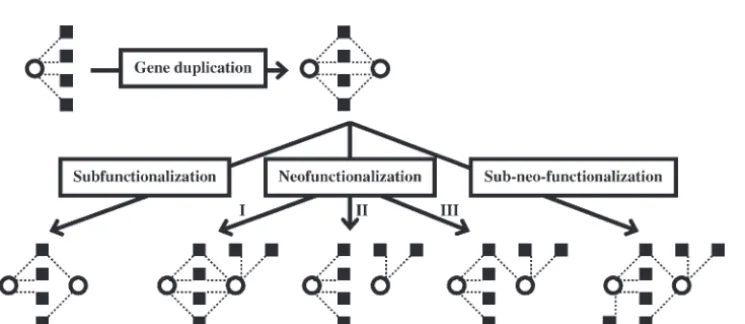
there-hypotheses do not make contrasting predictions on sub-fore consider a broader NF hypothesis in which the
stitution rates. For example, asymmetric evolutionary gene acquiring new function may retain all (NF-I), none
rates between duplicates have been used to support NF (NF-II), or some (NF-III) of the ancestral functions
(Fig-(Kellis et al. 2004). But this observation can also be ure 1).Ohno’s (1973) NF model is represented by our
explained by asymmetric SF because the two daughter genes could have inherited different numbers of ances-tral functions and thus could be under different levels
1Corresponding author:Department of Ecology and Evolutionary
Biol-of functional constraint. The presence Biol-of functional con-ogy, University of Michigan, 3003 Natural Science Bldg., 830 North
University Ave., Ann Arbor, MI 48109. E-mail: [email protected] straint (indicated by the ratio of the nonsynonymous to
use of other cutoffs did not change our results as the two synonymous substitution rates) in both daughter genes
groups were similar in general. immediately after duplication led some to reject the NF
It is generally agreed that an ancestral function of a progeni-hypothesis (Kondrashovet al.2002), although a certain tor gene will be retained in at least one of the daughter genes degree of functional constraint is compatible with a after duplication and that shared functions between duplicates broader NF model (e.g., NF-I and NF-III in Figure 1). are ancestral functions. It follows that SF reduces the number of shared functions between duplicates (s), whereas NF does Because the NF and SF hypotheses are explicitly about
not affects. In the absence of NF, SF can be measured by gene function, the most direct test would be to use
ISF⫽(1⫺s/t)[1⫺ ␦/(t⫺s)]⫽ 1⫺(s⫹ ␦)/t, wheretis
functional genomic data. In this article, we use genome- the total number of functions of the duplicates and␦is the wide protein-protein interaction data from yeast and difference in the number of functions between the duplicates. gene (spatial) expression data from human to test the In the above formula, 1 ⫺ s/t measures the proportion of ancestral functions that are no longer shared by the duplicates NF and SF models. We show that neither NF nor SF
and 1⫺ ␦/(t⫺s) measures the extent of SF for these func-alone adequately explains functional divergence of
du-tions. Giventands, expected values ofISFunder random SF
plicate genes. Instead, our analysis reveals rapid SF, ac- (i.e., an ancestral function is equally likely to be retained by companied by prolonged and substantial NF in a large either of the two genes) can be calculated using probability proportion of duplicate genes, suggesting a new model theories.
To estimate the number of yeast genes produced by duplica-termed subneofunctionalization (SNF).
tion, all-against-all BLASTP searches were carried out with E ⫽ 10⫺5 as the cutoff. A minimum of 2250 duplications were necessary to explain the gene families suggested by the
MATERIALS AND METHODS BLASTP search results.
Human data and analyses:The human gene expression data
Yeast data and analyses:A total of 6402 open reading frames were generated bySuet al.(2002) using the U95A arrays of (ORFs) inSaccharomyces cerevisiaewere downloaded from the Affymetrix (http://www.affymetrix.com) and were downloaded Comprehensive Yeast Genome Database at the Munich Infor- from http://expression.gnf.org. Annotation files of U95A mation Center for Protein Sequences (MIPS; http://mips.gsf. arrays were downloaded from Affymetrix. FollowingSuet al. de/). Among these, 4362 are encoded in the nuclear genome (2002), we used an average difference (AD) value of 200 as and have gene names in MIPS, the Saccharomyces Genome the cutoff for determining whether a gene is expressed in a Database (http://www.yeastgenome.org/), or NCBI (http:// given tissue. Use of AD⫽ 400 did not change our results. www.ncbi.nlm.nih.gov/). These genes formed our database of The human protein data containing 28,681 sequences were confirmednucleargenes (CNG). All (6402 ORFs)-against-all downloaded from NCBI. All-against-all BLASTP (E⫽0.1) was BLASTP searches were carried out withE⫽10⫺20as the cutoff,
carried out to identify 3283 singletons, including 515 that and the reciprocal best hits that both appear in CNG were were found in the gene expression data. A total of 1230 pairs regarded as duplicates. After removing transposable elements, of duplicate genes that appeared in the expression data were 625 duplicate gene pairs were found. To identify singleton identified byMakovaandLi(2003) and thed
Svalues were genes, all-against-all BLASTP searches were conducted with estimated by these authors using PAML.
E⫽0.1 as the cutoff. A total of 1022 members of CNG were found to have no nonself hits and were regarded as singletons for further analysis.
Yeast protein-protein interaction data were obtained from RESULTS
MIPS and from the high-confidence subset of interaction data
Analysis of yeast protein-protein interaction data:To compiled byvon Meringet al.(2002). Only physical
interac-tions were considered. After excluding self-interacinterac-tions and test the NF and SF models at the genomic level, it is interactions involving mitochondrion proteins, a nonredun- necessary to use a measure of gene function that is dant protein interaction data set containing 9316 pairwise
applicable to and available in a large number of genes. interactions among 4292 ORFs was obtained, including 331
Protein-protein interaction is an important function of pairs of the above identified duplicate genes and 745 singleton
many protein-coding genes and it has been investigated genes.
The DNA sequences of duplicate genes were aligned follow- in the yeastS. cerevisiaeby various high-throughput meth-ing the protein sequence alignment by CLUSTALW (Thomp- ods in the past few years (summarized inVon Mering son et al. 1994). Numbers of synonymous substitutions per
et al.2002).Wagner(2001, 2002, 2003) pioneered the synonymous site (dS) between duplicates were estimated by
analysis of yeast protein-protein interactions in the con-the likelihood method using PAML (Yang 1997). Because
codon usage bias may reduce the rate of synonymous substitu- text of duplicate gene evolution. But he focused on tion, we computed the effective number of codons (ENC; the functional divergence of duplicate genes without Wright 1990) for all the duplicate genes using codonW properly differentiating NF from SF. In our analysis, we (http://bioweb.pasteur.fr/seqanal/interfaces/codonw.html).
specifically test the NF and SF models. To reduce errors, FollowingGuet al.(2002) andPappet al.(2003), we reanalyzed
particularly false-positive errors, we analyzed the high-the data after removing those genes with ENC⬍35 (48 pairs),
but the results did not change. Duplicate genes were grouped confidence interaction data compiled in von Mering according to thedSvalues between duplicates.dS⫽1 was used et al.(2002) and those annotated in the MIPS database. as a cutoff becausedSestimates⬍1 are relatively reliable. We From the yeast genome, we identified nonredundant pairs further divided genes ofdS⬍1 into two groups of
approxi-of duplicate genes and genes that do not have recogniz-mately equal size using the cutoff ofdS⫽0.25. Because most
able duplicate copies in the genome (singleton genes). A gene pairs haddS⬎1 (299 out of 331), we separated these
TABLE 1
Notations used in this article
Symbols Meaning for the yeast protein-protein interaction dataa
a1 No. of protein interaction partners for duplicate gene 1
a2 No. of protein interaction partners for duplicate gene 2
s No. of shared partners between gene 1 and gene 2
t(⫽a1⫹a2⫺s) Total no. of nonredundant partners for gene 1 and gene 2
A Average no. of partners per singleton gene
S Average no. of shared partners per randomly picked singleton pair
T Average total no. of nonredundant partners per randomly picked singleton pair ␦(⫽兩a1⫺a2兩) Absolute difference betweena1anda2
min (a1,a2) The smaller ofa1anda2 max (a1,a2) The bigger ofa1anda2
dS No. of synonymous substitutions per synonymous site between a pair of duplicates
ISF[⫽1⫺(s⫹ ␦)/t] Subfunctionalization index
SF Subfunctionalization
NF Neofunctionalization
SNF Subneofunctionalization
aThe number of interaction partners is substituted by the number of expression sites when human gene
spatial expression pattern is concerned.
appeared in our protein interaction data set and these parametric Mann-WhitneyU-test (P⬍0.0001). This ob-servation is inconsistent with the pure SF model and genes were subjected to further analysis.
For a given pair of duplicates, let a1 and a2 be the indicates the occurrence of NF.
To estimate the speed with which NF occurs, we com-numbers of interaction partners for each of them, and
lets be the number of shared partners between them puted the number of synonymous substitutions per syn-onymous site (dS) between duplicate genes. Because
(Table 1). Thus,t⫽a1⫹a2⫺sis the total number of
partners for the pair. Immediately after gene duplica- synonymous changes are largely neutral and occur at an approximately constant rate,dSis widely used as a proxy
tion, the two daughter genes have the same interaction
partners. Under the SF model, each daughter gene grad- for time (LynchandConery2000;Wagner2001;Guet al.2002;Pappet al.2003). However, because estimates ually loses partners, but t remains constant over time
(Figure 1). Furthermore,tshould equal the number of ofdS⬎1 are associated with large stochastic errors and
tvaries substantially among duplicate pairs, we grouped partners that the progenitor gene had before
duplica-tion. We found that the meantfor duplicate genes is the 331 gene pairs into four bins according todS (see materials and methods). We found thattanddSare
8.57 ⫾ 0.64, which is significantly greater than A ⫽
4.69 ⫾ 0.30, the number of interaction partners that positively correlated (Spearman’s rank correlation co-efficientr⫽0.14,n⫽331,P⫽0.01). Furthermore, the an average singleton gene has (P⬍0.0001,t-test). The
statistical significance was further confirmed by the non- meantper bin increases withdS(linear correlationr⫽
Figure2.—Number of protein interaction partners of yeast dupli-cate and singleton genes. (a) Mean number of partners (t) for duplicate pairs with different dS. The error bar shows one standard error of the mean. The dashed line shows the average number of part-ners per singleton (A) and the dot-ted line shows the average number per random pair of singletons (T). There are 17, 15, 70, and 229 dupli-cate pairs in the four bins, respec-tively. (b) Frequency distributions of the number of interaction part-ners for singletons (open bars), singleton pairs (shaded bars), and duplicates (solid bars). (c) Fre-quency distributions of the num-ber of shared partners between singleton pairs (open bars), dupli-cates withdS⬍20 (shaded bars), and duplicates withdS⬎20 (solid bars). (d) Difference in the num-ber of partners between duplicates. The mean max(a1,a2), min(a1,a2), and ␦ ⫽ |a1 ⫺ a2| for duplicates are shown in open, shaded, and solid bars, respectively, with their corresponding mean values from random singleton pairs shown by the dotted, dashed, and solid lines, respectively. For any given pair of duplicates,a1anda2are the numbers of partners that they each have.
0.987 between meantanddScategory,P⬍0.01; Figure combining bins with expectations⬍5,P⫽ 0.0013)
sig-nificantly better than the singleton distribution (2 ⫽
2a). When dS ⬍ 0.25, mean t is 5.76 ⫾ 0.96, ⵑ23%
greater thanA. For duplicates withdSbetween 0.25 and 275.11, d.f.⫽14 after combining bins with expectations
⬍5,P⫽1.8⫻10⫺50). Furthermore, the median for the
1, meant is 7.07⫾0.85,ⵑ51% higher thanA,
suggest-ing gain of numerous new protein partners by this time. duplicate gene distribution (5) is much closer to the singleton-pair distribution (6) than to the singleton dis-An earlier study established that dS ⫽ 1 corresponds
approximately to a gene age of 100 million years (MY) tribution (2; Figure 2b). These results show that the larger number of partners for duplicates than for single-in yeasts (WolfeandShields1997). Thus, our results
suggest that many new protein interactions have tons is not due to the presence of a few outliers, but reflects a general trend for most duplicate genes. emerged 25–100 MY after duplication and that NF
con-tinues to occur even long after duplication (i.e., when Can NF alone explain the observed protein interac-tion pattern? As meninterac-tioned earlier, we consider three
dS ⬎ 1). To compare duplicates with singleton genes,
we randomly drew 4000 pairs of singletons with replace- NF models in which the duplicate gene that acquires new function could retain all, none, or some of the ment from our sample of 745 singletons and estimated
that the meantfor singleton pairs wasT⫽9.29⫾0.17. ancestral functions, respectively (Figure 1). If all ances-tral functions are retained by this gene (NF-I),sshould Interestingly, for duplicates withdS⬎20, the meantis
9.16 ⫾ 0.80, virtually identical to T (P ⬎ 0.5, t-test), be a constant equal to the number of partners of the progenitor gene before duplication. That is, meansfor indicating that eventually the total number of partners
for a duplicate pair is almost the same as that for two duplicates is expected to equalA. In fact, means⫽1.02⫾ 0.14, ⵑ22% of and significantly smaller than A (P ⬍
singletons.
The observed high meantin duplicates and the rejec- 10⫺14,t-test), which strongly rejects the NF-I model. On
the other hand, means is significantly⬎0 (P⬍ 10⫺11,
tion of the pure SF model for the genome as a whole
could be due to a small number of outliers with huge t-test), suggesting that duplicate genes share partners. From the 4000 randomly chosen pairs of singletons, we NF. To examine this possibility, we compared the
distri-butions of the number of partners for singleton genes, estimated that the mean s for singleton pairs is S ⫽
0.028⫾0.003, significantly smaller than the meansfor randomly paired singleton gene pairs, and duplicate
gene pairs (Figure 2b). The latter two distributions are duplicates (P ⬍ 10⫺10, t-test). We also compared the
distribution ofsfor duplicates and for random pairs of much more similar to each other than each of them is
to the first distribution. The duplicate gene data fit the singletons. Significant differences were observed re-gardless of whether duplicates withdS⬍20 ordS⬎ 20
were considered (P ⬍ 10⫺65, 2-test; Figure 2c). The of NF in these relatively young duplicates. Since SF is
completed whendSreaches 0.25, it may be inferred that
finding that duplicates share more protein partners
than random pairs of singletons do even long after du- the averageISFfor all duplicates isⵑ0.5. This level of SF
is substantial, as random partition of ancestral partners plication strongly rejects the NF-II model, which
pre-dictss⫽0. The distributions ofs(Figure 2c) also indi- between a duplicate pair with t⫽ 5 and s ⫽ 1 results in an expectedISFof 0.5.
cate that the rejection of NF-I and NF-II is not due to
a small number of outliers, because 35% of duplicates The demonstration of both NF and SF from the geno-mic data could be due to the presence of some genes
vs.2.4% of singleton pairs share partners. It is important
to note that the mean s for the duplicates with dS ⬍ following NF and some other genes following SF. We
think that this explanation is unlikely to be correct be-0.25 already reduces to 1.0, virtually identical to the
means(1.1) for duplicates withdS⬎20. This indicates cause it cannot explain the observation that the
genome-wide average number of protein interaction partners that the reduction ofsby loss of partners has already
been completed when dS reaches 0.25, in agreement per duplicate pair is equivalent to that for two
single-tons. Furthermore, it cannot explain the virtually maxi-with previous observations from fewer data (Wagner
2001). There is no detectable difference in the propor- mum level of SF (as reflected by ISF) observed for the
genome-wide data. Rather, our observations suggest that tion of shared partners between duplicate genes with
more partners and those with fewer partners. the majority of duplicate genes undergo both SF and NF. Thus, we propose a new model termed SNF to Let us denotea1the number of partners for the gene
retaining all the ancestral functions in the three NF account for the evolutionary changes in interaction part-ners after gene duplication. This model easily explains models anda2the corresponding number for the gene
acquiring new functions. We observed an increase in the increase of meantover time by NF and the decrease of meansto a level that is between 0 andAby incomplete the meant afterdS⬎ 0.25 (Figure 2a), indicating the
occurrence of NF after the completion of the loss of SF. This incompletion may have arisen from shared structural constraints between duplicates. Under gen-partners in the second gene. Under the NF-III model,
this will render the absolute difference betweena1and eral models of SNF in which SF and NF occur more or
less randomly between the two duplicates, max(a1,a2)
a2(␦ ⫽|a1⫺a2|) smaller for a period of time, because
the deduction of a2 by loss of partners has made it and␦should both be raised by NF after the end of the
SF process, as observed in this study. Similar to NF-III, smaller thana1, and the subsequent increase of a2 by
NF will reduce the difference between them. However, the SNF model predicts an increase of min(a1, a2) by
continuous NF after the completion of SF. However, contradictory to the prediction of NF-III, mean ␦
in-creases steadily withdS(Figure 2d). The linear correla- given the same amount of rise in t, the increase in
min(a1, a2) is expected to be slower under SNF than
tion between mean␦and thedScategory isr⫽0.954 (P⬍
0.05) and the Spearman’s rank correlation between␦ under NF-III. This is because in SNF only 50% of NF is expected to occur in the gene with the smaller number anddSisr⫽0.15 (n⫽ 331,P⫽0.005). Furthermore,
NF-III predicts that min(a1, a2), the smaller ofa1 and of partners and to raise min(a1,a2). By contrast, under
NF-III, one daughter gene does not change at all while
a2, should increase withdSunder this condition because
a1 is constant anda2 increases by NF. But this was not the other loses many partners and then gains new
part-ners, leading to a situation where almost all NF will observed (Figure 2d), as neither the linear correlation
between mean min(a1, a2) and the dS category (r ⫽ raise min(a1,a2). Given this comparison, the negligible
increase in min(a1,a2) is not incompatible with the SNF
0.450, P ⬎ 0.2) nor the Spearman’s rank correlation
between ␦ and dS (r ⫽ 0.085, n ⫽ 331, P ⬎ 0.10) is model, though a further test with more data is needed.
Our results suggest that SF occurs rapidly after duplica-significant. NF-III also predicts that max(a1, a2), the
bigger ofa1anda2, should stay constant for a period of tion, as the meansreduces from the expected value of
4.69 immediately after duplication to a final value of time after the first bin, becausea2 ⬍ a1 due to loss of
partners anda1does not change by NF. But max(a1,a2) ⵑ1 beforedSreaches 0.25. At that time, the meanthas
increased by only 23%, and it continues to rise even was found to increase withdS steadily (Figure 2d). The
linear correlation between mean max(a1,a2) and thedS whendS⬎ 20, to a final value that is ⵑ1.96 times that
before duplication. category is r⫽ 0.998 (P ⬍ 0.01) and the Spearman’s
rank correlation between max(a1,a2) anddSisr⫽0.14 Analysis of human gene expression data: Although
the protein-protein interaction data provide key infor-(n ⫽331,P ⫽ 0.01). Thus, NF-III is not supported by
the observations. mation on gene function, temporal and spatial patterns of gene expression offer other important aspects of gene The rejection of all three NF models is due to the
presence of SF. When there is no NF, the level of SF function. Furthermore, one version of the SF hypothesis was specifically proposed to explain the change in gene can be measured byISF⫽1⫺(s⫹ ␦)/t(seematerials
and methods).ISFvaries from 0 for no SF to 1 whens⫽0 expression after duplication (Forceet al.1999).
There-fore, it is necessary to evaluate the SF and NF models anda1 ⫽ a2. We estimated that ISF⫽ 0.51 ⫾ 0.08 for
a multicellular organism. We analyzed a large data set that included the expression levels of 7565 human genes in 25 independent and nonredundant tissues (Suet al.
2002). Using conventional criteria, we transformed the quantitative expression levels to discrete expression terns (expressed or unexpressed). The expression pat-terns of 515 singletons and 1230 pairs of duplicate genes were analyzed.
All the notations defined above can be used for the expression data if we replace the number of interaction partners by the number of expression sites. We found that the number of expression sites per duplicate pair (mean t ⫽ 13.04 ⫾ 0.26) is significantly greater than that per singleton gene (A⫽ 8.85 ⫾ 0.43; P ⬍ 10⫺17,
t-test;P⬍0.0001, Mann-WhitneyU-test). This rejects the pure SF model that predicts equal mean t and A. To examine how t increases over time since duplication, we again useddSbetween duplicates as a proxy for time
[dS ⫽ 1 in mammals corresponds to ⵑ250 MY after
duplication (Kumar andSubramanian 2002)]. To re-duce random fluctuations, we grouped the duplicates into seven bins by theirdSvalues (Figure 3a). Each of
the first six bins contains 100 pairs of duplicates whereas the seventh bin includes the remaining 630 duplicates. We lumped the final 630 gene pairs into one bin because theirdSvalues are so large (⬎3.06) that their estimates
have substantial variances. We found that tanddSare
positively correlated (Spearman’s rank correlation coef-ficientr⫽0.07,n⫽1230,P⫽0.01). Furthermore, the meantper bin increases withdS(linear correlationr⫽
0.647 between meantanddScategory,P⬍0.03; Figure
2a). In the first bin (0 ⬍ dS⬍ 0.68, with a median of
0.18), meantis 10.28⫾0.93, 16% greater thanA. The second bin (0.71⬍dS⬍1.64, with a median of 1.35) has
Figure3.—Number of expression sites of human duplicate a meantof 10.97⫾ 0.89, 24% greater thanA. By this
and singleton genes. (a) Mean number of expression sites time, acquisition of new expression sites is substantial.
(t, squares) and mean number of shared expression sites (s, To compare duplicates with singletons, we randomly drew circles) for duplicate pairs with differentd
S. The 1230
dupli-3500 pairs of singletons with replacement from our sam- cate gene pairs are ranked by theird
S. Each square (or circle)
ple of 515 singletons and estimated that the meantfor represents the mediandS and meant (or mean s) for 100 gene pairs, with the exception of the last square (or circle), singleton pairs is T ⫽ 14.47 ⫾ 0.16. This number is
which is derived from 630 gene pairs. The error bar shows substantially⬍2A⫽17.70 because two randomly picked
one standard error of the mean. The dashed line shows the singletons share on averageS⫽3.17⫾0.10 expression average number of expression sites per singleton (A) and the sites. We noted that in the third bin (1.94⬍dS⬍2.23, dotted line shows the average number per random pair of
with a median of 1.80), meant(13.09 ⫾0.88) already singletons (T). The solid line shows the average number of shared expression sites per random pair of singletons. (b) approachesT(P⬎ 0.05,t-test), indicating that by this
Difference in the number of expression sites between dupli-time the total number of expression sites for a duplicate
cates. The mean␦ ⫽|a1⫺a2| and min(a1,a2) for duplicates
pair is indistinguishable from that for two singletons.
are shown in squares and circles, respectively, with their corre-We next examined the three NF models. NF-I predicts sponding mean values from singleton pairs shown by the dot-that the number of shared expression sites between a ted and dashed lines, respectively. For any given pair of dupli-cates,a1anda2are the numbers of expression sites that they
duplicate pair (s) is a constant that equals the number
each have. of expression sites of the progenitor gene before
dupli-cation (Figure 1). We found that means⫽3.45⫾0.18, ⵑ39% of and significantly lower than A (P ⬍ 10⫺25,
other bin or fromS(P⬎0.1,t-test). This indicates that
t-test), which strongly rejects the NF-I model. Figure 3a
the loss of expression sites has been completed before shows that means declines quickly from the expected
dSreaches 0.68. Under NF-II and NF-III, the continuous
value of 8.85 right after duplication to ⵑ3.25 ⫾ 0.68
growth oftis entirely due to NF in the gene that first for the first bin (dS ⬍ 0.68). This value is no longer
that min(a1,a2) should continuously rise after the first to be misclassified as singletons due to the low power
of BLAST in finding highly divergent paralogs. Further-bin, to the expected value Min, which is the mean
mini-mum for randomly picked pairs of singletons and is more, the evolutionary rate has at most a weak negative correlation with the number of interaction partners (
Fra-estimated to be 3.64 ⫾ 0.11. But, in fact, the mean
min(a1,a2) for the first bin is already 3.53⫾0.69, not seret al.2002;Jordanet al.2003;Hahnet al.2004) and
the difference observed by Davis and Petrov (2004) significantly different from Min (P⬎ 0.1,t-test; Figure
3b). Furthermore, the two models predict that after the seems much too small to explain the twofold difference between meant(for ancient duplicates) andA. No bias first bin␦ ⫽|a1⫺a2| will decrease for a period of time
and then increase as NF continues, but this was again in the comparison of expression sites between duplicate genes and singleton genes is expected because house-not observed. Instead,␦increases continuously withdS
(linear correlationr⫽0.887 between␦anddScategory, keeping genes (with high numbers of expression sites)
and tissue-specific genes are known to have similar rates
P⬍0.01; Spearman’s rank correlationr⫽0.09 between
␦ anddS, n ⫽ 1230,P ⫽ 0.001; Figure 3b). Taken to- of duplication (Zhang and Li 2004). Nonetheless, it
remains possible that our results have been biased quan-gether, none of the three NF models adequately
de-scribe the evolutionary patterns of human gene expres- titatively, if singleton genes and duplicate genes indeed have somewhat different properties (X.Heand J.Zhang, sion. Rather, they are compatible with the SNF model
with contributions of both NF and SF, for the same reasons unpublished data). But the bias, even if it exists, is un-likely to be large enough to alter our conclusions quali-aforementioned for the protein interaction data.
tatively. In the analysis, we also assumed that duplicate genes cannot independently acquire the same new func-DISCUSSION
tions after duplication. Although this assumption may not be true for every duplicate pair, it is likely correct In this work we used functional genomic data to study
the evolutionary mechanisms underlying the divergence for the majority of them. In fact, the negligible number of shared protein partners between random pairs of of duplicate genes. Because functional divergence may
occur by either SF or NF, it is important to separate singletons (S⫽0.028⫾0.003) supports our assumption. For the gene expression data, however, our assumption them explicitly. Our results show that the pure SF or
NF model is inadequate to explain the genomic patterns may be less robust due to the limited number of tissues and NF might have been underestimated.
of protein interaction or gene expression for duplicate
genes. Rather, a large proportion of duplicate genes Our analyses show that both SF and NF play promi-nent roles during functional divergence of duplicate undergo rapid SF, accompanied by prolonged and
sub-stantial NF. The large-scale protein interaction and gene genes and that most duplicate genes follow the new SNF model. Our results do not exclude the possibility that expression data likely contain some false-positive and
false-negative errors. If the data are entirely random a minority of duplicate genes evolve by pure SF or pure NF. We found that SF occurs rapidly after gene duplica-without any biological reality, we expect to see similar
behaviors between duplicates and random pairs of sin- tion, whereas NF is a lengthy process that continues even long after duplication. Thus, the short-term retention of gletons. This, however, is not the case. For example,sis
significantly higher in duplicate genes than in singleton duplicate genes in the genome is primarily due to SF, consistent with a much higher rate of degenerate muta-pairs for the yeast protein interaction data (Figure 2c)
and␦ is significantly lower in duplicate genes than in tions than beneficial mutations (Walsh 1995; Lynch
andForce2000). Preservation of the duplicate genes singleton pairs for the human gene expression data
(Fig-ure 3b). Most importantly, experimental errors, whether in the genome and partial functional relaxation caused by loss of ancestral functions subsequently provide the negative or positive, cannot generate the positive
corre-lation betweentanddSfor either data set. In this work, opportunity for advantageous mutations, which can lead
to new functions. The SNF model is supported by the several properties were compared between duplicate
genes of different ages. This comparison would be bi- genome-wide evolutionary pattern of regulatory se-quences of duplicate genes in yeasts (Pappet al.2003). ased if duplicate genes of different ages represent
differ-ent types of genes (in terms of gene function).Lynch The model is also consistent with accelerated sequence evolution immediately after gene duplication (Ohta1994; andConery (2000) showed that duplicate genes
des-tined to die usually die in a few million years after dupli- Lynch and Conery 2000; Van de Peer et al. 2001;
Kondrashov et al. 2002). Although this acceleration cation. Thus, except for a small number of genes in the
first bin of Figure 2a (or Figure 3a), duplicates analyzed may be explained by either reduction of purifying selec-tion or acselec-tion of positive selecselec-tion (Zhanget al.1998), here are stably retained in genomes and they should
be comparable. We also compared singleton genes with our observation of rapid SF suggests the former as the primary cause. This general pattern does not preclude duplicate genes in this work. A recent study in yeasts
suggested that genes of low evolutionary rates are more the possibility of positive selection occurring immedi-ately after duplication, as has been observed in a few likely to duplicate than those with high rates (Davis
Kondrashov, F. A., I. B. Rogozin, Y. I. Wolf andE. V. Koonin, that positive selection may play a long-lasting role in
2002 Selection in the evolution of gene duplications. Genome the divergence of duplicates. Biol.3:RESEARCH0008.1–0008.9.
Kumar, S., andS. Subramanian, 2002 Mutation rates in mammalian The finding that the total number of interaction
part-genomes. Proc. Natl. Acad. Sci. USA99:803–808. ners and total number of expression sites for duplicates
Lynch, M., andJ. S. Conery, 2000 The evolutionary fate and conse-approximate those of randomly picked singleton pairs quences of duplicate genes. Science290:1151–1155.
Lynch, M., andJ. S. Conery, 2003 The origins of genome complex-demonstrates enormous NF in duplicate genes. This,
to-ity. Science302:1401–1404. gether with the similar NF patterns observed in a
verte-Lynch, M., andA. Force, 2000 The probability of duplicate gene brate (small population size) and a fungus (large popu- preservation by subfunctionalization. Genetics154:459–473.
Makova, K. D., andW. H. Li, 2003 Divergence in the spatial pattern lation size), suggests that passive evolution (Lynchand
of gene expression between human duplicate genes. Genome Conery2003) cannot fully explain the origin of genome
Res.13:1638–1645.
complexity. Gene duplication is responsible for the ori- Moore, R. C., andM. D. Purugganan, 2003 The early stages of duplicate gene evolution. Proc. Natl. Acad. Sci. USA100:15682– gins of at least one-third of yeast genes (seematerials
15687. and methods), without which the yeast protein
interac-Ohno, S., 1970 Evolution by Gene Duplication. Springer-Verlag, New tion network would be reduced substantially. If we as- York.
Ohno, S., 1973 Ancient linkage groups and frozen accidents. Nature sume that the rate of gene duplication is 1% per gene
244:259–262. per million years (LynchandConery2000) andⵑ10%
Ohta, T., 1994 Further examples of evolution by gene duplication of duplicate genes are stably retained in the genome revealed through DNA sequence comparisons. Genetics 138:
1331–1337. (Kelliset al.2004), the total number of functions of a
Papp, B., C. PalandL. D. Hurst, 2003 Evolution of cis-regulatory genome can double in 700 MY simply by individual gene elements in duplicated genes of yeast. Trends Genet.19:417–422. duplication. Extrapolated to mammals, ⵑ10,000 new Stoltzfus, A., 1999 On the possibility of constructive neutral
evolu-tion. J. Mol. Evol.49:169–181. protein-protein interactions would have evolved in
hu-Su, A. I., M. P. Cooke, K. A. Ching, Y. Hakak, J. R. Walkeret al., mans since they diverged from mice via gene duplica- 2002 Large-scale analysis of the human and mouse transcriptomes. tion alone. Thus, gene duplication plays an essential Proc. Natl. Acad. Sci. USA99:4465–4470.
Thompson, J. D., D. G. HigginsandT. J. Gibson, 1994 CLUSTAL W: role in the evolution of new functions.
improving the sensitivity of progressive multiple sequence align-We thank D. J. Futuyma, D. O´ Foighil, Y.-L. Qiu, A. P. Rooney, ment through sequence weighting, positions-specific gap penal-ties and weight matrix choice. Nucleic Acids Res.22:4673–4680. members of the Zhang lab, and two anonymous reviewers for valuable
Van de Peer, Y., J. S. Taylor, I. BraaschandA. Meyer, 2001 The comments on earlier versions of this article. This work was supported
ghost of selection past: rates of evolution and functional diver-by a start-up fund of the University of Michigan and diver-by a research
gence of anciently duplicated genes. J. Mol. Evol.53:436–446. grant (GM67030) from National Institutes of Health to J.Z.
von Mering, C., R. Krause, B. Snel, M. Cornell, S. G. Oliver
et al., 2002 Comparative assessment of large-scale data sets of protein-protein interactions. Nature417:399–403.
Wagner, A., 2001 The yeast protein interaction network evolves LITERATURE CITED rapidly and contains few redundant duplicate genes. Mol. Biol.
Evol.18:1283–1292.
Davis, J. C., and D. A. Petrov, 2004 Preferential duplication of
Wagner, A., 2002 Asymmetric functional divergence of duplicate conserved proteins in eukaryotic genomes. PLoS Biol.2:318–326. genes in yeast. Mol. Biol. Evol.
19:1760–1768.
Force, A., M. Lynch, F. B. Pickett, A. Amores, Y. L. Yanet al., 1999
Wagner, A., 2003 How the global structure of protein interaction Preservation of duplicate genes by complementary, degenerative networks evolves. Proc. R. Soc. Lond. Ser. B Biol. Sci.270:457–
mutations. Genetics151:1531–1545. 466.
Fraser, H. B., A. E. Hirsh, L. M. Steinmetz, C. ScharfeandM. W. Walsh, J. B., 1995 How often do duplicated genes evolve new func-Feldman, 2002 Evolutionary rate in the protein interaction net- tions? Genetics139:421–428.
work. Science296:750–752. Wolfe, K. H., and D. C. Shields, 1997 Molecular evidence for
Gu, Z., D. Nicolae, H. H.-S. LuandW. H. Li, 2002 Rapid divergence an ancient duplication of the entire yeast genome. Nature387: in expression between duplicate genes inferred from microarray 708–713.
data. Trends Genet.18:609–613. Wright, F., 1990 The “effective number of codons” used in a gene.
Hahn, M. W., G. C. ConantandA. Wagner, 2004 Molecular evolu- Gene87:23–29.
tion in large genetic networks: Does connectivity equal con- Yang, Z., 1997 PAML: a program package for phylogenetic analysis straint? J. Mol. Evol.58:203–211. by maximum likelihood. Comput. Appl. Biosci.13:555–556.
Hughes, A. L., 1994 The evolution of functionally novel proteins Zhang, J., 2003 Evolution by gene duplication—an update. Trends after gene duplication. Proc. R. Soc. Lond. Ser. B Biol. Sci.256: Ecol. Evol.18:292–298.
119–124. Zhang, J., H. F. RosenbergandM. Nei, 1998 Positive Darwinian
Johnson, M. E., L. Viggiano, J. A. Bailey, M. Abdul-Rauf, G. Good- selection after gene duplication in primate ribonuclease genes. winet al., 2001 Positive selection of a gene family during the Proc. Natl. Acad. Sci. USA95:3708–3713.
emergence of humans and African apes. Nature413:514–519. Zhang, J., Y.-P. ZhangandH. F. Rosenberg, 2002 Adaptive
evolu-Jordan, I. K., Y. I. WolfandE. V. Koonin, 2003 No simple depen- tion of a duplicated pancreatic ribonuclease gene in a leaf-eating dence between protein evolution rate and the number of protein- monkey. Nat. Genet.30:411–415.
protein interactions: only the most prolific interactors tend to Zhang, L., and W. H. Li, 2004 Mammalian housekeeping genes evolve slowly. BMC Evol. Biol.3:1. evolve more slowly than tissue-specific genes. Mol. Biol. Evol.21:
Kellis, M., B. W. BirrenandE. S. Lander, 2004 Proof and evolu- 236–239. tionary analysis of ancient genome duplication in the yeast