Project Title:
Date:
Organization:
FY 2006
NCDOT
Technical Assistance Project Number 2006-02
PAVEMENT MARKINGS RESEARCH PLAN
March 8, 2011
Department of Civil, Construction, and Environmental Engineering
North Carolina State University
_________________________________________ William Rasdorf, Ph.D., PE
Department of Civil, Construction, and Environmental Engineering
North Carolina State University Raleigh, NC 27695-7908
1.0 INTRODUCTION
Currently, the Work Zone Traffic Control Unit of NCDOT (WZTCU) has several years of pavement markings retroreflectivity data collected by a private contractor, Precision Scan LLC. The WZTCU requested that Dr. William Rasdorf at North Carolina State University assist the unit in developing a pavement markings research plan outlining how the pavement markings data could be analyzed in order to find relationships between pavement markings retroreflectivity values and variables such as marking color, marking age, and pavement surface. Such an analysis will aid the WZTCU in better understanding pavement marking performance and assist NCDOT in better decision-making with respect to this asset.
2.0 OVERALL RESEARCH PLAN OBJECTIVES The objectives of this research plan are as follows: Material Performance
• Evaluate the retroreflectivity (RL) performance of pavement markings based on their
installation and material characteristics.
• Determine rates, relationships, and correlations between analysis variables.
• Predict the life of pavement markings, based on deterioration rate and FHWA/NCDOT minimums.
• Identify, quantify, and analyze potential sources of pavement marking damage (e.g., snow plows) and the impact on material performance.
Asset Management
• Establish a minimum standard for retroreflectivity that meets FHWA and NCDOT requirements.
• Determine the proportion of markings that are below the minimum standards. • Create a pavement marking lifetime performance model.
• Evaluate the use of a Brightness Benefit Factor (BBF) and other cost analysis methods as asset management tools.
• Determine future NCDOT data collection needs.
• Create a pavement marking selection and replacement tool and/or guidelines.
In order for NCDOT to better understand the performance of different types of pavement markings, the deterioration in RL over time will need to be evaluated. Also, correlations found
between RL and other factors, such as traffic levels and installation date, can be used by NCDOT
to better predict when markings will need to be replaced. The replacement decision will be dependent on NCDOT’s developed RL deterioration over time rates and FHWA’s or NCDOT’s
minimum RL standards.
establishing pavement marking selection and replacement guidelines. By analyzing the pavement marking RL and characteristics data, NCDOT may identify additional data items that
can be collected to further understand pavement marking deterioration behavior.
3.0 MAJOR ANALYSIS VARIABLES
Major analysis variables are those variables that define the basic characteristics of a pavement marking and have a known impact on lifetime performance. The major pavement marking variables to be used in the pavement marking performance analysis have been divided into three categories. These are: materials, location and application, and attributes.
Materials
• Marking material types (polyurea, thermoplastic, hot spray thermoplastic, paint, epoxy) • Material thickness
• Material width
• Bead types (NC standard, large bead, highly reflective elements) Location and Application
• Surface (asphalt, concrete) • Line type (solid, skip) • Line location (edge, center)
• Marking thickness (thermoplastic only) Attributes
• Retroreflectivity • Type (long-line) • Color (yellow, white) • Age
The materials variable category contains the type of pavement marking material, the type of reflective beads used, and the physical measurements of the marking. The location and application category includes variables related to how the pavement marking is applied, what surface it is applied to, and where on the road it is applied. The attributes category consists of the retroreflectivity, the type of pavement marking (long-line), the color of the pavement marking (typically yellow or white) and the marking’s age, which is determined from its date of installation.
4.0 OTHER ANALYSIS VARIABLES
The other analysis variables are characteristics of a pavement marking that may or may not determine the lifetime of a pavement marking and are often interrelated to each other. These other analysis variables include the following:
• Road types (interstate, primary, secondary) • Road traffic levels (AADT)
o Marking material o Bead
• Installation contractor • Snowplowing rate • Exposure temperature
• Exposure condition (road salts, saltwater, etc.) • Installation surface temperature
• Installation date/time of year • Cost
Road type and road traffic level are two analysis variables that are related to one another. The road type is used to establish priority and minimum reflectivity standard, while the AADT is intended to establish the amount of use. An interstate road is more likely to have high AADT values and higher travel speeds than a secondary road. Also, certain installation contractors may work in one or more regions of the state using one or several different marking material and bead manufacturers. Snowplowing rate, installation surface temperature, and installation date can also be related to regional climate differences. The cost of a pavement marking is partially dependent on the installation contractor and the marking and bead manufacturer.
There are other analysis variables that will not be considered at this time. These relate to human factors such as driver age, vehicle type, and light source. All of these factors impact the level of the minimum standard required. However, the FHWA is researching this area extensively. It is expected that the FHWA will set guidelines as to what the minimum standards will be based on extensive research of the human factors.
5.0 EXPECTED TASKS
Upon receipt of the “call for research ideas” a schedule and budget will be developed to effectively administer this research project. Most likely the research schedule will take two years. Additionally, the research budget will need to consider the number of research assistants and the expense of research-related travel.
Once the administrative details of the research are finalized the first step to this project is to determine what is the existing knowledge base in pavement retroreflectivity and management of pavement marking. This will start with an in-depth literature review.
Next would be the analysis of existing data. This would require identifying and organizing the existing data and determining what additional data is required. From here, an assessment can be made as to what data should be collected in the future. Based on the available data a full analysis of the pavement marking performance will be conducted.
After analyzing the data a model of pavement marking lifetime performance, for all the combinations of variables with an impact on performance will be prepared. The primary objective of the model is to predict the performance of pavement markings with respect to time given the various combinations of variables. The model will be validated against existing conditions and the knowledge of experts in the field.
incorporates the recommendations and guidelines and uses the prediction model to enable managers to effectively manage this asset.
If NCDOT were to begin to research pavement marking performance, the following tasks are suggested:
Knowledge Base
• Conduct a literature review of similar efforts and research
• Evaluate the retroreflectivity data collection method and compare to industry standard • Evaluate the current visual inspection method and compare to industry standard Organize and Analyze Data
• Collect and organize data from Precision Scan and other available sources • Establish analysis variables
o List all possible variables o Discuss and evaluate variables
o Select realistic and applicable variable values
• Find deterioration and damage relationships of pavement markings
o Examine RL (retroreflectivity) over time and in relation to other variables
o Determine R2 (data scatter)
o Select deterioration and damage models o Correlate RL with other analysis variables
Develop Model
• Develop pavement marking lifetime performance model for predictions • Validate model
• Design pavement marking test area (Pavement-Line Farm) o Experimental field used to validate model
o Includes all combinations of variables o Requires periodic traffic counts
o Requires periodic Retroreflectivity (RL) counts
Recommendations, Guidelines, and Tools
• Develop pavement marking selection guidelines for NCDOT o Selection criteria
o Predicted lifespan
• Develop GIS management tool using ARCGIS • Report the analysis findings to NCDOT
An evaluation of the both the current NCDOT visual inspection program and the method used by Precision Scan to establish the retroreflectivity of pavement markings will be conducted and compared to the industry standards determined in the literature review.
The analysis data will need to be collected from data currently held by NCDOT as well as data in CD format from Precision Scan LLC. Data may also need to be collected from outside sources, such as when trying to determine the surface temperature when a pavement marking was installed.
After all of the data has been gathered, the variables to be used in the analyses need to be determined. First, all possible analysis variables should be listed and then discussed to identify the variables NCDOT is most interested in exploring. For an example and discussion of possible variables, see Sections 3 and 4 of this plan. Then for the selected analysis variables, the ranges of values to be used in analysis need to be selected based on what is realistic and possible considering available data. For example, a decision would need to be made on whether to analyze installation date data on a day, month, or seasonal basis.
Once the analysis variables are established, the data analysis can begin by examining relationships between pavement marking performance and the major analysis variables such as those listed in Section 3. The primary relationship to be analyzed is between pavement marking retroreflectivity (RL) and time.
Since a great deal of data already exists an evaluation of mathematical models seems to be the best approach and will be the primary starting point for determining the most appropriate model. However, alternate modeling techniques could be evaluated to determine the best approach before starting the in-depth development of the models.
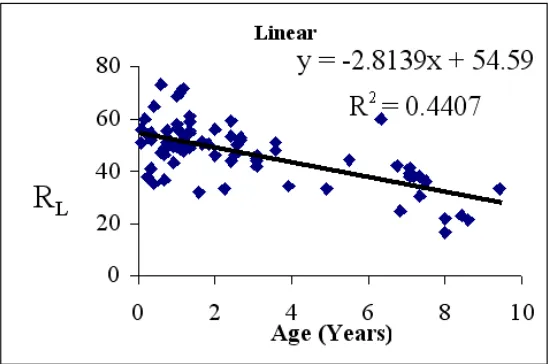
Figure 1 - Sample Mathematical relationship of RL v. Time
If a mathematical model is determined to be the best approach, the relationship could be evaluated by plotting RL versus time such as shown in Figure 1. The Figure 1 data points are
exponential curves will all be evaluated to determine the most appropriate mathematical model used for the given set of variables.
The data can also be analyzed to determine the rate of pavement marking damage due to traffic levels and snowplow frequency. After the retroreflectivity deterioration with time and damage rates are determined, the data can be evaluated to find if correlations between RL and other
analysis variables, such as road type or manufacturer, exist.
Once the major marking, color, bead, and surface types have been analyzed, the curves and models determined from the analysis can be refined to predict pavement-marking behavior in the field. The predictions can be made using a lifetime performance model that forecasts the retroreflectivity values of new or existing pavement markings and how many of them will be replaced each year due to damage or below-standard retroreflectivity. Once a model is developed, its predictions can be validated against an independent set of pavement marking data collected in the field.
An additional validation step to the model may include the design and construction of a pavement marking test area (Pavement-line Farm) that can be used to measure the performance of the model against data collected in a controlled environment.
The results of the data analysis and model would be used to develop pavement marking recommendations and selection guidelines for NCDOT based on how different types of pavement markings in different settings were determined to deteriorate or be damaged. These selection guidelines can be used to better inform the pavement marking decisions of department, division, and district personnel. All of the analysis methods and findings should be documented in a NCDOT report for future reference.
The final step would be to develop a GIS tool that would enable pavement marking managers to use ARCGIS and the prediction models to better understand the pavement marking performance. This would enable managers to perform economical and safer management of North Carolina’s pavement markings.
6.0 POTENTIAL PRODUCTS FOR NCDOT
The potential research products that could be developed for NCDOT are:
• Pavement markings condition prediction tool. This product will include a predicted RL
values based on the developed mathematical models established for each set of conditions.
• Summary plots, curves, graphs, and charts of pavement markings analysis data. • Pavement marking selection and management guidelines.
• Recommended future data collection enhancements.
GIS-based representation of pavement markings and all the associated attributes. This will include a date when the RL is predicted to reach the specified minimum standard. Using GIS,
any geolocation can be identified and any parameter of interest may be displayed.
in develop pavement marking selection guidelines and policies. Pavement marking selection guidelines can be developed with the WZTCU based on the research findings and incorporated into an easy to use computer-based pavement marking selection tool. The pavement marking analysis results may also reveal ways in which the WZTCU can improve future data collection efforts in order to learn more about pavement marking performance in NC.
7.0 PLAN NEEDS
In order to execute the pavement marking plan, the following items will be needed:
• Relevant NCDOT and Precision Scan data files (original spreadsheet/database/flat file) • Documentation to accompany data files
• Computer programs to manipulate and analyze data • Meet with Precision Scan
The relevant data files, in the form of a spreadsheet or database, along with any documentation explaining the terms and procedures used in collecting the data, are required for the pavement marking analysis. All computer programs necessary in order to view, sort, analyze, and report the pavement markings data and analysis should be obtained if they are not already available. A meeting with the data collectors will be necessary to sort out any details and provide the researchers an opportunity to establish a working relationship with the data collectors.
8.0 Points of Contact