Growth, Structural, Optical, Thermal,
Mechanical and Non Linear Property of
Ferrous Sulphate Doped Sulphamic Acid
Single Crystal
K.G.Anupriya1 , P. Hemalatha2*
Research Scholar, Research and Development Center, Bharathiar University, Coimbatore, Tamil Nadu, India1
Assistant Professor, Department of Physics, Govt. Arts College, Coimbatore, Tamil Nadu, India2
ABSTRACT: Single crystals of Ferrous Sulphate doped Sulphamic Acid have been grown by slow evaporation technique at room temperature. Structural characterization of grown crystal was carried out using single crystal and powder X Ray Diffraction studies. FTIR study was performed to identify the various functional groups present in the grown crystal. The cutoff wavelength of the grown crystal was found by UV-Vis-NIR spectral studies. Thermal stability of the grown crystal was analyzed from Thermogravimetric Analysis (TGA) and Differential Thermogravimetric Analysis (DTA).The mechanical strength and Second harmonic generation of the grown crystal was determined by Vicker’s Microhardness Test and Kurtz powder technique respectively.
KEYWORDS: Slow evaporation method, XRD, FTIR, TGA, NLO.
I. INTRODUCTION
The search for new Nonlinear Optical materials and improving the properties of existing NLO material is a never ending process due to its wide application in the field of science and technology. In the developing field of optical communications and laser technology, the generation of second harmonics is very essential [1]. A Nonlinear Optical crystal should have high physical and optical properties, non zero NLO coefficient and transparency at required wavelengths to be used in frequency conversion. There should be good transfer of energy between the waves, when optical waves propagate through Nonlinear Optical crystal [2]. Semi organic materials have good chemical flexibility and excellent optical nonlinearity like organic materials and high thermal stability and good transmittance like inorganic materials [3]. Among the inorganic materials Sulphamate derivatives are most suitable for NLO property with its two planar rings configuration and good blue light transmittance [4].
II. RELATED WORK
Non Linear Optical materials have large nonlinearity and are satisfying all the technological requirements for applications such as wide transparency range, fast response and high damage threshold. Inorganic materials have short UV cutoff wavelength and high second order nonlinearity. Among the inorganic materials Sulphamic Acid is most used. The NLO property of all new materials is compared with Potassium Dihydrogen Phosphate (KDP). Pure SA crystals are grown by slow evaporation technique and its thermal and optical behaviours are studied [5]. In a related work, SA is doped with Ferric chloride and crystals are grown by slow evaporation technique. Its characterization confirms the incorporation of dopant into SA. Its NLO activity is 1.5 times that of KDP and its optical and thermal behaviours are good [11].
III. EXPERIMENTAL PROCEDURE
SA : FeSO4 was synthesized using commercially available SA (Lobachemie AR grade) and FeSO4 in the ratio 1:1 at
room temperature by slow evaporation method. Both SA and FeSO4 are dissolved in 20ml of double distilled water
separately. To obtain homogeneous solution, the solutions are mixed together using magnetic stirrer. Then the solution was filtered using filter paper to get a clear solution. The filtered solution was taken in a beaker and closed tightly with perforated Aluminium foil to minimize evaporation. Good transparent single crystals were obtained in a month’s time. The product was further recrystallized for getting pure single crystal. The photograph of the grown crystal is given in fig (1).
Fig (1) SA : FeSO4 crystal grown by slow evaporation technique.
IV. CHARACTERIZATION TECHNIQUES
To determine the lattice parameter values, Single Crystal X-Ray Diffraction is carried out using BRUKER AXS KAPPA APEX II CCD with Shel xtl software. Powder X-Ray Diffraction analysis is done using BRUKER AXS D8 ADVANCE Diffractometer and the 2 and d values are calculated using Difrac Plus software. FTIR spectrum is recorded in the range 500cm-1 to 4000cm-1 using THERMO NICOLET AVATAR 370 to identify the incorporation of FeSO4 in to pure SA. The Optical transmission spectrum is recorded using VARIAN CARRY 300
DIAMOND Thermal analysis system. The microhardness measurement is done using Vicker’s Hardness Tester. To measure SHG efficiency, Kurtz powder technique was performed on grown crystal.
V. RESULTS AND DISCUSSION
1. Single Crystal X-Ray Diffraction
Single Crystal X-Ray Diffraction is carried out using BRUKER AXS KAPPA APEX II CCD with Shel xtl software. Both Pure SA and SA: FeSO4 crystallizes into orthorhombic structure. The lattice parameters are given in table (1). The
variations in lattice parameters and cell volume of the grown crystal may be attributed to the incorporation of dopants into SA crystal lattice.
Table (1) shows the lattice parameters of pure & FeSO4 doped SA. Both are having orthorhombic structures with
different cell parameters and cell volume.
Parameter Pure SA SA:FeSO4
a A0 8.100 8.1092
b A0 8.049 8.0613
c A0 9.220 9.2417
V A03 604.8 604.14
Table (1) Lattice parameters of pure & FeSO4 doped SA.
2. Powder X-Ray Diffraction Analysis
Powder X-Ray Diffraction analysis of FeSO4 doped SA is done using BRUKER AXS D8 ADVANCE Diffractometer and the 2 and
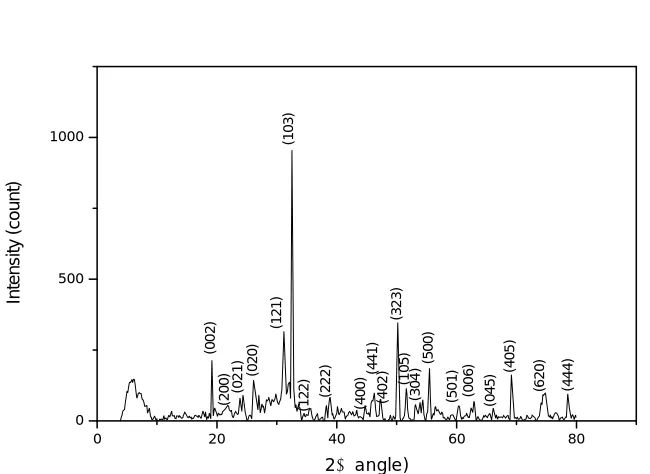
d values are calculated using Difrac Plus software. The samples are scanned in the range of 3 degrees to 80 degrees. All the observed reflections are indexed. Compared to pure SA, some extra peaks are obtained for SA : FeSO4. The extra peaks (002), (121), (103),
(323), (500), (405), (620), (444) and change in the intensity of peaks indicates the incorporation of the dopant into the crystal lattice of pure SA and thereby changing the bond length [5]. Definite Bragg peaks confirms the good crystalline nature of the grown crystal [12].
The PXRD of pure and grown crystal is shown in fig (2) and fig (3). Compared to pure SA, PXRD of grown crystal shows some extra peaks due to the incorporation of dopant into the crystal lattice.
0 20 40 60 80 0 500 1000 In te n s ity ( c o u n t)
2angle)
(0 0 2 ) (2 0 0 ) (0 2 1 ) (0 2 0 ) (1 2 1 ) (1 0 3 ) (1 2 2 ) (2 2 2 ) (4 0 0 ) (4 4 1 ) (4 0 2 ) (3 2 3 ) (1 0 5 ) (3 0 4 ) (5 0 0 ) (5 0 1 ) (0 0 6 ) (0 4 5 ) (4 0 5 ) (6 2 0 ) (4 4 4 )
Fig (3) PXRD of SA : FeSO4 crystal.
3. Fourier Transform Infrared Spectroscopy
The functional groups present in the grown sample can be identified using FTIR spectroscopy [9]. Fourier Transform Infrared Absorption spectra of SA : FeSO4 is recorded in the range 500 cm-1 to 4000 cm-1 using THERMO NICOLET
AVATAR 370 and is given in fig (4). Doping of FeSO4 into the lattice of pure SA shows some significant change in the
absorption pattern. The presence of various functional groups in the grown sample makes the FTIR spectrum complex. The absorption band in the range 3000 cm-1 to 4000 cm-1 becomes narrow when compared to the absorption band of pure SA. This is due to the incorporation of the dopant in the grown crystal.
The various functional groups present in SA : FeSO4 are assigned and recorded in the table (2). Vibrational band
assignments for SA:FeSO4 crystal shows variation in the absorption pattern compared to pure SA. FTIR of SA : FeSO4
crystal shows variation in the absorption pattern due to the incorporation of dopant into sulphamic Acid. It is shown in fig (4).
Table (2) Vibrational band assignments for SA:FeSO4.
Pure SA SA : FeSO4 Assignment
3211 3151 Degen. NH3+ stretching
2871 2871 Sym. NH3+ stretching
1538 1542 Degen. NH3+ deformation
1455 1446 Sym. NH3+ deformation
1337 1268 Degen. SO3- stretching
1069 1067 Degen. SO3- deformation
1001 1005 S - O stretching
Fig (4) FTIR of SA : FeSO4 crystal.
4. UV-Vis-NIR Studies
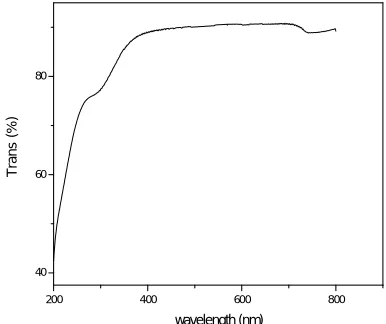
Optical transmission, absorption and transparency analysis of a crystal is very important which helps it to be used in optoelectronic field [9]. UV-Vis analysis of the grown crystal is carried out using VARIAN CARRY 300 SPECTROPHOTOMETER in the wavelength range of 200 nm to 800 nm. It is observed that the lower cutoff wavelength is 261 nm which is less than that of pure SA. This indicates that the dopant has improved the optical transparency of the grown crystal. There is no considerable absorption till 800 nm. So, it can be used for optoelectronic application in the visible region. The UV-Vis-NIR spectrum of grown crystal is given in fig (5) and fig (6).
In fig (5) UV-Vis-NIR of SA : FeSO4 crystal shows the cutoff wavelength is 261 nm which is less than pure SA. Fig (6) shows good
optical transparency of the grown crystal.
200 400 600 800
0.0 0.1 0.2 0.3 0.4 0.5
A
b
s
Wavelength (nm) 261nm
200 400 600 800
40 60 80
T
ra
n
s
(
%
)
wavelength (nm)
5. TGA/DTA Analysis
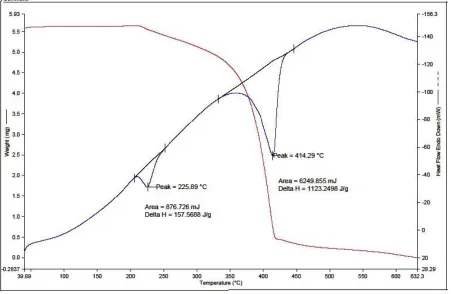
TGA/DTA analysis is carried out between 40 0C and 730 0C in nitrogen atmosphere at a heating rate of 10 0C/min using PERKIN ELMER DIAMOND Thermal analysis system. A crystal of weight 5.564 g is used for investigation. The grown crystal of SA : FeSO4 undergoes single stage of decomposition in the vicinity of 225 0C. The sharpness of the
peak indicates the high degree of crystallinity and purity of the grown crystal [3]. There is no weight loss till 225 0C, which confirms that the crystal is devoid of any physically absorbed water on it. So SA : FeSO4 crystal can be used for
Nonlinear Optical activity till 225 0Cwhere as pure SA decomposes fully at 204 0C which corresponds to its melting point [5].
From TGA, it is observed that SA : FeSO4 undergoes double stage of decomposition. The second stage of
decomposition occurs at the vicinity of 414 0C with a weight loss of nearly 85.668% of initial mass.
In fig (7) TGA/DTA of SA : FeSO4 crystal shows the two stages of decomposition. It confirms the nonlinearity until
225 0C.
Fig (7) TGA/DTA of SA : FeSO4 crystal.
6. Microhardness Study
The mechanical properties like Young’s modulus and residual stress of crystals can be explained from Microhardness measurements [13]. The microhardness of SA : FeSO4 crystal is measured using SHIMADZU MICROHARDNESS
indentation. The Vickers Microhardness Number Hv is calculated using the relation Hv= 1.8544P/d2 kgmm-2where P is the applied load in kg and d is the average diagonal length of the indentation in mm. A graph between Hardness number (n) and applied load (P) is shown in fig (8). According to Onitsch and Hannemann work hardening coefficient ‘n’ should lie between 1 and 1.6 for hard materials and above 1.6 for soft materials [14,15]. A graph is plotted with log P and log d and is shown in fig (9). From the slope of the graph the work hardening coefficient (n) is found to be 4.784 which shows the grown crystal is a soft material.
In fig (8) Plot of P Vs Hv of SA : FeSO4 crystal shows the hardness increases with load until 0.1 kg and beyond this
cracking occurs. From the slope of log P Vs log d in fig (9) confirms the crystal as a soft material.
0.03 0.06 0.09
24 32 40
H
v
i
n
K
g
/mm
2
Load in Kg
1.68 1.74 1.80
1.5 1.8 2.1
lo
g
P
log d
Fig (8) Plot of P Vs Hv of SA : FeSO4 crystal Fig (9) Plot of log P Vs log d of SA : FeSO4 crystal
7. Nonlinear Optical study
Kurtz Perry technique is used to test the Second Harmonic Generation of grown crystals. A fundamental beam of 1064 nm from a Q-Switched Nd-YAG laser is made to fall on the powdered sample. Pulse energy is 300 mJS-1 and pulse width is about 10 nS. The bright green emission from the grown crystal confirms second Harmonic Generation. The NLO efficiency of the grown crystal is compared with the standard KDP value and is found to be 0.509 times that of KDP crystal.
VI. CONCLUSION
Good optical quality single crystals of SA : FeSO4 have been grown by slow evaporation method at room temperature.
Single XRD data shows that the grown crystal belongs to orthorhombic structure. All functional groups in the grown crystals are confirmed by FTIR analysis. Good transmission range and cut off wavelength of 261 nm is detected by UV – Vis – NIR analysis. Thermal studies reveal that FeSO4 has slightly improved the thermal stability of grown crystal.
REFERENCES
[1] Dr.Rita A Gharde,Divakar T Chunarkar,‘Characterization of Sulphamic Acid Single Crystal by Optical Techniques’, International journal of Scientific and Research Publication, vol.2, issue 6, June 2012.
[2] de Vries S A, Goedtkindt P, Huisman W J, et al, ‘X-Ray Diffraction Studies of Potassium Dihydrogen Phosphate (KDP) Crystal Surfaces’, Journal of Crystal Growth, 205, 202, 1999.
[3] Umadevi T, Lawrence N, Ramesh Babu R, Selvanayagam S, Helen Stoeckli-Evans,Bhagavannarayana G, Ramamurthi K,’Synthesis, Crystal Growth, Structural, Optical, Thermal and Mechanical Properties of Semiorganic Nonlinear Optical Material: L-Cystine Dihydrochloride’, Journal of Minerals and Materials Characterization and Engineering, vol.9, No.5, pp. 495-507, 2010.
[4] Rafi Ahamed S and Srinivasan P, ‘Synthesis, Growth and Characterizations of Cesium Sulfamate Single Crystal By Solution Growth Technique’, Elixir Crystal Growth 50, 10628-1063, 2012.
[5] Valluvan R, Selvaraju K et al, ’Growth and Characterization Of Sulphamic Acid Single Crystals: A Nonlinear Optical Material’, Material Chemistry and Physics, vol.97 (1), 81-84, 2006.
[6] TakayoshiYoshimori and Tatsuhiko Tanaka, ‘Preparation of Sulphamic Acid Single Crystals And Their Assay By Precise Coulometric Titration’Anal ChemActa, 66, 85, 1975.
[7] Sass RL, Acta ‘The Neutron Diffraction Studies On The Crystal Structure Of Sulphamic Acid Crystal’, vol.13, part 4, 320-324, 1960.
[8] Thaila T andKumararaman S, ’Effect of NaCl and KCl Doping On The Growth Of Sulphamic Acid Crystals’, SpectrochimicaActa Part A. Molecular and Biomolecular Spectroscopy, vol.82(1), 20-24, 2011.
[9] Raj A S and Muthusubramanian P, ’Normal Coordinate Analysis Of The Sulphamate Ion’,Journal Of Molecular Structure. The Chem, vol89(34), 291-296, 1982.
[10] Hickling S J and Woolley R G, ’Normal Coordinate Analysis Of The Sulphamate Ion’ , Chemical Physics Letters, vol.166(1), 43-48, 1990. [11] S.Rajyalakshmi2, P.V.Prasad2, B.Brahmaji3, V.SomasekharaRao4, T.H.Y.A.G.Ghandhi1, E.Nageswara Rao1, K.Samatha2 and K.Ramachandra Rao1, ‘
Incorporation of Iron (II) on Structural, Optical, Spectroscopic Studies of Sulphamic Acid Single Crystals’, International Journal of Science and Research (IJSR), UGC Sponsored National Conference on Advanced Technology Oriented Materials (ATOM-2014), 8-9th Dec-2014 Department of Physics, Government College (A), Rajahmundry, Andhra Pradesh, India,pp.127-130,2014.
[12] Gharde R A, Divakar T Chunakar, ‘Unidirectional Seeded Single Crystal Growth From Solution Of Sulphamic Acid And Its Characterization’, International Journal of Advanced Research in Computer Engineering & Technology, 1(6), 241-245, 2012 Aug.
[13] Hemalatha P, Veeravazhuthi V & Mangalraj D,‘Vickers Microhardness Study of Nonlinear Optical Single Crystals of Doped and Undoped S-Benzyl Isothiouronium Chloride’, Journal of Materials Engineering and Performance,, 18: 106-108, 2009.