Enhancement of Optimal Power Generation
Scheduling & Fuel Cost Minimization Using
BAT Algorithm
Chodagam Srinivas
Assistant Professor, Department of Electrical & Electronics Engineering, M.V.R. College of Engineering & Technology,
PARITALA, Andhra Pradesh, India
ABSTRACT: The present day power framework has turned out to be exceptionally intricate in nature with utilization of the electric force which is in movement and these inclination increments with the industrialization and the populace's development. Besides one loss of supply because of any specialized issue can bring about the interference of the different creation forms, and before shoppers who turn out to progressively want so as to request more vitality and better quality. The electrical vitality creation organizations of must along these lines guarantee the customary provisioning of this solicitation, and without interference, however these prerequisites trade off the expense of era. The proposed methodology finds the ideal setting of OPF control variables which incorporate generator dynamic yield, generator transport voltages, transformer tap-setting and shunt gadgets with the target capacity of minimizing the fuel cost. The paper proposes BAT Algorithm to resolve the optimal power scheduling problem. The proposed BAT is displayed to be adaptable for usage to any power system frameworks with the given power system transmission lines, transport information, generator fuel cost parameter and anticipated burden request. The BAT Algorithm model has been investigated and tried on the standard benchmark IEEE 30-bus framework. The outcomes acquired beat different methodologies which are as of late connected to the IEEE 30-bus framework with the same control variable most extreme and least points of confinement and framework information. Better results are likewise discovered when thought about against the designs utilized as a part of the IEEE-30 bus frameworks. These better results are accomplished due than the strong and solid calculation of the proposed BAT calculation approach.
KEYWORDS:BAT Algorithm, Economic Dispatch, Non-smooth cost functions, Optimal power scheduling.
I. INTRODUCTION
Economic dispatch (ED) is the operation of generation to produce energy at the lowest cost by fulfilling the demand within several limits. This is not an easy task since there are a lot of factors need to be considered especially in the large interconnected power systems. The primary objective of ED is to schedule the committed generating units output so as to meet the required load demand at minimum cost satisfying all unit and system operational constraints [1]. In power system operation and planning, optimum power flow is one of the areas in which power engineers focus on in order to minimize the operational cost and system losses, while supplying reliable and uninterruptible electricity to the consumers. Power plant management is required not only to provide uninterruptible and reliable power supply but also to achieve the most economic cost [17]. No. of optimization are proposed to control the power flow solutions. Since the optimum power flow method was first introduced by Dommel and Tinney in 1968[1]. Various conventional methods like Bundle method, nonlinear programming, mixed integer linear programming, dynamic programming, quadratic programming, Lagrange relaxation method, network flow method, direct search method, weighting, surrogate worth trade-off techniques reported in the literature are used to solve such problems [1].To simplify the OPF problem many mathematical assumptions are used, like convex, analytical, differential objective functions.
solving this problem, but it also has limitations due to the “curse of dimensionality” [2]. Now the interest is changed in OPF from mathematical programming algorithms to evolutionary programming methods. The advancement in optimal power flow problem solving the genetic algorithm is applied as direct & integration with other techniques is introduced to obtained promising results. In this processes the tabu search & PSO algorithm are introduced for OPF problem to get the best results by avoiding the limitations of mathematical programming approaches.
Many variants of GA have previously been used with good results to solve non-convex ELD problems [3–5]. The main advantage GA has over other algorithms is that it can use a chromosome coding technique tailored to the specific problem. The two main disadvantages of GA over other techniques are firstly, there is no guarantee of convergence to the global optimum solution and secondly, the execution time is very long.
IEEE-30 bus standard
test system is chosen to demonstrate the proposed algorithm & to examine the proposed algorithm
to evaluate the performance for getting the optimal global fuel cost.
II. PROBLEM FORMULATION
The mathematical formulation of OPF problem can solved as follows:
Mini F(x, u) (1) Sub to
gn(x,u) = 0 (2)
hmin≤ h(x,u) ≤ hmax (3)
Where vector x denotes the state variables in vector form for the considered system. The power system contains the slack bus real power output (PG1), voltage magnitudes and phase angles of the load buses (Vi, δi) and generator reactive
power outputs (QG). Vector u represents control variables that consist of real power (PGN) and generator voltages
magnitudes (VGN), transformer tap setting (TK) and reactive power injections (QCK) due to volt-amperes reactive (VAR)
compensations:
u = [PG1.. PGN, VG1..VGN, T1..TNT, QC1.. QCS]. (4)
Where N is the number of generator buses, NT is the number of tap changing transformers, and CS is the number of shunt reactive power injections.
The OPF problem has two types of constraints:
Equality constraints These are the sets of nonlinear power flow equations that govern the power system, i.e
PGK - PDK - ∑J=1N|VK| |VJ| |YKJ| COS(θKJ – δk +δj) = 0 (5)
QGK - QDK - ∑J=1N|VK| |VJ| |YKJ| Sin(θKJ – δk +δj) = 0 (6)
Where PGK and QGK are the real and reactive power outputs injected at bus i, respectively, the load demand at the same bus is represented by PDK and QDK , and elements of the bus admittance matrix are represented by | YKj | and θKj.
Inequality constraints These are the set of constraints thatrepresent the system operational and security limits like the bounds on the following:
1) Generators real and reactive power outputs
PGKmin≤ PGK ≤ PGKmax, k=1,…..N (7) QGKmin≤ QGK ≤ QGKmax, k=1,…..N (8) 2) Voltage magnitudes at each bus in the network
VKmin≤ VK ≤ VKmax, k=1,…..NL (9) where NL is the number of load buses.
TKmin≤ TK ≤ TKmax, k=1,…..NT (10) 4) Reactive power injections due to capacitor banks
QCKmin≤ QCK ≤ QCKmax, k=1,…..CS (11)
In this paper, the constraints corresponding to the state or dependent variables are incorporated into a fitness function. In general the OPF generation fuel cost function can be expressed by a quadratic function as follows:
Mini (FT) = ∑NGN=1 FN (PGN) (12)
FNPGN=aN+bNPGN+CNPGN2 (13)
The IEEE-30 bus system is taken in this paper to test the proposed algorithm & it is used as a standard test system to study different power problems & evaluate programs to analyse such problems. It consists of 6 generator units as well as 41 transmission lines.
III.PROPOSEDALGORITHM
Bat algorithm has been developed by Xin-She Yang in 2010 [6]. Bats use sonar echoes to detect and avoid obstacles. They use time delay from emission to reflection and utilize it for navigation. They typically emit short loud, sound impulse and the rate of pulse is usually 10 to20 times per second. Bats uses inbound frequencies (20,500) kHz. By execution [8,9],Pulse rate can be determined fro range (0-1). Pulse rate can be simply determined from range 0 to 1, where 0 means there is no emission and by 1, bats are emitting maximum [7], By utilizing above behavior new bat algorithm can be formulated. Yang [22] used three generalized rules for bat algorithm.
Proposed Bat Algorithm
1. Objective function f(x), x=(x1, . . . . , xd)xT
2. Initialize the bat population Xi and vi for i=1,2,…n. 3. Define pulse frequency Qi ε [Qmin and Qmax] 4. Initialize pulse rates ri and loudness Ai 5. while (t <Tmax) // number of iterations
6. Generate new solutions by adjusting frequency, and 7. updating velocities and locations/solutions
8. if (rand (0; 1) > ri)
9. Select a solution among the best solutions
10. Generate a local solution around the best solution 11. end if
12. Generate a new solution by flying randomly 13. if (rand(0;1< Ai and f(xi)<f(x)))
14. Accept the new solutions 15. Increase ri and decrease Ai 16. end if
17. Rank the bats and find the current best 18. end while
19. Post-Process results and visualization
BAT Algorithm for solving optimal power scheduling and economic dispatch the following values are used to implement the proposed algorithm.
Total number of populations = 40; Maximum no of iterations = 150; Loudness = 0.5;
Pulse rate = 0.5;
Qmin=0; Frequency minimum Qmax=2; Frequency maximum
The following equations are used to update the velocities and locations
Q(pp)=Qmin+(Qmin-Qmax)*rand; (14)
V(pp,:)=v(pp,:)+(Xg(pp,:)-globalXg)*Q(pp); (15)
S(pp,:)=Xg(pp,:)+v(pp,:); (16)
The factor 0.01 limits the step sizes of random walks and equation shows search solution.
S(jj,:)=globalXg+0.01*randn(1,d); (17)
IV.EXPERIMENTAL RESULTS OF IEEE-30 BUS BENCHMARK SYSTEM
The IEEE-30 bus system network consists of 6 generators buses, 21 load buses and 41 branches of which 4 branches are under load tap setting transformer branches. The generator units are connected to the bus number 1, 2, 5, 8, 11 & 13. The generator cost coefficients of IEEE-30 bus system are tabulated as follows:
Table 1: Generator Cost Coefficients of IEEE-30 Bus System
Bus No
Cost Coefficients Min MW
Max MW
a b c
1 0.0 2.00 0.00375 50 200 2 0.0 1.75 0.01750 20 80 5 0.0 1.00 0.06250 10 50 8 0.0 3.25 0.00834 10 35 11 0.0 3.00 0.02500 10 30 13 0.0 3.00 0.02500 12 40
V. SIMULATIONRESULTS
The considered three practical power systems data are simulated by MTALAB platform. Cost coefficient curves for three systems are shown as follows. From the Table2 it is clearly observed that the fuel cost minimization without violating the maximum & minimum generating limits in IEEE-30 bus system. The following two figures shows the results for fuel cost curve versus number of iterations in two different algorithms case 1 shows the results the IEEE-30 bus system tested by Genetic Algorithm and case 2 shows the results for fuel cost minimization curve with BAT Algorithm implementation in IEEE-30 bus system.
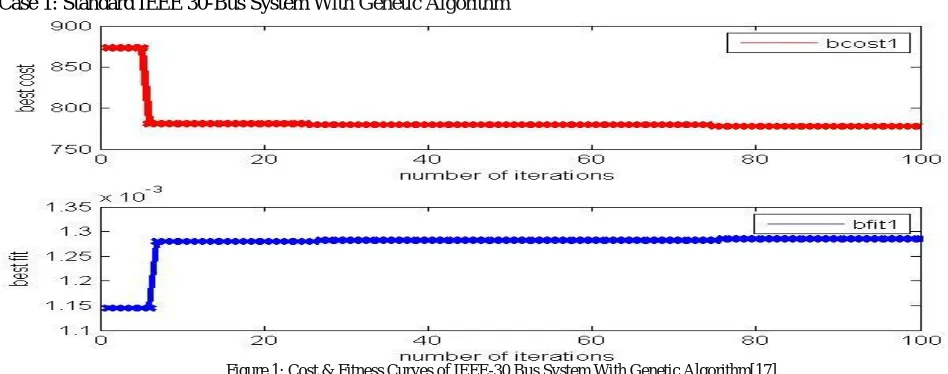
Case 1: Standard IEEE 30-Bus System With Genetic Algorithm
Figure 1: Cost & Fitness Curves of IEEE-30 Bus System With Genetic Algorithm[17].
Figure 2: Cost & Fitness Curves of IEEE-30 Bus System With Proposed BAT Algorithm.
It is obviously watched that from figure 1 and 2 the proposed BAT Algorithm gives the better result when contrasted with the GA Approach tried on the IEEE-30 bus framework. The real two things are seen in the two methodologies the BAT Algorithm acquired the base fuel cost when contrasted with GA approach and second thing is the proposed methodology takes less cycles to achieve the best cost and wellness capacity it demonstrates the lessening in time element when the calculation is tried on extensive power systems.
Table 2: Comparison of Optimal Scheduling & Fuel Cost Results With Proposed, Gradient Based & Power World Simulator [1].
Proposed BAT Algorithem
Iterative
Method GA Gradient Based Power Simulator
183.6895 185.4036 156.71 187.2190 197.99
48.8847 46.8722 50.061 53.7810 44.00
18.8258 19.1242 24.78 16.9550 22.00
10.00 10.00 13.10 11.2880 10.00
10.00 10.00 26.21 11.2870 10.00
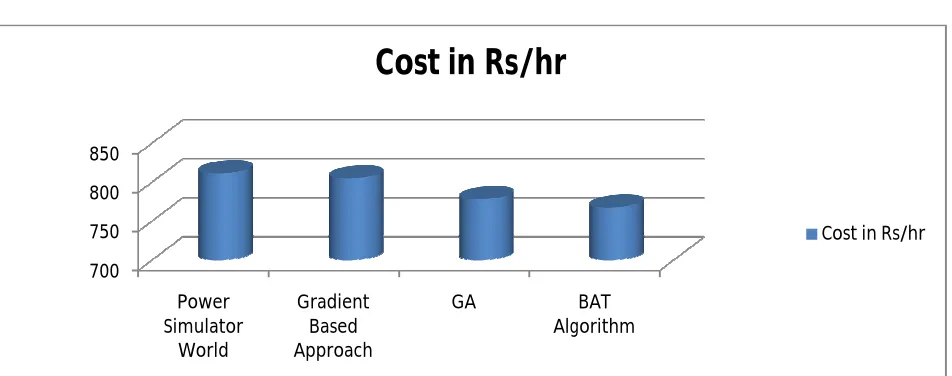
Figure 3: Fuel Cost (Rs/hr) Minimization by different approaches.
Table-2 demonstrates the different methodologies tried and executed on IEEE-30 bus framework and the proposed BAT calculation demonstrates the different era levels to minimize the fuel cost in force era without damaging the generator working points of confinement as said in table-1. Figure 3 demonstrates the expense varieties in the force era by diverse calculations tried and executed on IEEE-30 bus framework.
VI. CONCLUSION
In this paper, the BAT Algorithm model has been effectively executed on the standard IEEE-30 bus framework with genuine information and burden interest design. From figure 3 the fuel expense is closer to the GA however from the figure 1 and figure 2 demonstrates the deviation between the two methodologies that is number emphases ought to less in proposed BAT Algorithm when analysed GA, then we infers that the calculation time is additionally lessened by proposed BAT Algorithm. The calculation which was proposed in this paper is demonstrated to be adaptable for usage to any viable force frameworks with line and bus information, generator fuel cost parameter and estimated burden request. Prevalent results are gotten by proposed calculation when contrasted with the current techniques for the IEEE-30 bus framework. Any substantial force system can be tried by utilizing the proposed BAT Algorithm then the strong and dependability can be accomplished. Finally the proposed methodology guarantee more ideal design of control variables, gives an answer lower operational expense.
REFERENCES
1. Mahor A., Prasad V., Rangnekar S., Economic Dispatch Using Particul Swarm Optimization: a Review, Renewable and Sustainable Energy Reviews, 2009, 13, p.2134-2141.
2. Li, L.; Sun, Z. Dynamic Energy Control for Energy Efficiency Improvement of Sustainable Manufacturing Systems Using Markov Decision Process. Syst.Man Cybern. Syst. IEEE Trans.2013, 43, 1195–1205.
3. Abido, M.A. A niched Pareto, genetic algorithm for multiobjective environmental/economic dispatch. Int. J. Electr. Power Energy Syst. 2003, 25, 97–105.
4. Subbaraj, P.; Rengaraj, R.; Salivahanan, S. Enhancement of self-adaptive real-coded genetic algorithm using Taguchi method for economic dispatch problem. Appl. Soft Comput. 2011, 11, 83–92.
5. Amjady, N.; Nasiri-Rad, H. Solution of nonconvex and nonsmooth economic dispatch by a new adaptive real coded genetic algorithm. Expert Syst. Appl. 2010, 37, 5239–5245.
6. X.S. Yang, A new meta-heuristic bat-inspired algorithm. Nature Inspired Cooperative Strategies for Optimization (NICSO 2010), pages 65–74, 2010.
7. A.H.Gandomi, X.S. Yang, A.H. Alavi, and S. Talatahari. Bat algorithm for constrained optimization tasks. Neural Computing & Applications, pages 1–17, 2012.
8. P.W. Tsai, J.S. Pan, B.Y. Liao, M.J. Tsai, and V. Istanda. Bat algorithm inspired algorithm for solving numerical optimization problems. Applied Mechanics and Materials, 148:134–137,2012.
9. P.W. Tsai, J.S. Pan, B.Y. Liao, M.J. Tsai, and V. Istanda. Bat algorithm inspired algorithm for solving numerical optimization problems. Applied Mechanics and Materials, 148:134–137,2012.
700 750 800 850
Power Simulator
World
Gradient Based Approach
GA BAT
Algorithm
Cost in Rs/hr
10. G. Duan, Y. Yu, Problem-specific genetic algorithm for power transmission system planning, Electric Power Systems Research. 61 (2002) 41-50.
11. F. Li, J.D Pilgrim, C. Dabeedin, A. Chebbo, R.K. Aggarwal, Genetic algorithms for optimal reactive power compensation on the national grid system. Power Systems, IEEE Transactions on, 20 (2005) 493-500.
12. K.P. Dahal, S.J. Galloway, G.M. Burt, J.R. McDonald, Generation scheduling using genetic algorithm based hybrid techniques, Power Engineering, LESCOPE'01, Large Engineering Systems Conference (2001) 74 – 78.
13. V. Miranda, D. Srinivasan, L.M. Proenca, Evolutionary computation in power systems, International Journal of Electrical Power and Energy System, 20(1998) 89-98.
14. B. Stott, Review of load flow calculation methods, IEEE Proc., vol.62, pp.916-929, 1974.
15. M R Rashid, M E El-Hawary, Application of computational intelligent techniques for solving the revived optimum power flow problem, Electric Power System Research 79 (2009) 694-702.
16. J.A. Momoh, R. Adapa, M.E. El-Hawary, A review of selected optimal power flow literature to 1993, part II: Newton, linear programming and interior point methods, IEEE Transactions on Power Systems Vol. 14 (1) (1999) 105–111.
17. ch.srinivas, Enhancement of Optimal Scheduling & Fuel Cost Minimization Using Flexible Genetic Algorithm, IJCA, vol. 116, 2015.
BIOGRAPHY
CH.Srinivas was born in Machilipatnam, Andhra pradhesh, India. He received the B.Tech degree in Electrical & Electronics Engineering from the D.M.S.S.V.H. College of Engineering, Machilipatnam, in the year 2011 and the M.Tech degree in Power System Control & Automation Engineering from SRI VASAVI Engineering College, Tadepalligudem, in the year 2013.
![Table 2: Comparison of Optimal Scheduling & Fuel Cost Results With Proposed, Gradient Based & Power World Simulator [1]](https://thumb-us.123doks.com/thumbv2/123dok_us/1662605.1208764/5.595.72.541.144.399/table-comparison-optimal-scheduling-results-proposed-gradient-simulator.webp)