Temperature Sensor BasedonFiber Bragg
Grating (FBG), Implementation, Evaluation
and Spectral Characterization Study
Dr.Shehab A. Kadhim
1, Dr.Salah Aldeen A. Taha
2, Dehyaa A. Resen
3Laser & Optoelectronics Research Center, Ministry of Science &Technology, Iraq1
Dept. of Laser & Optoelectronics Engineering , Al-Technologyia Unv. , Iraq2,3
ABSTRACT:Optical fiber plays significant roles in optical communications, optoelectronics, and sensors. The FBG sensors exceed other conventional electric sensors in many aspects, for instance, immunity to electromagnetic interference, light weight, compact size, stability, flexibility, high temperature tolerance, and resistant to harsh environment. This paper provides the operating principle, implementation of a “strain-free” FBG temperature sensors head and spectral characterization study. High-resolution detection of the wavelength-shifts induced by temperature changes are achieved using optical spectrum analyzer. Both uniform Fiber Bragg Grating (FBG) temperature and Mach-Zehnder Interferometric (MZI) temperature sensors based on single mode fibers were implemented and investigated due to measurement of the Bragg wavelength shift. It has been shown from the results that the FBG is very sensitive to variations in temperature degrees over a temperature range of (5–70) oC and the sensitivity was (1-6 pm/0.1°C), also observed from the results, the relation between the shifted Bragg wavelength and temperature degrees was linear.
KEYWORDS: fiber-optic sensors, Mach-Zehnder Interferometer,Fiber BraggGrating.
I. INTRODUCTION
In recent years, the fiber optics sensing of different based such as temperature, strain, vibration, acoustics, linear and angular position ,pressure, humidity, viscosity, acceleration, electric field measurement, magnetic field measurement, chemical measurement and others, won the special attraction because of its feature like lightweight, small size, cylindrical geometry, robust to environment, size compacted, high in sensitivity, possibility of remote sensing, immune to electromagnetic interference and interface with radio frequency [1]. Several types of fiber optic sensors were reported, among them are fiber Bragg grating sensors, fiber optic interferometer sensors like Michelson, Fabry-Perot, Sagnac, and Mach-Zehnder, and others. Fundamentally, a fiber-optic sensor works by modulating one or more properties of a propagating light wave, including intensity, phase, polarization, and frequency, in response to the environmental parameter being measured. Extrinsic (hybrid) optical sensors use the fiber only as a mechanism to transmit light to and from a sensing element, while intrinsic optical sensors use the optical fiber itself as the sensing element. In this paper, FBG will be implemented as a temperature sensor and its spectral characteristics such as sensitivity and resolution will studied and compare with another type which is a single mode Mach-Zehnderinterferometer sensors based temperature. Fiber Bragg Grating (FBG) was discovered by Ken Hill and co-workers in Canada, nearly twenty years ago. FBG is a periodic or an aperiodic perturbation of the effective absorption coefficient and/or the effective refractive index of an optical waveguide. They typically reflect light over a narrow wavelength range,which satisfies the Braggcondition and transmit all other wavelengths, but they also can be designed to have more complex spectral responses [2].
II. FIBERBRAGGGRATING(FBG)SENSOR
light intensity. The refractive index of the fiber is permanently altered according to the intensity of light it is exposed to the resulting periodic variation in the refractive index is called a fiber Bragg grating as shown in Figure (1) [3].
(a) (b)
Figure 1. (a).Operation of an FBG Optical Sensor, (b). An Expanded View of an FBG
When a broad-spectrum light beam is sent to an FBG, reflections from each segment of alternating refractive index interfere constructively only for a specific wavelength of light, called the Bragg wavelength, described in equation (1). This effectively causes the FBG to reflect a specific frequency of light while transmitting all others.
λB= 2neffΛ …………..……… (1)
Because the Bragg wavelength is a function of (Λ), the spacing between the gratings known as the grating period. FBGs can be manufactured with various Bragg wavelengths, which enable different FBGs toreflect unique wavelengths of light.Changes in strain and temperature affect both the effective refractive index n and grating period Λ of an FBG, which results in a shift in the reflected wavelength. The change of wavelength of an
FBG due to strain and temperature can be approximately described by equation (2): ∆𝝀𝑩
𝝀𝑩 = 𝒌ɛ + 𝜶𝜹∆𝑻…………...…… (2)
∆𝜆𝐵= Bragg wavelength shift, 𝑘=gage factor = 1-p, where p=0.22, 𝑘=0.78, ɛ=strain, 𝛼𝛿=changing in index of refraction, ∆𝑇= changing in temperature[4].
The first expression describes the impact of strain on the wavelength shift, the second expression describes the impact of temperature on the wavelength shift.Because an FBG responds to both strain and temperature, so for sensing temperature, the FBG must remain unstrained. Using packaged FBG temperature sensors make to ensure the FBG inside the package is not coupled to any bending, tension, compression, or torsion forces.
III.MACH-ZEHNDERINTERFEROMETER(MZI)SENSOR
Fiber optic interferometer sensors also have been widely deployed owing to their special characteristics. Mach-Zehnder fiber optic interferometer sensor operates on the interference effect between two beams that propagate through different optical paths of a single fiber or two different fibers. It can be seen that the beam splitting and combining components are required in any configuration of the fiber optic interferometers. The incident light is split into two arms by a fiber splitter and then recombined by a fiber combiner. Early MZIs had two independent arms, which functioned as the sensing arm and the reference arm, respectively. The phase shift due to temperature is obtained by the following equation:
𝒅𝝋 𝒅𝑻=
𝟐𝝅 𝝀 𝒏
𝒅𝑳 𝒅𝑻+ 𝑳
𝒅𝒏
Where 𝑑𝜑 symbolizes the phase shift, λ represent the wavelength of light, 𝑛 is the refractive index, 𝑑𝑇 and 𝑑𝐿 are variation in the temperature and elongation respectively, 𝐿 is the fiber interaction length, since:
𝜶 = 𝒅𝑳
𝒅𝑻 .𝑳 and 𝜷 = 𝒅𝒏
𝒅𝑻 ……… (4)…..
Then: 𝒅𝝋 𝒅𝑻=
𝟐𝝅
𝝀 𝑳(𝒏𝜶 + 𝜷)………….………...… (5)
Where 𝛼 is thermal expansion, 𝛽 is thermo-optic coefficient [5], [6].
According to above equations , the refractive index change given by the following equation
𝒅𝒏 = 𝝀
𝟐𝝅𝑳𝒅𝝋 − 𝒏𝜶 𝒅𝑻…………… (6)
IV.EXPERIMENTALWORK a. Characterization of FBG Sensor:
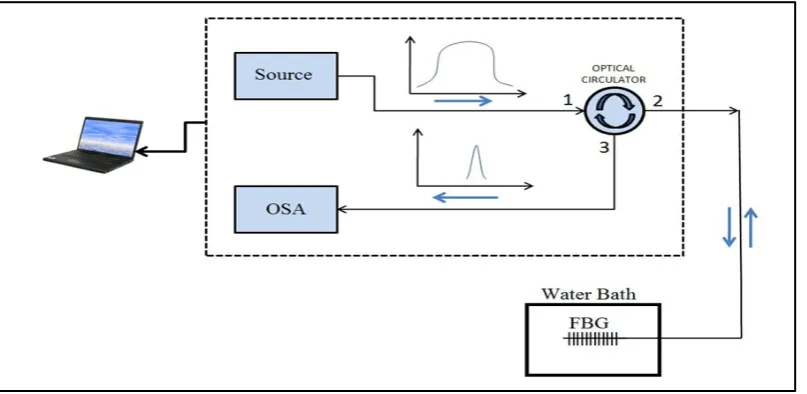
To characterize the FBG sensor, a single mode fiber-pigtailed laser diode, FC/PC, center wavelength about (1530 nm-1590 nm) , output power approximation 1.59 mW, output current around 29.4 mA was launched into input terminal (1) of optical fiber circulator, while the transmitted terminal (2) was connected to the fiber Bragg grating which emerged in amicroprocessor-controlled water bath boiler HH-1,temperature Range: (0-100)°C, and the outputreflected signal through the third terminal (3) of circulator connected to the Monochromator / Spectrograph (Zolix DlnGaAs1700 lnGaAa Detector) model Omni-λ Series, focal length 500 (mm).The whole block diagram of theexperimental setup is shown in the Figure 2.
Figure 2.Block diagram of FBG temperature sensor setup.
For testing the FBG used here, the water temperature in the water bath was first changed from (5 – 70) oC with a step of 5oC, the temperature decreased from (70 – 35) oC with a step of 5oC .
Figure 4. Wavelength shift and the amplitude of the reflected signal of the FBG as a function to temperature perturbation.
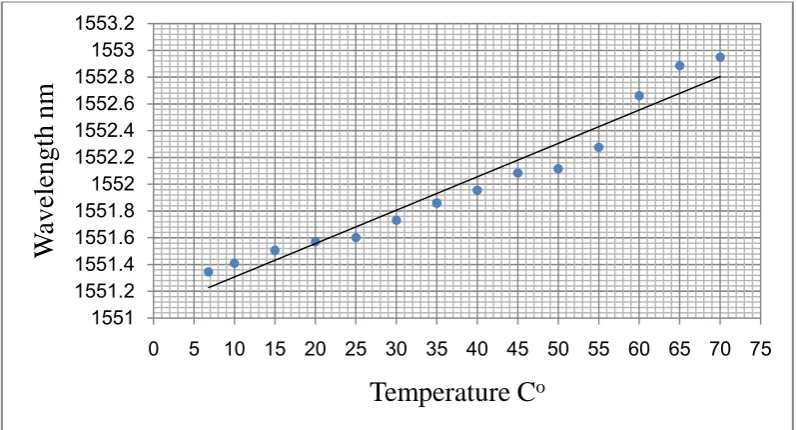
The dependence of the red-shift of the resonance wavelength of the FBG on the increasing temperature was measured to be 0.0091 nmoC-1.From equation 2, the expected sensitivity for 1550nm Bragg grating is approximately equal to 13.7pm oC-1.Figure (5) show experimental results of a Bragg grating center wavelength shift as a function of temperature.
Figure 5. Peak reflection from the Bragg grating at different temperatures
The spectrum of grating was noted for different temperatures. A particular wavelength was selected from the spectrum as shown in table (1), at which the change in temperature was reflected by a corresponding change in the amplitude of transmission as shown in Figure (5),at selected wavelengths (1546 – 1556) nm the FBG can be used as a temperature sensor for the temperature range of (5–70)oC only. This can implement as calibration curve for such sensor.
1551 1551.2 1551.4 1551.6 1551.8 1552 1552.2 1552.4 1552.6 1552.8 1553 1553.2
0 5 10 15 20 25 30 35 40 45 50 55 60 65 70 75
W
av
el
en
g
th
n
m
T oC λB nm T oC λB nm T oC λB nm
6.8 1551.3462 30 1551.7308 55 1552.2756 10 1551.4103 35 1551.8590 60 1552.6603 15 1551.5064 40 1551.9551 65 1552.8846 20 1551.5705 45 1552.0833 70 1552.9487 25 1551.6026 50 1552.1154
Table (1). Bragg wavelength under variable temperature.
This is because tofurther increase in temperature, the transmission becomes 100% of these wavelengths. However, for higher temperature sensing applications, one has to use the FBG at differentwavelengths. Based on the transmission spectra of the higher temperatures suitablewavelengths.
The major advantage of such calibration curves is that the change in temperature can be measured using a detector and a single wavelength source instead of a spectrum analyzer and a tunable laser source. In order to measure temperature, we can use as many FBG as necessary, in different Bragg wavelengths; the only precaution is that each FBG's spectrum should not overlap with its neighbor during its displacement when the temperature varies. To obtain the largest range for five FBGs we distributed them along the available range of most FBGs interrogators, that is, 1530 nm-1570 nm.
b. Characterization of (MZI) Sensor:
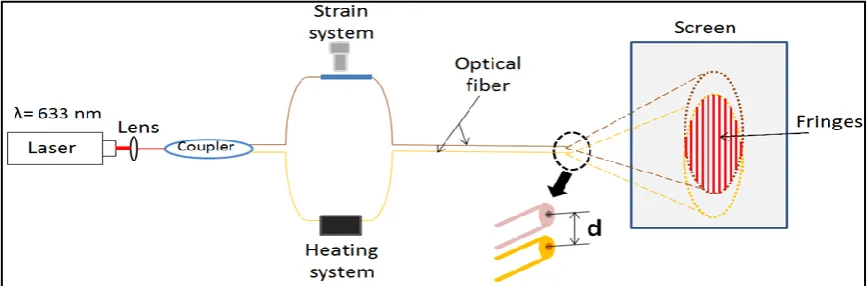
The experiment consist of (5mW) He-Ne laser at (633nm) wavelength, efficiently coupled into fiber coreusing a (5mm) focallens through (1:2) single mode fiber coupler with 50% coupling ratio in order to splitting the light to two identical output beams so achieve interference pattern between them, and finally the output of our experiment takes by two ways, first of them is from screen, and the other is via USB beam profiling CDD camera. The whole block diagram of experimental set up is shown in the Figure 6.
Figure 6.Block diagram of (MZI) sensor experimental set up
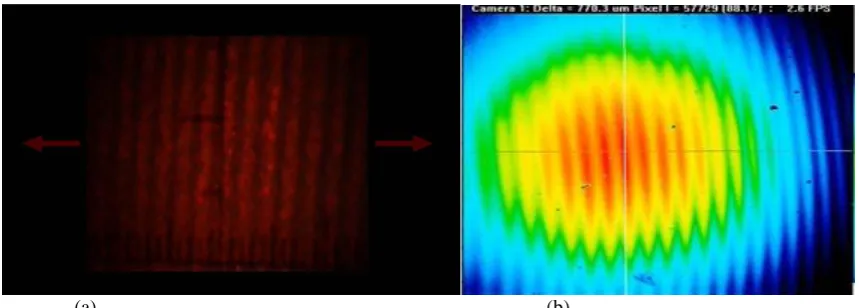
(a) (b)
Figure 7. Interference pattern on (a) screen, (b) by beam profile CCD camera.
For testing the (MZI) sensor used here, the environment air temperature was first changed from (25 – 40) oC with a step of 5 oC. The phase difference related to changein refractive index calculated according to equation (7), as shown in Table (2).
T o C Δφ*2π dn T o C Δφ*2π dn
28 9.50 1.6211 33 43.75 7.6434
29 17.75 3.0717 34 48.75 8.5226
30 24.75 4.3026 35 53.50 9.4017
31 31.50 5.4895 36 57.50 10.061
32 38.25 6.6763 37 61.25 10.721
Table 2. Temperature effect on phase difference related to change in refractive index.
A linear relation between Temperature variations according to phase difference which related to variation of refractive index as shown in Figure (8), can be used as a calibration and sensitivity curve for such sensor.
V. CONCLUSION
Fiber Bragg gratings as temperature sensor has been reviewed and demonstrated, which possess many unique advantages over conventional techniques. The FBG was characterized to get either the reflection or transmission spectrum which was as expected from the specification sheet. The FBG is calibrated to be used as a temperature sensor within the range (20 – 70)oC. The used fiber Bragg grating (FBG) in this work is very sensitive to the variation of the temperature degrees, the sensitivity was (1-6pm\0.1°C).The relation between the applied temperature and shifting Brag wavelength was linear. The sensitivity of the Bragg wavelength to temperature arises from the change in the refractive index of the optical fiber.
REFERENCES
[1]. Shivang Ghetia, Ruchi Gajjar, and Pujal Trivedi “Classification of Fiber Optical Sensors” International Journal of Electronics Communication and Computer Technology (IJECCT) Volume 3 Issue 4 (July 2013)
[2]. Toto Saktioto, and Jalil Ali “Non Linear Optic in Fiber Bragg Grating” Universiti Teknologi Malaysia, www.intechopen.com [3].Chi H. Lee, “Microwave Photonics” CRC Press, ISBN 1466502878, 9781466502871, 2013.
[4]. Manfred Kreuzer ,”strain measurement with fiber bragg grating sensor” HBM, Darmstadt, Germany, Email:[email protected]
[5]. Manuel Silva-López, Amanda Fender, William N. MacPherson, James S. Barton, and Julian D. C. Jones, Donghui Zhao, Helen Dobb, David J. Webb, Lin Zhang, and Ian Bennion “Strain and temperature sensitivity of a single-mode polymer optical fiber” December 1, 2005 / Vol. 30, No. 23 / OPTICS LETTERS, OCIS codes: 060.2300, 060.2370, 120.3180, 120.6810