Copyright © 1998 by the Genetics Society of America
Genetics 148: 479–494 ( January, 1998)
A High-Density Rice Genetic Linkage Map with 2275 Markers Using
a Single F
2Population
Yoshiaki Harushima,*
,1Masahiro Yano,* Ayahiko Shomura,* Mikiko Sato,* Tomotoshi Shimano,*
Yoshihide Kuboki,* Toshio Yamamoto,* Shao Yang Lin,* Baltazar A. Antonio,* Arnold Parco,
†Hiromi Kajiya,* Ning Huang,
†Kimiko Yamamoto,* Yoshiaki Nagamura,* Nori Kurata,*
,1Gurdev S. Khush
†and Takuji Sasaki*
*Rice Genome Research Program, National Institute of Agrobiological Resources/Institute of Society for Techno-Innovation of Agriculture, Forestry, and Fisheries, Tsukuba, Ibaraki 305, Japan, and †International Rice Research Institute, Manila, Philippines
Manuscript received June 12, 1997 Accepted for publication October 9, 1997
A B S T R A C T
A 2275-marker genetic map of rice (Oryza sativa L.) covering 1521.6 cM in the Kosambi function has been constructed using 186 F2 plants from a single cross between the japonica variety Nipponbare and the
indica variety Kasalath. The map provides the most detailed and informative genetic map of any plant. Cen-tromere locations on 12 linkage groups were determined by dosage analysis of secondary and telotrisomics using .130 DNA markers located on respective chromosome arms. A limited influence on meiotic recom-bination inhibition by the centromere in the genetic map was discussed. The main sources of the markers in this map were expressed sequence tag (EST) clones from Nipponbare callus, root, and shoot libraries. We mapped 1455 loci using ESTs; 615 of these loci showed significant similarities to known genes, includ-ing sinclud-ingle-copy genes, family genes, and isozyme genes. The high-resolution genetic map permitted us to characterize meiotic recombinations in the whole genome. Positive interference of meiotic recombination was detected both by the distribution of recombination number per each chromosome and by the distribu-tion of double crossover interval lengths.
The Rice Genome Research Program in Japan (RGP) has been developing a rice molecular linkage map using 186 F2 plants derived from a single cross between the
japonica variety Nipponbare and the indica variety Kasalath. We previously reported a 300-kb interval genetic map with 1383 molecular markers including 883 ESTs ( Ku-rataet al. 1994b). Using the 1383-marker map, we have
investigated synteny between rice chromosomes and those of hexaploid bread wheat (Kurata et al. 1994a),
identified duplicated segments between rice chromo-somes 11 and 12 (Nagamuraet al. 1995), detected
seg-regation distortions in an indica–japonica rice cross
(Harushimaet al. 1996), compared genetic distance and
order of DNA markers in five japonica–indica crosses
(Antonio et al. 1996b), mapped quantitative trait loci
conferring heading time (Yano et al. 1997), and
con-structed the first-generation physical map with an ordered yeast artificial chromosome (YAC) library (Umeharaet al.
1996, 1997; Antonioet al. 1996a; Sajiet al. 1996; Wang
et al. 1996; Koike et al. 1997; Shimokawa et al. 1996; Tanoueet al. 1997; reviewed by Kurataet al. 1997).
The genome coverage with YACs using all the 1383 markers in the first-generation physical map was about half of the rice genome (Kurataet al. 1997). Higher
marker density was needed to construct a more com-plete physical map of the rice genome and to clone genes for important traits.
Corresponding author: Masahiro Yano, Rice Genome Research Pro-gram, National Institute of Agrobiological Resources, 2-1-2 Kannon-dai, Tsukuba, Ibaraki 305, Japan. E-mail: myano@abr.affrc.go.jp
1Present address: Plant Genetics Laboratory, National Institute of Genetics, Mishima 411, Japan.
ICE (Oryza sativa L.) is not only an important food crop but also a model plant (Havukkala 1996;
Izawa and Shimamoto 1996) because of its small
ge-nome size (Arumuganathan and Earle 1991), its
high synteny to other monocots (Ahn and Tanksley
1993; Kurataet al. 1994a; Moore et al. 1995), its
effi-cient transformation system (Shimamoto et al. 1989; Hiei et al. 1994; Song et al. 1995), the availability of
large-scale analyses of expressed sequence tags (ESTs;
Sasaki et al. 1994) and dense molecular genetic maps
(McCouch et al. 1988; Saito et al. 1991; Causse et al.
1994; Kurataet al. 1994b; reviewed by Nagamuraet al.
1997), large-insert libraries (Umeharaet al. 1995), and
abundance of genetic resources. Dense linkage maps are essential for key organisms. Such maps facilitate high-resolution genetic mapping and positional clon-ing of important genes, allow genetic dissection of quantitative trait loci, assist in local comparisons of syn-teny, and provide an ordered scaffold on which com-plete physical maps can be assembled. The usefulness of genetic maps thus largely depends on their density.
480 Y. Harushima et al.
To construct a more dense genetic map, additional molecular markers have been produced at either tar-geted sites (Monna et al. 1995, 1997) or random sites.
As a result, 934 new markers have been added to the map. To determine the centromere positions on the 12 rice chromosomes, 139 markers were assigned to re-spective chromosome arms through dosage analysis, as described in Singh et al. (1996). The main source of
the markers mapped at random sites were ESTs in rice
(Sasakiet al. 1994; reviewed by Yamamoto and Sasaki
1997). Two types of ESTs were mapped: randomly se-lected ESTs and those showing similarity to interesting genes such as ribosomal protein genes (Wuet al. 1996)
and aspartate aminotransferase genes (Song et al.
1996).
One of the aims of this mapping study was to eluci-date situations of 3532 randomly selected ESTs from Nipponbare callus, root, and shoot libraries. The poly-morphism frequency of ESTs between japonica and in-dica cultivars, redundancy of ESTs, and copy number of each EST were determined, and a similarity search of mapped ESTs was made. We scored genotypes of mark-ers with care to avoid map inflation. Only a high-resolu-tion and marker-dense genetic map constructed from a single cross would permit us to characterize positions and frequencies of meiotic recombination events in the entire genome in detail.
M AT E R I A L S A N D M E T H O D S
Plant DNA, Southern hybridization, and map construc-tion: The 186 F2 plant mapping population used was derived from rice cultivars Nipponbare and Kasalath as described pre-viously (Kurataet al. 1994b; Nagamuraet al. 1995). To con-tinue construction of the rice genetic map using the same progeny, genomic DNA of F2 plants from z100 F3 seedlings was retrieved. The quality of the retrieved DNA was con-firmed by Southern blot analysis using seven RFLP markers (C198, C582, C1135, and R1925 on chromosome 3, R3011 on chromosome 6, S779 on chromosome 8, and R2316 on chro-mosome 11). DNA extraction, electrophoresis, blotting, probe labeling, and detection were performed as described previ-ously (Kurata et al. 1994b; Nagamura et al. 1995). Linkage analysis was performed using MAPMAKER/EXP 3.0 (Lander
et al. 1987) as described in Kurata et al. (1994b). Preferred orders of markers with different positions on entire chromo-somes were checked by the “ripple” command with window size 5 and an LOD threshold of 2.0.
Markers: The sources of polymorphic DNA markers for map construction were cDNAs from Nipponbare callus (C numbers), cDNAs from Nipponbare root (R numbers), ran-domly selected Nipponbare genomic clones (G numbers),
NotI-linking Nipponbare genomic clones (L numbers),
Nip-ponbare YAC-end clones (Y numbers), NipNip-ponbare subtelo-mere clones (TEL numbers), and wheat clones (W numbers), as described previously (Kurata et al. 1994a,b; Ashikawa et
al. 1994). Four additional types of polymorphic DNA markers
analyzed in this study were cDNAs from Nipponbare shoot (S numbers), cDNAs from shoot of a near-isogenic line, “LR,” for photoperiod sensitivity-1 gene (Yokoo and Kikuchi, 1978; F numbers), barley clones from the North American Barley Genome Mapping Project and Andreas Graner (B
num-bers), and maize clones from the University of Missouri (M numbers). Nipponbare shoot cDNA libraries were prepared from etiolated shoot (S with numbers ,10,000) and green shoot (S with numbers .10,000) with the SuperScript Plas-mid System (Bethesda Research Laboratories, Gaithersburg, MD), as described in Sasaki et al. (1994). The cDNA inserts of C, R, and S were sequenced from the 59 end for 300–400 bp, and were searched for sequence similarities in both the PIR (Rel. 48.0) and SWISS-PROT (Rel. 33) protein databases with version 2.0u5 of the FASTX program (Pearson and Lipman 1988). The BLOSUM50 matrix was used as a substitution ma-trix for scoring similarity (Henikoff and Henikoff 1992). Af-ter a similarity search, clones showing the best score with the expected value ,0.0001 were considered as functionally iden-tical clones. We used random amplified polymorphic DNA markers (P numbers) and sequence-tagged site markers (T numbers) as described previously (Fukuoka et al. 1994; Ku-rata et al. 1994b; Monna et al. 1994, 1995; Miyao et al. 1996). Forty-three P markers were converted to RFLP markers by cloning the amplified polymorphic fragment. Markers de-noted with V and other symbols are clones developed by other research groups. Morphological markers of phenol staining (Ph), brown pericarp (Rc), and alkali digestion (alk) were examined phenotypically using the F3 seeds from 186 F2 plants (Lin et al. 1994).
Determination of location of RFLP markers on chromo-some arms and centromere mapping: The locations of RFLP markers were determined by dosage analysis in F1 primary and secondary trisomics of IR36 and MaHae, as described in Singh et al. (1996). The positions of the centromeres were mapped as being between the nearest two markers located on the short and long arms of a chromosome.
Analysis of recombination: The positions of recombina-tion in the 186 F2 plants were estimated from the interval be-tween the marker positions in homozygous and heterozygous genotypes, respectively; the number of recombinations and the segment length of each genotype were analyzed by the 4th Dimension Macintosh relational database.
R E S U LT S A N D D I S C U S S I O N
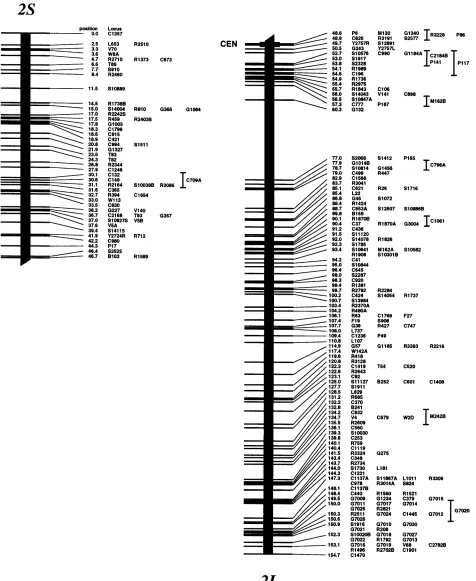
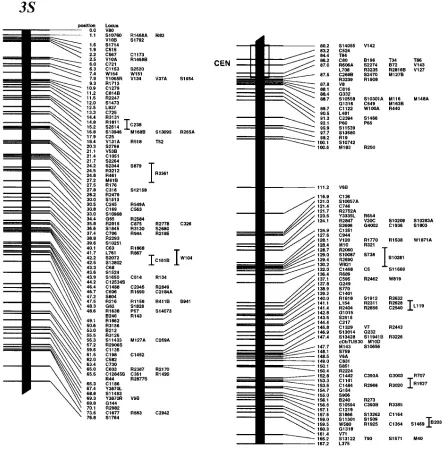
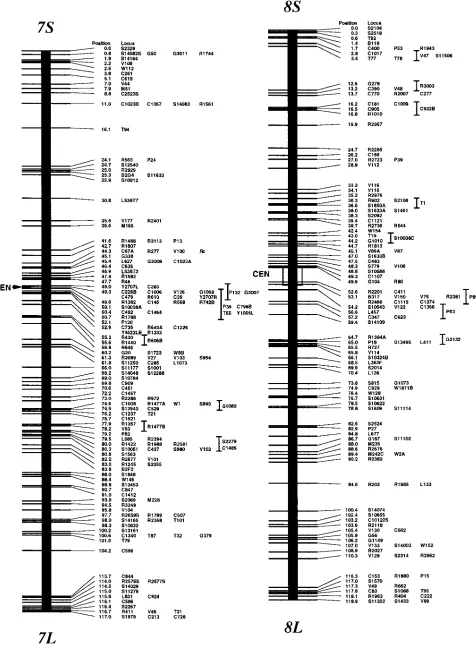
Genetic map: We have mapped a total of 2275 markers with 1174 discrete positions on the rice ge-nome, covering 1521.6 cM in the Kosambi function as shown in Figure 1. If we assume that this map covers the whole genome (haploid 4.3 3 108 bp;
Arumuga-nathan and Earle 1991), then the markers are
lo-cated every 190 kb on average. The orientation of seven linkage groups (chromosomes 1, 2, 3, 4, 8, 11, and 12) has been reversed from our previous map (Kurata et
al. 1994b), following the conclusions of Singh et al.
(1996) on centromere mapping.
We have added 934 new markers to the previous map that was composed of 1383 markers covering 1575 cM using the same F2 population (Kurata et al. 1994b),
There were only 19 sites where the best marker order was not significantly higher than the second one at the LOD threshold of 2.0, in the 1174 frame marker order. Most of the second marker order of these sites was in-versions between the two most proximal markers that contain double crossovers. The decrease in the total length of the current map is mainly caused by correc-tions of genotypes associated with markers. Although the map is shorter, the new markers have extended the short arm ends of chromosomes 3, 6, 7, and 8 by 1.1, 0.9, 0.8, and 1.7 cM, respectively, and the long arm ends of chromosomes 8 and 9 by 1.3 and 1.4 cM, re-spectively. Our new genetic map appears to cover the whole genome, because the extensions of the map ends by the additional 934 markers were ,2 cM. Our previ-ous map was one of the densest molecular maps, and the average distance between adjacent markers was 1.1 cM. The markers, however, were not evenly distrib-uted. The marker-dense regions where the nearest markers were ,2 cM apart were composed only 33% of the total, and there were 60 gaps where the distance be-tween adjacent markers was .5 cM. The additional 934 markers have increased the coverage of the marker-dense region to 46%, and they have decreased the number of gaps to 39.
The first-generation physical map of the rice genome was constructed with Nipponbare YAC clones by land-ing on our previous genetic map; it covered half of the rice genome (Umehara et al. 1996, 1997; Antonio et
al. 1996a; Saji et al. 1996; Wang et al. 1996; Koike et al.
1997; Shimokawa et al. 1996; Tanoue et al. 1997;
re-viewed by Kurata et al. 1997). We expect to constuct a
physical map with .70% genome coverage using the current high density molecular genetic map.
To determine centromere positions on our genetic map, 139 markers on 12 chromosomes were identified to specific chromosome arms through dosage analysis according to the previous work (Singh et al. 1996), and
tentative centromere locations on the 12 chromosomes are shown in Figure 1. In chromosomes 1, 7, 9, and 11, the centromere was located at one specific map posi-tion where markers on opposite arms cosegregated at 73.5, 49.3, 0.8, and 55.5 cM from the ends of short arms, respectively. For chromosomes 2–6, 8, 10, and 12, centromere locations are defined by two flanking mark-ers on opposite arms that span 0.3-, 6.8-, 3.6-, 1.4-, 1.1-, 3.5-, 5.5-, and 3.3-cM lengths, respectively. Since the maximum resolution of the genetic map in this popula-tion using 186 F2 plants is 0.3 cM, the centromere
posi-tion on chromosome 2 is either 48.6 or 48.9 cM from the end of the short arm. Seventeen markers cosegre-gated at the centromere position of chromosome 9. Four nonoverlapping YACs were assigned by using 11 markers at the centromere position of chromosome 9; the minimum tiling path for this region is estimated to be 1.8 Mb (Antonio et al. 1996a). In chromosomes 1,
7, and 11, total lengths of nonoverlapping YACs
as-signed at the centromere are z2.3, 1.9, and 1 Mb, re-spectively (Wang et al. 1996; Koike et al. 1997; Tanoue
et al. 1997). Since the average physical length per
centi-morgan at this genome size (haploid; 4.3 3 108 bp)
(Arumuganathan and Earle 1991) and the total
ge-netic map length (1521.6 cM; see Table 2) is 280 kb, re-combination in the centromeric region must be sup-pressed. An inhibition of meiotic recombination by centromeres was first suggested by Dobzhansky (1930)
and demonstrated through a cloned centromere in yeast (Lambie and Roeder, 1986). There are
marker-dense positions on chromosomes 3–6, 8, 10, and 12, where more than five markers cosegregated in every re-gion between centromere-flanking markers (Figure 1). Many markers at these positions cosegregated because of the presence of the centromere.
Much more frequent recombination in regions of chromosomes distal to the centromere has been pro-posed, based on studies on tomato (Tanksley et al.
1992), linkage analysis of the C bands of wheat (Curtis
and Lukaszewski 1991), and deletion mapping of
wheat (Werner et al. 1992). In the rice genetic map,
the inhibition of meiotic recombination by the cen-tromere must be limited to the narrow region around the centromere because the values of physical length per centimorgan are sometimes lower than expected values, even within 5 cM from the centromere. For ex-ample, the physical length per centimorgan between R643 and C492 was ,182 kb (Koike et al. 1997), and
C492 was 1.1 cM from the centromere on chromosome
7 (Figure 1). Another example is that the end clones of
a 319-kb insert YAC (Y1053) were 2.3 cM apart from each other, and they were mapped as being in the vicin-ity of the centromere on chromosome 10, as shown in Figure 1 (Umehara et al. 1995; Shimokawa et al. 1996).
The limited influence of rice centromeres on recom-bination inhibition is similar to the situation reported in the physical map of chromosome 4 of Arabidopsis
thaliana (Schmidt et al. 1995). In wheat, recent
com-parison of a physical map with the genetic map with an array of 65 deletion lines for homoeologous group 5 chromosomes revealed that recombination was sup-pressed in the centromeric region, and that the fre-quency of recombination might depend on the region rather than on the relative distance from the cen-tromere (Gill et al. 1996). This recent finding
con-cerning the distribution of recombinations in wheat is similar to that in rice.
Anonymous cDNA screening for markers: In the Rice Genome Research Program, a large number of cDNAs from various rice tissues and calli have been isolated and characterized with the aim of cataloging all ex-pressed genes in rice (Sasaki et al. 1994; reviewed by
Yamamoto and Sasaki 1997). These sequenced
bare and Kasalath by eight kinds of restriction enzymes,
BamHI, BglII, EcoRV, HindIII, ApaI, DraI, EcoRI, and KpnI, for 3532 randomly selected cDNA clones. The
numbers of cDNA clones analyzed from each tissue li-brary were as follows: 1072 from callus, 1117 from root,
727 from etiolated shoot, and 616 from green shoot. From the results of Southern blot analyses, 1310 clones (37% of analyzed anonymous cDNA clones) were used and mapped at 1403 loci in the current genetic map. Nearly half of the analyzed clones could not be used for
RFLP mapping because they showed monomorphic bands (705 clones), multiple bands, or smeared back-ground (887 clones). Another 630 cDNA clones (18% of analyzed clones) showed the same Southern band-ing patterns as the previously mapped cDNA clones.
A summary of the frequency of redundant clones in 3532 anonymous cDNA clones is given in Table 1. Twenty-seven clones appeared redundantly more than six times in RFLP analysis. All the sequences of these clones showed similarities to known genes except C854 on chromosome 1. One-third of the highly redundant clones were mapped at more than one locus, and only four clones were considered to be single-copy genes by
Southern analyses. With few exceptions, the redundant clones did not show tissue specificity. The alcohol de-hydrogenase 1 clone (C496 on chromosome 11) ap-peared only in the callus library. Chlorophyll a/b-bind-ing protein (S10558 on chromosome 3) appeared only in the green shoot library. Two types of tissue-specific thionin that were toxic to various bacteria, fungi, ani-mal cells, and plant cells appeared highly redundant. One clone (R1382 on chromosome 7) appeared only in the root library, and the other (S1809 on chromo-some 6) appeared only in the etiolated shoot library.
Most of the cDNA markers derived from Nippon-bare have allelic bands in the Kasalath genome in
Southern analyses. To learn the frequency of expressed genes in Nipponbare that have no allelic gene in the Kasalath genome, we focused on the single-copy clones. Of the 3532 analyzed cDNA clones, 1307 were consid-ered to be copy genes. Among the 1307
single-copy clones, 650 clones were mapped, 234 clones were redundant to previously mapped clones, and 423 clones were monomorphic. Four single-copy Nippon-bare cDNA clones showed no allelic bands in the Kasalath genome. These four loci are S14051 at z123.5
cM on chromosome 1, C708 at 15.4 cM on chromo-some 4, S846 at 74.6 cM on chromochromo-some 7, and R887 at 50.8 cM on chromosome 12. There are no common features in the location of these genes. The sequences of the four clones showed no similarities to known genes.
Sequence similarities to known genes in PIR release 48 (82,182 sequences) and SWISSPROT release 33 (52,205 sequences) were sought for the sequences of
all mapped cDNAs with version 2.0u5 of the FASTX program (Pearson and Lipman 1988). The 585 cDNA
clones representing 615 loci show significant similari-ties with known genes (detailed results will be accessi-ble at http://www.dna.affrc.go.jp:84/). Of the 615 loci, 201 loci were mapped by the addtional clones, and 414 loci were mapped in our previous map (Kurata et al.
1994b). Kurata et al. (1994b) detected similarities
be-tween 258 loci with known genes in PIR release 37. The
TABLE 1
Redundancy of randomly selected 3532 ESTs revealed by RFLP analysis
A B Protein Organism C D E F G H Loci
2 194 3 41 4 26
5 8
6 Methionine adenosyltransferase (EC 2.5.1.6)
Acanthamoeba castellanii
0 5 0 1 M 3 R2167, chr1, 58.4 cM: R2280, chr1, 65.9 cM:R476B, chr5, 20.9 cM 6 Nonspecific lipid transfer protein
Cw-21
Hordeum vulgare
0 0 6 0 M 3 S790C, chr11, 2.7 cM: S790A, chr11, 55.8 cM: S790B, chr12, 9.5 cM:
6 Hemoglobin H. vulgare 5 1 0 0 M 1 C245, chr3, 30.5 cM: 6 Aspartate aminotransferase,
cytoplas-mic isozyme 2 (EC 2.6.1.1)
Arabidopsis thaliana
4 1 1 0 M 1 C250, chr1, 132.4 cM:
6 GOS2 protein O. sativa 3 2 1 0 M 1 C1467, chr7, 72.2 cM: 6 Glutathione S-transferase I Z. mays 0 6 0 0 M 1 R37, chr1, 132.4 cM: 7 Phosphoglycerate kinase (EC 2.7.2.3),
cytosolic
Triticum aestivum
5 1 1 0 M 2 R2403S, chr2, 17.5 cM: R2403, chr6, 106 cM:
7 DNA-binding protein MNB1b Z. mays 4 2 1 0 S 1 C607, chr6, 123.1 cM:
7 — — 1 1 4 1 S 1 C854, chr1, 126.8 cM:
7 5-Methyltetrahydropteroyltrigluta-mate-homocysteine methyltrans-ferase (EC 2.1.1.14)
Haemophilus influenzae
0 4 2 1 M 1 R1759, chr12, 108 cM:
8 dTDP-glucose 4-6-dehydratases homolog
A. thaliana 2 6 0 0 S 1 C614, chr3, 43.9 cM:
8 Tubulin a-1 chain O. sativa 4 2 1 1 M 1 C1468, chr3, 132 cM: 8 Transmembrane protein Z. mays 0 3 4 1 M 1 R427, chr2, 107.7 cM: 8 Thionin precursor, leaf H. vulgare 0 8 0 0 M 1 R1382, chr7, 49.6 cM: 9 Histone H4 (TH091) T. aestivum 8 1 0 0 M 4 C79, chr4, 97.6 cM: C2161,
chr5, 92.8 cM: C1521, chr7, 75.7 cM: C2070, chr9, 61.5 cM: 9 Ubiquitin precursor Ubi-1 Z. mays 2 5 1 1 M 1 R810, chr2, 15 cM
9 ADP, ATP carrier protein precursor O. sativa 3 6 0 0 M 2 C92, chr2, 123.1 cM: R2266B, chr6, 86.7 cM:
9 Heat shock protien 82 O. sativa 5 3 1 0 M 2 R1562, chr9, 70.8 cM: C985, chr9, 84.7 cM:
9 Leaf-specific thionin precursor H. vulgare 0 0 9 0 M 1 S1809, chr6, 66.1 cM: 10 Heat shock protein 70 O. sativa 3 6 1 0 M 5 C549, chr3, 88.7 cM: C1000,
chr1, 143.5 cM: R2702B, chr2, 153.1 cM: R3182, chr5, 92.0 cM: S1524, chr3, 43.6 cM:
10 Glyceraldehyde-3-phosphate dehydrogenase, cytosolic
Ranunculus acer
6 4 0 0 M 1 C37, chr2, 90.4 cM:
14 Chlorophyll a/b-binding protein II precursor
O. sativa 0 0 0 14 M 1 S10558, chr3, 88.7 cM:
17 Alcohol dehydrogenase 1 (EC 1.1.1.1).
O. sativa 17 0 0 0 M 1 C496, chr11, 30.3 cM:
17 Glyceraldehyde 3-phosphate dehydrogenase 2 (EC 1.2.1.12)
Caenorhabditis briggsae
7 10 0 0 S 1 R896, chr4, 74.8 cM:
18 Fructose-bisphosphate-aldolase (EC 4.1.2.13), cytoslic
O. sativa 9 7 1 1 M 3 R2657A, chr1, 158 cM: R2657C,
chr10, 9.75 cM: C2269S, chr5, 72.5 cM:
19 Enolase 2 (EC 4.2.1.11) Z. mays 7 10 1 1 M 2 C913A, chr10, 11 cM: R2185, chr3, 37.4 cM:
26 Translation elongation factor eEF-1 a chain
T. aestivum 8 9 8 1 M 1 R518, chr3, 18.4 cM:
increase in the number of known gene loci is caused in part by enlargement of the target amino acid sequence database: PIR release 48 has 25,333 more sequences than release PIR 37.
Many family genes were located in the genetic map. Ribosomal protein genes, protein kinase genes, peroxi-dase genes, and histone genes were mapped at 69, 31, 27, and 20 loci, respectively. Among the 69 ribosomal protein clones, 43 were the genes for the large subunit, and the other 26 clones were for the small subunit. The locations of the 69 ribosomal protein genes were scat-tered on the 12 chromosomes, as reported previously (Wu et al. 1995). No ribosomal protein clones appeared
more than six times in anonymous cDNA screening (Table 1). The locations of the protein kinase genes were also scattered throughout the entire genome, ex-cept on chromosomes 4 and 10, and no clones ap-peared frequently in anonymous cDNA screening. Per-oxidase clones were mapped on all chromosomes except chromosomes 8 and 9. Histones H1, H2A, H2B, H3, and H4 were mapped at 1, 6, 3, 5, and 5 loci, re-spectively. Most histone clones were from the callus cDNA library. Three of four nucleosome histone clones, histones H2A, H3, and H4, appeared z10 times each among the 3532 clones in the anonymous cDNA screen-ing. The other nucleosome histone clone, H2B, appeared five times. The evolution of the histone H4 gene is known to have been one of the slowest, and the quence variations of histone H4 genes in the public se-quence databases are less than those of histone H2A genes (Thatcher and Gorovsky 1994). The
differ-ences in the sequence and the Southern images among histone H2A clones mapped at six loci were larger than those among histone H4 clones mapped at five loci. The variations of histone H4 genes in the rice genome is also less than that of histone H2A genes.
Forty-nine isozyme loci are known in rice: 31 have been associated with respective chromosomes, and 13 have been mapped in classical linkage maps (
Mori-shima and Glaszmann 1990; Kinoshita 1993).
Al-though no isozyme marker was used, cDNA clones that were putatively identified as isozyme genes have been mapped in the present high-density linkage map. Isoci-trate dehydrogenase 1 (Icd-1), malate dehydrogenase 1
(Mal-1), and aspartate aminotransferase 1 (Got-1) were associated with chromosome 1. C399 (isocitrate dehy-drogenase) and R886 (malate dehydehy-drogenase) were mapped at 43.4 and 110.6 cM on chromosome 1, re-spectively. Three aspartate aminotransferase isozyme genes, Got-1, Got-2, and Got-3, were associated with chro-mosomes 1, 6, and 2, respectively. On the other hand, four loci were determined by aspartate aminotrans-ferase cDNA clones in the present map (Song et al.
1996). Either of the two loci mapped by the cDNA clones on chromosome 1, C250 at 132.4 cM or R1764 at 146.7 cM, may correspond to Got-1 in the classical map. C60213 at 71.5 cM on chromosome 6 and C2168 at 36.7 cM on chromosome 2 would correspond to Got-2 and Got-3, respectively. Two phosphoglucose isomerase isozyme loci, Pgi-1 and Pgi-2, were associated with chromo-somes 3 and 6, respectively. C1329 and V7 at 145.8 cM on chromosome 3 would correspond to Pgi-1, and ei-ther V19A at 50.4 cM or V19B at 49.7 cM on chromo-some 6 would correspond to Pgi-2 (Nozue et al. 1996).
The phosphogluconate dehydrogenase isozyme locus,
Pgd-2, and the catalase isozyme locus, Cat-1, would
cor-respond to R2869 at 3.0 cM and R1167 at 123.1 cM,
TABLE 2
Distribution of the number of recombinations per chromosome and plant
Chromosomes 1 2 3 4 5 6 7 8 9 10 11 12 Total
Genetic length 181.7 154.7 167.2 129.5 119.5 125 117 118.8 96.1 83.7 118.6 110.1 1521.9 Mean 3.56 3.01 3.25 2.49 2.31 2.40 2.30 2.32 1.78 1.62 2.31 2.06 29.43 Variance 2.64 1.89 2.17 1.43 1.61 1.58 1.16 1.17 0.94 0.94 1.38 1.00 23.87 Coefficient of
dispersion 0.740 0.628 0.667 0.573 0.697 0.658 0.506 0.504 0.525 0.581 0.598 0.485 0.811
Minimum 0 0 0 0 0 0 0 0 0 0 0 0 19
Maximum 8 8 8 6 7 6 5 5 5 4 6 4 46
respectively, both on chromosome 6. The alanyl ami-nopeptidase isozyme locus, Amp-2, would correspond to R1963 at 118.1 cM on chromosome 8. The alcohol dehydrogenase isozyme locus, Adh-1, would correspond to C496 at 30.3 cM on chromosome 11.
Detection of crossover interference: A genetic dis-tance is defined on the assumption that recombination occurs at random in the map; however, the occurrence of one crossover inhibits the formation of another nearby, a phenomenon known as “crossover interfer-ence” or “chiasma interferinterfer-ence” (Sturtevant 1915;
Muller 1916). Because of the low number of
informa-tive classical markers segregating in a single cross, only limited information about the process of recombina-tion in the whole genome could be obtained from each cross. In plants, the cytologically observed number of chiasmata during meiosis has been considered to cor-respond to the number of crossovers, and interfer-ence has been studied by counting chiasmata (Haldane
1931). Recent investigations, however, give different results. Estimated numbers of crossovers by chias-mata counts are fewer than those by RFLP linkage map length (Nilsson et al. 1993), and the distribution of
crossovers estimated by RFLP linkage map does not in-dicate interference (Säll and Nilsson 1994). To
re-solve this matter, we investigated the numbers and loca-tions of the meiotically recombined posiloca-tions in each analyzed plant.
The numbers of recombinations were determined by counting the genotype changes from homozygote to heterozygote and vice versa, along with the map for each plant. The distributions of the number of recom-binations per chromosome and per plant were ana-lyzed, and the means and the variances are listed in Ta-ble 2. If the recombinations on each chromosome were completely random, a Poisson distribution with the variance equal to the mean would be expected (Haldane
1931). A coefficient of dispersion, a ratio of a variance to a mean of distribution, can be used to test the Pois-son distribution. This value will be near 1 in distribu-tions that are essentially Poisson, ,0.795 in the 186 samples of repulsion for 1% significance. In the distri-bution of number of recombinations per each chromo-some, the values of the coefficient of dispersion were significantly ,1, indicating that interference was effec-tive within a chromosome (Table 2). The value of the variance linearly increased with the value of the mean, suggesting that the strength of the interference was al-most the same on every chromosome. Because the value of the coefficient of dispersion of the distribution of the number of recombinations per plant was not sig-nificantly ,1, the interference was effective only within chromosomes.
An estimated mean value for the number of recom-binations per plant from the total genetic map length, 1521.9 cM, is 30.4; however, the mean value of recombi-nations per plant estimated by counting the genotype
changes along with the map for each plant is 29.4. The difference may be caused by the Kosambi map function for the intervals between markers, since the differences were larger on chromosomes with large gaps, for exam-ple, chromosomes 9 and 12.
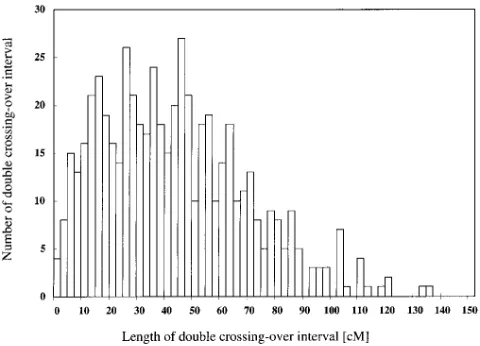
Positive interference is also suggested by the lower frequency of double crossovers within short intervals than would be expected in the absence of interference. Because we have used F2 plants to construct the linkage
map, we could not distinguish which gametes were the result of recombination and thus determine all double crossovers. Heterozygous intervals between the same homozygous genotypes, however, are the result of dou-ble crossover. We observed 555 doudou-ble crossovers with various intervals in the 186 analyzed plants. The distri-bution of the double crossover intervals is shown in Fig-ure 2. A constant frequency would be expected if there were no interference on an infinitely long chromo-some, given adequate marker density. However, the number of double crossover intervals with ,5 cM was significantly lower than that of longer intervals, even though the genome coverage with shorter interval marker density is 80%. The low numbers of intervals at
.60 cM would be caused by the limits of chromosome length.
Clone and data availability: All clones and probes developed by RGP have been deposited and are avail-able for research purposes from the MAFF DNA Bank at the National Institute of Agrobiological Resources (http://bank.dna.affrc.go.jp). All the cDNA and ge-nomic sequence data have been deposited at DDBJ, and they are available through DDBJ, GenBank, or EMBL. Detailed information about the DDBJ sequence accession numbers, the gene name with a significant similarity, insert size, Southern hybridization image, and F2 segregation data for all DNA markers will also be
accessible (http://www.dna.affrc.go.jp:84/). For wheat (W), barley (B), and maize (M) clones, the correspond-ing locus names on the molecular maps of those spe-cies will also accessible at that same electronic address.
We thank M. Gale and M. McMullen for providing wheat and
maize clones, respectively; A. Kleinhofs and A. Graner for
provid-ing barley clones; M. Nakagahra, Y. Minobe, K. Hasegawa and H. Morishima for advice and encouragement; and all the other
mem-bers of the Japanese Rice Genome Research Program for their fruit-ful cooperation. This work was supported by the Ministry of Agricul-ture, Forestry, and Fisheries of Japan, as well as by the Japan Racing Association.
L I T E R AT U R E C I T E D
Ahn, S., and S. D. Tanksley, 1993 Comparative linkage maps of the
rice and maize genomes. Proc. Natl. Acad. Sci. USA 90: 7980– 7984.
Antonio, B. A., M. Emoto, J. Wu, Y. Umehara, N. Kurata et al.,
1996a Physical mapping with rice YACs on chromosomes 8 and
9. DNA Res. 3: 393–400.
Antonio, B. A., T. Inoue, H. Kajiya, Y. Nagamura, N. Kurata et al.,
Arumuganathan, K., and E. D. Earle, 1991 Nuclear DNA content
of some important plant species. Plant Mol. Biol. Reporter 9: 208–218.
Ashikawa, I., N. Kurata, Y. Nagamura and Y. Minobe, 1994
Clon-ing and mappClon-ing of telomere-associated sequences from rice. DNA Res. 1: 67–76.
Causse, M. A., T. M. Fulton, Y. G. Cho, S. N. Ahn, J. Chunwongse et al., 1994 Saturated molecular map of the rice genome based on an interspecific backcross population. Genetics 138: 1251– 1274.
Curtis, C. A., and A. J. Lukaszewski, 1991 Genetic linkage
be-tween C-bands and storage protein genes in chromosome 1B of tetraploid wheat. Theor. Appl. Genet. 81: 245–252.
Dobzhansky, T., 1930 Translocations involving the third and
fourth chromosomes of Drosophila melanogaster. Genetics 15: 347– 399.
Fukuoka, S., T. Inoue, A. Miyao, L. Monna, H.S. Zhong et al., 1994
Mapping of sequence-tagged sites in rice by single strand confor-mation polymorphism. DNA Res. 1: 271–277.
Gill, K. S., B. S. Gill, T. R. Endo and E. V. Boyko, 1996
Identifica-tion and high-density mapping of gene-rich regions in chromo-some group 5 of wheat. Genetics 143: 1001–1012.
Haldane, J. B. S., 1931 The cytological basis of genetical
interfer-ence. Cytologia 3: 54–65.
Harushima, Y., N. Kurata, M. Yano, Y. Nagamura, T. Sasaki et al.,
1996 Detection of segregation distortions in an indica-japonica rice cross using a high-resolution molecular map. Theor. Appl. Genet. 92: 145–150.
Havukkala, I. J., 1996 Cereal genome analysis using rice as a
model. Current Opinions in Genetics Dev. 6: 711–714.
Henikoff, S., and J. G. Henikoff, 1992 Amino acid substitution
matrices from protein blocks. Proc. Natl. Acad. Sci. USA 89: 10915–10919.
Hiei, Y., S. Ohta, T. Komari and T. Kumashiro, 1994 Efficient
transformation of rice (Oryza sativa L.) mediated by
Agrobacte-rium and sequence analysis of the boundaries of the T-DNA.
Plant J. 6: 271–282.
Izawa, T., and K. Shimamoto, 1996 Becoming a model plant: the
importance of rice to plant science. Trends Plant Sci. 1: 95–99.
Kinoshita, T., 1993 Report of the committee on gene
symboliza-tion, nomenclature and linkage group. Rice Genet. Newsl. 10: 7– 39.
Koike, K., K. Yoshino, N. Sue, Y. Umehara, I. Ashikawa et al.,
1997 Physical mapping of rice chromosome 4 and 7 using YAC clones. DNA Res. 4: 27–33.
Kurata, N., G. Moore, Y. Nagamura, T. Foote, M. Yano et al.,
1994a Conservation of genome structure between rice and wheat. Bio/Technology 12: 276–278.
Kurata, N., Y. Nagamura, K. Yamamoto, Y. Harushima, N. Sue et al., 1994b A 300 kilobase interval genetic map of rice including 883 expressed sequences. Nature Genetics 8: 365–372.
Kurata, N., Y. Umehara, H. Tanoue and T. Sasaki, 1997 Physical
mapping of the rice genome with YAC clones. Plant Mol. Biol.
35: 101–113.
Lambie, E. J., and G. S. Roeder, 1986 Repression of meiotic
cross-ing over by a centromere (CEN3) in Saccharomyces cerevisiae. Ge-netics 114: 769–789.
Lander, E. S., P. Green, J. Abrahamson, A. Barlow, M. J. Daly et al., 1987 MAPMAKER: an interactive computer package for constructing primary genetic linkage maps of experimental and natural populations. Genomics 1: 174–181.
Lin, S.-Y., Y. Nagamura, N. Kurata, M. Yano, Y. Minobe et al.,
1994 DNA markers tightly linked to genes, Ph, alk and Rc. Rice Genet. Newsl. 11: 108–109.
McCouch, S. R., G. Kochert, Z. H. Yu, Z. Y. Wang, G. S. Khush et al., 1988 Molecular mapping of rice chromosomes. Theor. Appl. Genet. 76: 815–829.
Miyao, A., H.S. Zhong, L. Monna, M. Yano, K. Yamamoto et al.,
1996 Characterization and genetic mapping of simple se-quence repeats in the rice genome. DNA Res. 3: 233–238.
Monna L., A. Miyao, T. Inoue, S. Fukuoka, M. Yamazaki et al.,
1994 Determination of RAPD markers in rice and their conver-sion into sequence tagged sites (STSs) and STS-specific primers. DNA Res. 1: 139–148.
Monna, L., A. Miyao, H. S. Zhong, T. Sasaki and Y. Minobe,
1995 Screening of RAPD markers linked to the
photoperiod-sensitivity gene in rice chromosome 6 using bulked segregant analysis. DNA Res. 2: 101–106.
Monna L., A. Miyao, H. S. Zhong, M. Yano, M. Iwamoto et al.,
1997 Saturation mapping with subclones of YACs: DNA marker production targeting the rice blast disease resistance gene, Pi-b. Theor. Appl. Genet. 94: 170–176.
Moore, G., K. M. Devos, Z. Wang and M. D. Gale, 1995 Grasses,
line up and form a circle. Curr. Biol. 5: 737–739.
Morishima, H., and J. C. Glaszmann, 1990 Current status of
isozyme gene symbols. Rice Genet. Newslett. 7: 50–57.
Muller, H. J., 1916 The mechanism of crossing-over. Am. Nature 50: 193–221; 284–305; 350–366; 421–434.
Nagamura, Y., T. Inoue, B. A. Antonio, T. Shimano, H. Kajiya et al.,
1995 Conservation of duplicated segments between rice chro-mosomes 11 and 12. Breed. Sci. 45: 373–376.
Nagamura, Y., B. A. Antonio and T. Sasaki, 1997 Rice molecular
genetic map using RFLPs and its applications. Plant Mol. Biol.
35: 79–87.
Nilsson, N.-O., T. Säll and B. O. Bengtosson, 1993 Chiasma and
recombination data in plants: are they compatible? Trends Genet. 9: 344–348.
Nozue, F., M. Umeda, Y. Nagamura, Y. Minobe and H. Uchimiya,
1996 Characterization of cDNA encoding for phosphoglucose isomerase of rice (Oryza sativa L.) DNA Seq. 6: 127–135.
Pearson, W. R., and D. J. Lipman, 1988 Improved tools for
biologi-cal sequence comparison. Proc. Natl. Acad. Sci. USA 85: 2444– 2448.
Saito, A., M. Yano, N. Kishimoto, M. Nakagahra, A. Yoshimura et al., 1991 Linkage map of restriction fragment length polymor-phism loci in rice. Japan J. Breed. 41: 665–670.
Saji, S., Y. Umehara, N. Kurata, I. Ashikawa and T. Sasaki,
1996 Construction of YAC contigs on rice chromosome 5. DNA Res. 3: 297–302.
Säll, T., and N.-O. Nilsson, 1994 Crossover distribution in barley
analysed through RFLP linkage data. Theor. Appl. Genet. 89: 211–216.
Sasaki, T., J. Song, Y. Koga-Ban, E. Matsui, F. Fang et al., 1994
To-ward cataloguing all rice genes: large-scale sequencing of ran-domly chosen rice cDNAs from a callus cDNA library. Plant J. 6: 615–624.
Schmidt, R., J. West, K. Love, Z. Lenehan, C. Lister et al., 1995
Physical map of organization of Arabidopsis thaliana chromosome
4. Science 270: 480–483.
Shimamoto, K., R. Terada, T. Izawa and H. Fujimoto, 1989
Fer-tile transgenic rice plants regenerated from transformed proto-plasts. Nature 338: 274–276.
Shimokawa, T., N. Kurata, J. Wu, Y. Umehara, I. Ashikawa et al.,
1996 Assignment of YAC clones spanning rice chromosome 10 and 12. DNA Res. 3: 401–406.
Singh, K., T. Ishii, A. Parco, N. Huang, D. S. Brar et al.,
1996 Centromere mapping and orientation of the molecular linkage map of rice. Proc. Natl. Acad. Sci. USA 93: 6163–6168.
Song, J., K. Yamamoto, A. Shomura, M. Yano, Y. Minobe et al.,
1996 Characterization and mapping of cDNA encoding aspar-tate aminotransferase in rice, Oryza sativa L. DNA Res. 3: 303– 310.
Song, W.-Y., G.-L. Wang, L.-L. Chen, H.-S. Kim, L.-Y. Pi et al.,
1995 A receptor kinase-like protein encoded by the rice disease resistance gene, Xa21. Science 270: 1772–1804.
Sturtevant, A. H., 1915 The behavior of the chromosomes as
studied through linkage. Z. Induk. Abstammungs Vererbungsl.
13: 234–287.
Tanksley, S. D., M. W. Ganal, J. P. Prince, M. C. de Vicente, M. W. Bonierbale et al., 1992 High density molecular linkage maps
of the tomato and potato genomes. Genetics 132: 1141–1160.
Tanoue, H., T. Shimokawa, J. Wu, N. Sue, Y. Umehara et al.,
1997 Ordered YAC clone contigs assigned to rice chromosome
3 and 11. DNA Res. 4: 133–140.
Thatcher, T. H., and M. A. Gorovsky, 1994 Phylogenetic analysis
of the core histones H2A, H2B, H3, and H4. Nucleic Acids Res.
22: 174–179.
Umehara, Y., A. Inagaki, H. Tanoue, Y. Yasukochi, Y. Nagamura et al., 1995 Construction and characterization of a rice YAC li-brary for physical mapping. Mol. Breed. 1: 79–89.
Umehara, Y., H. Tanoue, N. Kurata, I. Ashikawa, Y. Minobe et al.,
of rice chromosome 6. Genome Res. 6: 935–942.
Umehara, Y., N. Kurata, I. Ashikawa and T. Sasaki, 1997 Yeast
ar-tificial chromosome clones of rice chromosome 2 ordered using DNA markers. DNA Res. 4: 127–131.
Wang, Z. X., A. Idonuma, Y. Umehara, W. Van Houten, I. Ashikawa et al., 1996 Physical mapping of rice chromosome 1 with yeast artificial chromosomes (YACs). DNA Res. 3: 291–296.
Werner, J. E., T. R. Endo and B. S. Gill, 1992 Toward a
cytogeneti-cally based physical map of the wheat genome. Proc. Natl. Acad. Sci. USA 89: 11307–11311.
Wu, J., E. Matsui, K. Yamamoto, Y. Nagamura, N. Kurata et al.,
1995 Genomic organization of 57 ribosomal protein genes in rice (Oryza sativa L.) through RFLP mapping. Genome 38:
1189–1200.
Yano M., Y. Harushima, Nagamura, N. Kurata, Y. Minobe et al.,
1997 Identification of quantitative trait loci controlling head-ing data of rice ushead-ing a high-density linkage map. Theor. Appl. Genet. (in press).
Yamamoto, K., and T. Sasaki, 1997 Large-scale EST sequencing in
rice. Plant Mol. Biol. 35: 135–144.
Yokoo, M., and F. Kikuchi, 1978 Genic analysis for heading time in
rice by the aid of the linkage with blast resistance. Japan. J. Breed. 28: 49–55.