ABSTRACT
SCHILTZ, HOLLY KRISTINE. Promoting Visualization Skills through Deconstruction Using Physical Models and a Visualization Activity Intervention. (Under the direction of Maria T. Oliver-Hoyo.)
Visualization skills are important in learning chemistry, as these skills have been shown to correlate to high ability in problem solving. Students’ understanding of visual information and their problem-solving processes may only ever be accessed indirectly: verbalization, gestures, drawings, etc. In this research, deconstruction of complex visual concepts was aligned with the promotion of students’ verbalization of visualized ideas to teach students to solve complex visual tasks independently. All instructional tools and teaching methods were developed in accordance with the principles of the theoretical framework, the Modeling Theory of Learning: deconstruction of visual representations into model components, comparisons to reality, and recognition of students’ their problem-solving strategies.
Three physical model systems were designed to provide students with visual and tangible representations of chemical concepts. The Permanent Reflection Plane
Focus groups of students taking Inorganic chemistry working with the physical model systems demonstrated difficulty documenting and verbalizing processes and descriptions of visual concepts. Frequently asked student questions were classified, but students also
interacted with visual information through gestures and model manipulations. In an effort to characterize how much students used visualization during lecture or recitation, we developed observation rubrics to gather information about students’ visualization artifacts and examined the effect instructors’ modeled visualization artifacts had on students. No patterns emerged from the passive observation of visualization artifacts in lecture or recitation, but the need to elicit visual information from students was made clear.
Deconstruction proved to be a valuable method for instruction and assessment of visual information. Three strategies for using deconstruction in teaching were distilled from the lessons and observations of the student focus groups: begin with observations of what is given in an image and what it’s composed of, identify the relationships between components to find additional operations in different environments about the molecule, and
deconstructing steps of challenging questions can reveal mistakes.
Promoting Visualization Skills through Deconstruction Using Physical Models and a Visualization Activity Intervention
by
Holly Kristine Schiltz
A dissertation submitted to the Graduate Faculty of North Carolina State University
in partial fulfillment of the requirements for the degree of
Doctor of Philosophy
Chemistry
Raleigh, North Carolina 2013
APPROVED BY:
_______________________________ ______________________________
Dr. Maria T. Oliver-Hoyo Dr. James D. Martin
Committee Chair
________________________________ ________________________________
Dr. Reza A. Ghiladi Dr. Jerry L. Whitten
DEDICATION
To my parents, Rod and Karen, for showing such love and pride for everything I’ve accomplished and to my husband, Vic, for being my home and supporting me in ways I
BIOGRAPHY
Holly Kristine Schiltz was born March 20, 1984 to Rod and Karen and grew up in Elkhorn, NE with her sister, Morgan. The Schiltz family was always in the company of an assortment of pets and Holly got her first job at Petco and shadowed veterinarians for each career activity Elkhorn High School offered. Holly always did well in school, graduating 4th in class. Chemistry, physics, and biology were most exciting because they explained so much about the world and the classes just made sense. When faced with the inevitability of making life and death decisions, she was turned away from veterinary medicine. Her success in chemistry and the availability of scholarships for women in chemistry paved the way for her chosen field.
She accepted admission to Iowa State University majoring in Chemistry and minoring in Philosophy. While at ISU, she got involved with the Society of Chemistry Undergraduate Majors (SCUM) where the group performed chemistry demonstrations for schools, boy scouts, and groups visiting the university. During her time at ISU, Holly met Vic
At UNC-Chapel Hill, Holly joined the research group of Dr. Mike Gagné to work on templating dynamic combinatorial libraries with metal ions under the direction of Dr. Mee-Kyung Chung. Unfortunately, the project was not for Holly and she favored her time tutoring high school and undergraduate students in the evenings to her research. Holly won a
GAANN scholarship for her second year to enrich her time at UNC with teaching
experience, but still sought direction from a former professor at ISU, Dr. Tom Greenbowe. He recommended speaking with Dr. Maria Oliver-Hoyo at North Carolina State University. After speaking with Maria, Holly applied and was accepted to NCSU. She left UNC-Chapel Hill with her Master of Science degree with an emphasis in Inorganic Chemistry in 2008.
ACKNOWLEDGMENTS
First and foremost, I want to thank Dr. Maria Oliver-Hoyo, my advisor, for
everything she has done for me during my time at NC State. She supported my ideas through my own doubt and helped to shape my work into something I am very proud of. I did not know research until watching, listening, and discussing with Maria. I can’t express enough gratitude for advice you’ve offered as a researcher, teacher, and a friend. Maria, you will always be my most valued mentor.
I thank Drs. Bob Beichner, Reza Ghiladi, Jim Martin, and Jerry Whitten for serving on my committee, for their advice during my prelim, and offering advice and guidance when I needed it. My project never would have started if it weren’t for the suggestions of Drs. Ghiladi and Martin. Thank you for giving me access to your students to ask them questions and to teach them about symmetry. I also want to thank Dr. Martin and Dr. Walter Weare for taking me on as a TA. Inorganic has been my favorite class to teach. Jim, I learned so much from discussing the course with you and watching you teach. Discussing the course with you improved my teaching skills and taught me much about inorganic chemistry. Walter, thank you for giving me so much freedom with the intervention.
bolts that went into producing a weekly activity. It’s been a pleasure to have your help and be your mentor.
I thank my parents and sister for always helping me keep things in perspective. I love you all so much! Morgan, thank you for being such a wonderful person and so very different from me. You’ve taught me to always consider how other people see the world. Mom and Dad, thank you for always supporting me and showing me that you can do anything. There is always a way and you’ve modeled that for me my whole life. I will always do what I can to deserve your love and pride.
TABLE OF CONTENTS
LIST OF TABLES ... x
LIST OF FIGURES ... xvi
CHAPTER 1. INTRODUCTION ...1
REFERENCES ...4
CHAPTER 2. LITERATURE REVIEW ...5
2.1 Visualization in Problem Solving ...7
2.2 Physical, Tangible Models ...11
2.3 Visualization Interventions ...13
2.4 Deconstruction ...16
2.5 Scaffolding ...18
2.6 Verbalization with Respect to Visualization...20
2.7 Understanding Visualization through Brain Function ...21
2.8 Conclusion ...26
REFERENCES ...28
CHAPTER 3. THEORETICAL FRAMEWORK ...32
3.1 Framework Translation ...36
3.2 Framework Modification ...36
3.3 Activity Design ...40
3.3.1 Physical Model System Activities ...41
3.3.2 Weekly Complex Visualization Intervention Activities ...43
REFERENCES ...45
CHAPTER 4. METHODOLOGY ...46
4.1 Construction of Physical, 3-D Models ...46
4.1.1 Visual and Tactile Model Design ...46
4.1.2 Permanent Reflection Plane Demonstration ...47
4.1.3 3-D Coordinate Axis System ...50
4.1.4 Proper Rotation Axis System ...52
4.2 Pilot Study with Focus Groups in Inorganic Help Sessions ...54
4.2.1 Interacting with Model Systems ...54
4.2.2 Accompanying Activities ...57
4.3 Structured Observation Rubrics ...58
4.3.2 Lessons Incorporated into Observation Rubrics ...60
4.3.3 Using Observation Rubrics to Gather Data ...61
4.4 Complex Visualization Activity Intervention ...63
4.4.1 Activity Design ...64
4.4.1.1 Format ...65
4.4.1.2 Scaffolding Visual Complexity ...67
4.4.1.3 Task Scaffolding ...73
4.4.1.4 Semantic Analysis of Complex Visualization Activities ...79
4.4.2 Reinforcement of Visualization in Teaching ...82
REFERENCES ...85
CHAPTER 5. DATA COLLECTION AND ANALYSIS ...88
5.1 Focus Group Interactions with Physical Models ...88
5.1.1 Common Problems and Questions ...88
5.1.2 Role of Kinesics ...90
5.1.3 Obstacles in Verbalization ...92
5.1.4 Field-Tests of Visualization Activities ...93
5.1.5 Teaching with Structured Visual Deconstruction ...96
5.2 Observation Rubrics ...100
5.2.1 Collection of Field Observations ...100
5.2.2 Analysis of Observation Rubrics ...105
5.2.3 Limitations of Observation Rubrics ...111
5.2.4 Interpretation of Observation Rubric Findings ...113
5.3 Complex Visualization Activity Intervention ...116
5.3.1 Standardized Visualization Assessments ...116
5.3.1.1 VSCS and MRT Descriptions and Results ...116
5.3.1.2 Statistical Tests ...117
5.3.2 Complex Visualization Activity Data Analysis ...120
5.3.2.1 Analysis of Weekly Activities ...120
5.3.2.2 Detailed Analysis of Summary Question Responses ...121
5.3.3 Evidence of Extended Analytical Parameters ...124
5.3.3.1 Analytical Deconstruction ...125
5.3.3.2 Valid Pattern Identification ...128
5.3.3.3 Description of Personalized Strategies ...131
5.3.3.4 Extension of Symmetry ...134
CHAPTER 6. IMPLICATIONS AND CONCLUSIONS ...145
REFERENCES ...157
APPENDICES ...158
APPENDIX A. Physical Model Construction Information ...159
APPENDIX B. Associated Activities for Physical Model Systems ...168
APPENDIX C. Lecture and Recitation Observation Rubrics ...177
APPENDIX D. Analyzed Observation Rubric Data ...183
APPENDIX E. Grading Rubric for Analytical Parameters within Complex Visualization Activities ...190
LIST OF TABLES
TABLE 1. Chemistry topics that benefit from proficiency in visualization. ...5 TABLE 2. The six original framework principles as outlined by Lesh, et al. ...33 TABLE 3. Questions developed to elicit the goals of the six principles within the
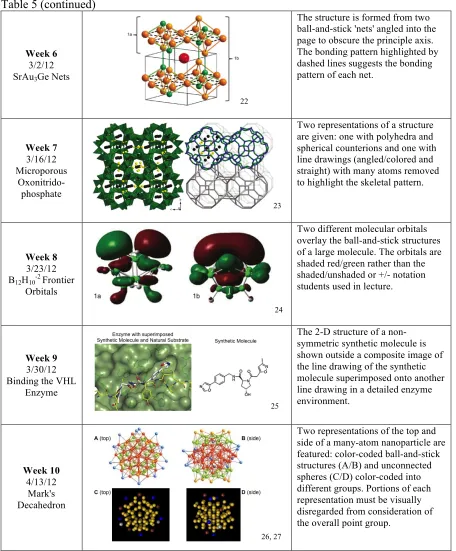
framework. ...37 TABLE 4. Modified framework principles. ...40 TABLE 5. Complex visualization activity images and the visual features that
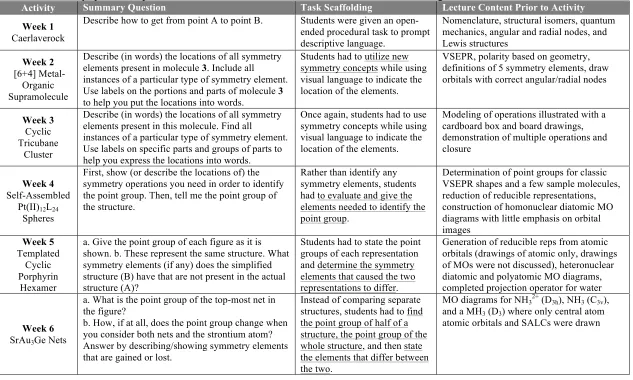
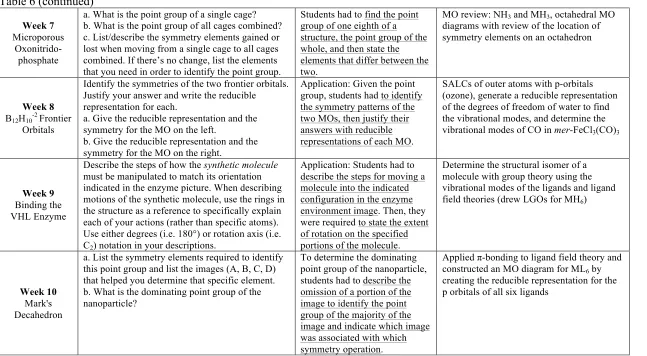
describe the visual scaffolding component. ...69 TABLE 6. Summary questions, lecture content and how tasks were scaffolded
throughout the intervention. ...75 TABLE 7. Semantic analysis of complex visualization activities. ...80 TABLE 8. Examples of recorded student questions per category. ...89 TABLE 9. The percent of lectures that an instance of each observation was
observed during the Fall 2011 and Spring 2012 semesters. ...102 TABLE 10. Frequently demonstrated observation fields within the five categories
of the Lecture Observation Rubric with initial and final groupings. .104 TABLE 11. Descriptions and examples of the analyzed instructor rubric fields. .106 TABLE 12. Summary of pre- and post-intervention visualization assessment
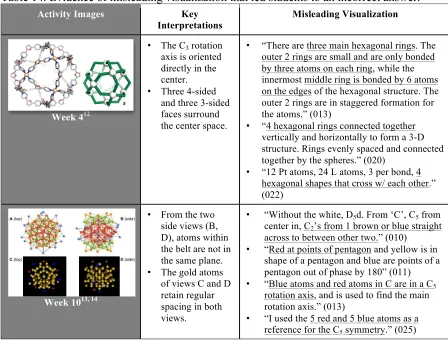
scores. ...117 TABLE 13. Summary of visualization test results. ...119 TABLE 14. Evidence of misleading visualization that led students to an incorrect
answer. ...123 TABLE 15. Examples of student deconstruction as an analytical tool. ...127 TABLE 16. Evidence of successful identification of patterns and rules. ...129 TABLE 17. Evidence of successful communication of strategies to solve the
TABLE 19. Cohen’s kappa values to gauge consensus interrater reliability for the four analytical deconstruction parameters. ...140 TABLE A.1. Outline of Supplies and Costs for the Permanent Reflection Plane
Demo. ...159 TABLE A.2. Outline of Supplies and Costs for the 3-D Coordinate Axis System. 160 TABLE A.3. Outline of Supplies and Costs for the Proper Rotation Axis System.162 TABLE F.1. Number of instances of observed deconstruction parameters
demonstrated by students during the Week 1 complex visualization activity. ...198 TABLE F.2. Week 1 reality comparisons that were unrelated to the activity
content. ...199 TABLE F.3. Week 1 evidence of analytical deconstruction. ...199 TABLE F.4. Week 1 evidence of valid patterns/rules documented in appropriate
language. ...200 TABLE F.5. Week 1 evidence of personalized strategies. ...200 TABLE F.6. Instances of students using non-traditional means of travel. ...200 TABLE F.7. Number of instances of observed deconstruction parameters
demonstrated by students during the Week 2 complex visualization activity. ...203 TABLE F.8. Week 2 reality comparisons that were not symmetry related. ...204 TABLE F.9. Week 2 evidence of analytical deconstruction. ...204 TABLE F.10. Week 2 evidence of valid patterns/rules documented in appropriate
language. ...205 TABLE F.11. Week 2 evidence of personalized strategies. ...205 TABLE F.12. Summary of the number of symmetry elements students identified in
the Week 2 summary question. ...206 TABLE F.13. Specific descriptions of symmetry element locations during
TABLE F.15. Evidence of advanced language and conclusions unsupported by observations during Week 2. ...207 TABLE F.16. Number of instances of observed deconstruction parameters
demonstrated by students during the Week 3 complex visualization activity. ...210 TABLE F.17. Week 3 reality comparisons that were not symmetry related. ...211 TABLE F.18. Week 3 evidence of analytical deconstruction. ...211 TABLE F.19. Week 3 evidence of valid patterns/rules documented in appropriate
language. ...212 TABLE F.20. Week 3 evidence of personalized strategies. ...212 TABLE F.21. Nature of students’ drawings on the Week 3 activity. ...213 TABLE F.22. Summary of symmetry elements and visualization artifacts used in
Week 3. ...213 TABLE F.23. Number of instances of observed deconstruction parameters
demonstrated by students during the Week 4 complex visualization activity. ...217 TABLE F.24. Week 4 reality comparisons that were not symmetry related. ...218 TABLE F.25. Week 4 evidence of analytical deconstruction. ...218 TABLE F.26. Week 4 evidence of valid patterns/rules documented in appropriate
language. ...219 TABLE F.27. Week 4 evidence of personalized strategies. ...220 TABLE F.28. Point group descriptions for the Week 4 activity containing minor
mistakes. ...220 TABLE F.29. Inconsistent or incorrect point group descriptions for the Week 4
activity. ...221 TABLE F.30. Documented evidence of students’ misleading visual interpretation of
TABLE F.31. Number of instances of observed deconstruction parameters
demonstrated by students during the Week 5 complex visualization activity. ...225 TABLE F.32. Week 5 reality comparisons that were not symmetry related. ...226 TABLE F.33. Week 5 evidence of analytical deconstruction. ...226 TABLE F.34. Week 5 evidence of valid patterns/rules documented in appropriate
language. ...228 TABLE F.35. Week 5 evidence of personalized strategies. ...228 TABLE F.36. Number of instances of observed deconstruction parameters
demonstrated by students during the Week 6 complex visualization activity. ...231 TABLE F.37. Week 6 reality comparisons that were not symmetry related. ...232 TABLE F.38. Week 6 evidence of analytical deconstruction. ...232 TABLE F.39. Week 6 evidence of valid patterns/rules documented in appropriate
language. ...233 TABLE F.40. Week 6 evidence of personalized strategies. ...233 TABLE F.41. Number of instances of observed deconstruction parameters
demonstrated by students during the Week 7 complex visualization activity. ...236 TABLE F.42. Week 7 reality comparisons that were not symmetry related. ...237 TABLE F.43. Week 7 evidence of analytical deconstruction. ...237 TABLE F.44. Week 7 evidence of valid patterns/rules documented in appropriate
language. ...238 TABLE F.45. Week 7 evidence of personalized strategies. ...238 TABLE F.46. Number of instances of observed deconstruction parameters
TABLE F.49. Week 8 evidence of valid patterns/rules documented in appropriate
language. ...244
TABLE F.50. Week 8 evidence of personalized strategies. ...244
TABLE F.51. Week 8 evidence of extension of symmetry. ...244
TABLE F.52. Summary of coordinate axis use for Week 8. ...245
TABLE F.53. Summary of students’ answers to the summary question of Week 8. ...245
TABLE F.54. Number of instances of observed deconstruction parameters demonstrated by students during the Week 9 complex visualization activity. ...248
TABLE F.55. Week 9 reality comparisons that were unrelated to the activity content. ...249
TABLE F.56. Week 9 evidence of analytical deconstruction. ...249
TABLE F.57. Week 9 evidence of valid patterns/rules documented in appropriate language. ...250
TABLE F.58. Week 9 evidence of personalized strategies. ...250
TABLE F.59. Week 9 evidence of extension of symmetry. ...250
TABLE F.60. Summary of students’ answers to the summary question of Week 9. ...251
TABLE F.61. Number of instances of observed deconstruction parameters demonstrated by students during the Week 10 complex visualization activity. ...254
TABLE F.62. Week 10 reality comparisons that were not symmetry related. ...255
TABLE F.63. Week 10 evidence of analytical deconstruction. ...255
TABLE F.64. Week 10 evidence of valid patterns/rules documented in appropriate language. ...256
TABLE F.67. Week 10 responses to the modified operation question. ...257 TABLE F.68. Summary of the student responses to the modified pattern question of
Week 10. ...258 TABLE F.69. Documented responses describing image C/D atom groups used to
LIST OF FIGURES
FIGURE 1. Engineering students with high spatial abilities used the three views (left) at a time to solve the “pictorial creation” problem. ...8 FIGURE 2. The three physical model systems developed in this research. ...11 FIGURE 3. Subjects responded to numbers in either a number line (left) or clock
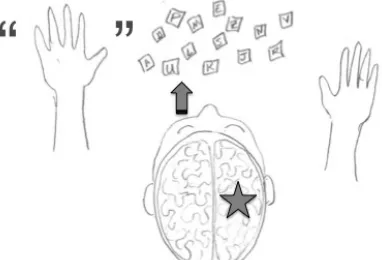
(right) with the hand that was closest to where the number would appear if the line or clock were in front of the subject. ...22 FIGURE 4. When the right eye is covered, the researcher was able to communicate
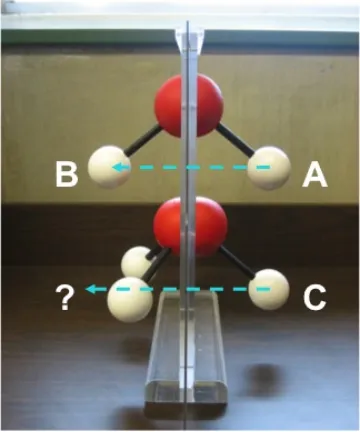
with the “right” brain, which could communicate through left hand gestures. ...23 FIGURE 5. The Permanent Reflection Plane Demo in position 1 (closed) and 2
(open) shows the mirrored images of the front atoms. In position 2, the image of the top molecule half is superimposed onto the back portion. ...48 FIGURE 6. Viewed from the side, the Permanent Reflection Plane demo shows
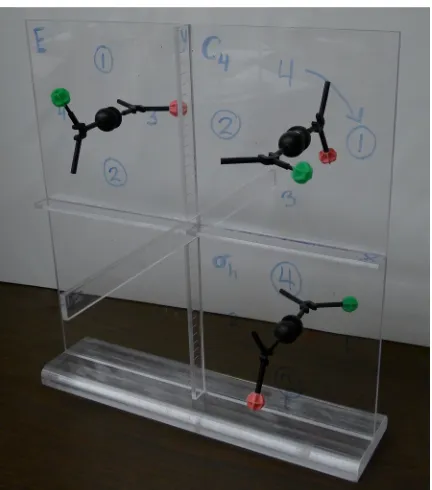
that atom A maps onto atom B through the reflection plane. The plane is not a reflection plane element for the lower molecule because C has no corresponding atom. ...49 FIGURE 7. The 3-D Coordinate Axis system displays the steps of an improper
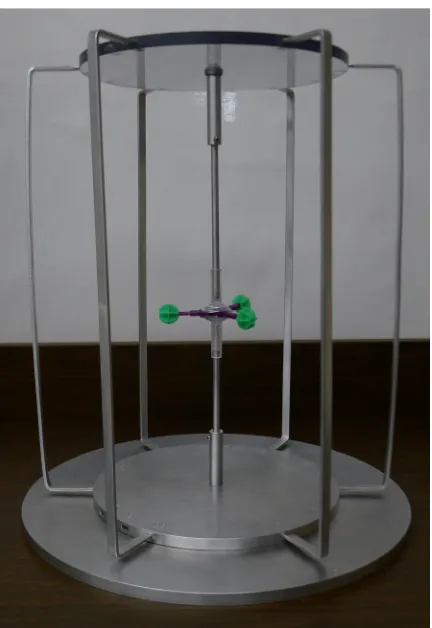
rotation while dry erase markers label atoms and document motion. ..51 FIGURE 8. A molecule with a C3 rotation axis inserted into the system with the
atoms aligned to the frames in the correct degree increments. ...53 FIGURE 9. Six frames around a molecule with a C3 rotation axis outline all the
vertical reflection planes simultaneously. ...53 FIGURE 10. S4 improper rotation demonstrated on the 3-D Coordinate Axis
system. ...91 FIGURE 11. Staggered ethane vertical reflection planes: one containing atoms A
and B, one containing C and D, and containing E and F. ...98 FIGURE 12. Total Student Questions in Fall 2011 compared to Total Instructor
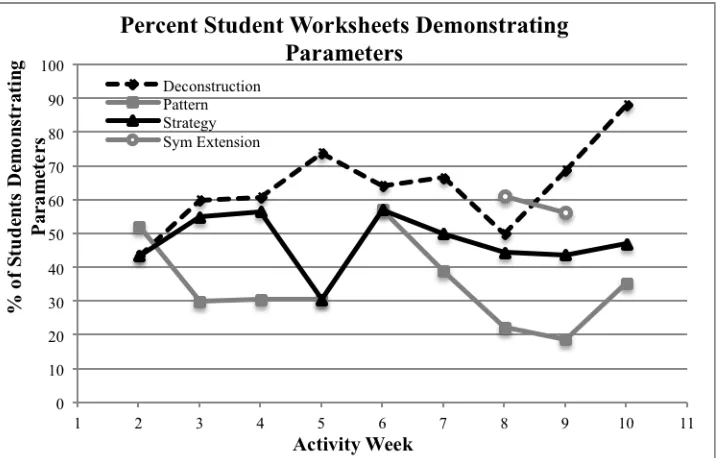
FIGURE 14. The percentage of students’ activity worksheets that demonstrated a presence of each of the extended analytical parameters each week of the intervention. ...125 FIGURE A.1. The Plexiglas field of the system. The marked axis perpendicular to
the plane may be removed for storage. ...160 FIGURE A.2. Different model kits used in the atom connectors show the Tygon
tubing (visible on a linear connector) while the neodymium magnet is revealed on the bottom of a tetrahedral connector. ...161 FIGURE A.3. All pieces of the Proper Rotation Axis System, clockwise from upper
left: base disc with pin, Plexiglas top disc, two security screws, four aluminum dowels (two sizes), PVC tubes, suction cups, six aluminum frames, bottom disc. ...163 FIGURE A.4. Bottom two discs of the Proper Rotation Axis system. Left: the large,
base disc has a pin that lines up with a 0° mark. Right: the underside of the bottom disc shows the indents along the track for the pin of the base disc. ...163 FIGURE A.5. The top Plexiglas and bottom aluminum discs feature matching degree
indents. The aluminum frames hole the Plexiglas disc upright. ...164 FIGURE A.6. The dissembled components of the center axis. ...164 FIGURE A.7. Fitting a molecular model into the Proper Rotation Axis system. ...165 FIGURE D.1. Number of students attending each lecture of Fall 2011 and Spring
2012 excluding exam days. ...183 FIGURE D.2. The total number of student questions separated into basic and
extension questions for Fall 2011 and Spring 2012. ...183 FIGURE D.3. The total number of student questions separated between male and
female students for Fall 2011 and Spring 2012. ...184 FIGURE D.4. Total student questions overlaid onto the instructor’s use of visual
language for fall (left) and spring (right). ...184 FIGURE D.5. Total student questions overlaid onto the instructor’s comparisons to
FIGURE D.7. Total student questions overlaid onto instructor’s use of instructional models for fall (left) and spring (right). ...186 FIGURE D.8. Total student questions overlaid onto instructor’s gestures around 2-D
images (overhead screen, blackboard) for fall (left) and spring
(right). ...186 FIGURE D.9. Total student questions overlaid onto instructor’s blackboard drawings
for fall (left) and spring (right). ...187 FIGURE D.10. Total student questions overlaid onto instructor’s combined drawings
and use of instructional models for fall (left) and spring (right). ...187 FIGURE D.11. The correlation plots resulting from plotting total student questions
against the instructor’s interaction with visual representations
(drawings, model use, and gestures around 2-D images) for fall (left) and spring (right). ...188 FIGURE D.12. Total student questions asked during lecture of Fall 2011 (left) and
lecture of Spring 2012 (right). ...188 FIGURE D.13. Total student questions for each observed semester (right) and total
student questions normalized by final class enrollment (left). Final enrollment was 56 for Fall 2011 and 37 for Spring 2012. ...189 FIGURE D.14. Total student questions arranged by the primary topics discussed in
each lecture for the Fall and Spring semesters. ...189 FIGURE F.1. Number of drawings, coordinate axes, arrows on the image
CHAPTER 1. INTRODUCTION
Visualization is important in chemistry education, as high visual-spatial scores have been found to correlate to better performance on chemistry concepts that require problem solving skills rather than algorithms.1 The many instructional resources used to explain chemical phenomena generate visual representations that depict different information about a concept. Realizing that these different visual representations (such as graphs, animations, and actual substances and solutions) all describe a different view of the same chemical
phenomena and assisting students in becoming well-versed in translating between the different representations used helps to refine students’ understanding of chemistry concepts.2 Even when students have difficulty analyzing visual representations, studies show that visualization skills may be improved. Students with low visual-spatial abilities have gone on to do better in STEM (Science, Technology, Engineering, and Mathematics) courses after spending a semester in a course to improve visualization skills than peers of similar visual-spatial abilities who did not take the course.3 Even a single repetition of a visualization task results in improvement.4 In addition, visual-spatial ability has long-term effects on students’ career choices and interests and students with high visual-spatial ability are likely to enter STEM professions.5
Visualization has been shown to enable flexibility when approaching a complex task.7 In this work, we will discuss a variety of strategies that were used to help students develop their visualization skills and how they were implemented to promote problem-solving skills and to enable students to strategically tackle visually demanding tasks. The goal of this research is to provide a platform for students to accurately communicate their analyses of visual problems. In developing methods to help students recognize their own processes and in analyzing students’ interactions with visual representations, we sought to answer three questions:
1. To what extent do students document their visual comprehension?
2. What measures are required for students to effectively communicate their problem solving processes?
3. What kind of evidence of visualization deconstruction (if any) do students show after a one-semester intervention tailored to address visualization strategies? In an effort to help guide students through difficult visual tasks, such as envisioning symmetry elements in inorganic chemistry, we have developed three physical model systems to provide a context that displays a visual and tangible frame of reference for abstract
symmetry elements in molecular models.8 An activity was designed to accompany each model system to guide students to deconstruct what they observed and to display common problems experienced by students. To understand the model systems’ effects on how students learn symmetry and handle conceptual obstacles, we observed and recorded students’
Symmetry-based visualization is emphasized in only a portion of Inorganic chemistry courses, but this branch of chemistry incorporates many visually complex topics. In an effort to characterize how much students used visualization during lecture or recitation, we
developed observation rubrics to gather information about visualization artifacts students would demonstrate and examined the effect instructors’ modeled visualization artifacts had on students.
From what was learned while producing the model systems, outlining their effects on student difficulties in visualizing symmetry elements and operations, and gathering
visualization evidence, we developed an intervention to pose difficult visual tasks for students while teaching them to deconstruct the information they were given and
communicate their thoughts. The intervention consisted of ten weeks of activities based on complex 2-D images. On the activity worksheets, students were given increasingly difficult tasks and deconstruction questions based on a theoretical framework, the Modeling Theory of Learning.9 In parallel to teaching students to communicate their visual knowledge and problem-solving processes, evidence of visualization was gathered through students’ own documentation. Through exploration of students’ documentation, evidence of deconstruction of visualization strategies manifested in four areas: use of deconstruction in direct analysis, pattern determination within the image, communication of a problem-solving strategy, and the extension of symmetry concepts to a new problem. The methods to achieve this evidence provide insight to potentially target students’ mental imagery that could lead to
REFERENCES
1. Carter, C. S.; Larussa, M. A.; Bodner, G. M. A study of two measures of spatial ability as predictors of success in different levels of general chemistry. J. Res. Sci. Teach., 1987,
24, 7, 645-657.
2. Kozma, R. B.; Russell, J. Multimedia and Understanding: Expert and Novice Responses to Different Representations Chemical Phenomena. J. Res. Sci. Teach., 1997, 34, 9, 949-968.
3. Sorby, S. A. Educational Research in Developing 3-D Spatial Skills for Engineering Students. Int. J. Sci. Educ., 2009, 31, 3, 459-480.
4. Casey, M. B.; Brabeck, M. M. Exceptions to the male advantage on a spatial task: Family handedness and college major as factors identifying women who excel.
Neuropsychologia, 1989, 27, 689-696.
5. Wai, J.; Lubinski, D.; Benbow, C. Spatial Ability for STEM Domains: Aligning Over 50 Years of Cumulative Psychological Knowledge Solidifies Its Importance. J. Educ. Psych., 2009, 101, 4, 817-835.
6. Lohman, D. F. Spatial Ability: A Review and Reanalysis of the Correlational Literature, in Aptitude Research Project; Technical Report No. 8 for the Aptitude Research Project; School of Education, Stanford University: Palo Alto, CA, 1979.
7. Presmeg, N. C.; Balderas-Cañas, P. E. Visualization and Affect in Nonroutine Problem Solving. Math. Think. Learn., 2001, 3, 4, 289-313.
8. Schiltz, H. K.; Oliver-Hoyo, M. T. Physical Models That Provide Guidance in Visualization Deconstruction in an Inorganic Context. J. Chem. Educ., 2012, 89, 7, 873-877.
CHAPTER 2. LITERATURE REVIEW
Visualization is an important component in learning chemistry, as chemistry consists of many visually rich topics. Some examples of these topics outlined in a recent review of visualization in chemistry are presented in Table 1.1 Representations of molecules, reactions, and theories of these topics attempt to bridge how chemistry is taught by instructors and learned by students. Many topics commonly covered in inorganic chemistry courses and the respective textbooks require a level of abstraction that is challenging to demonstrate in an observable, tangible experience. In this work, abstract thought is a general, decontextualized consideration of theoretical concepts derived from observations.2 Any mental imagery of these abstract concepts is considered a result of visualization: forming mental imagery and actions to think about concepts. Visualization may be characterized or commonly referred to by a number of visualization skills, such as mentally rotating and manipulating figures, recognizing common characteristics between different representations of a figure, and discerning between a figure and its background to name a few examples.3 In this research, students were encouraged to work with visualization and visual topics. To communicate and
Table 1. Some chemistry topics that benefit from proficiency in visualization.
General VSEPR and molecular geometry, kinetic molecular theory, stoichiometry represented at the particulate level, crystal structure
Organic
SN2 reactions, chirality, stereochemistry, molecular representations
(such as Newman, Fisher, and Haworth projections, boat and chair conformers, and skeletal formulas)
model interaction with visual topics to students, it is important to define the intended skills and abstract applications.
The visual topics and representations explored in this research were based in inorganic chemistry due to the level of abstraction and potential benefits of visualization. Symmetry is presented to introduce group theory towards the beginning of numerous inorganic chemistry texts4, 5, 6 and students’ comprehension of the subject as it builds upon symmetry is strongly influenced by their visualization skills. Visual representations are crucial in teaching unobservable abstract concepts such as symmetry and students may use visualization in varying degrees to comprehend what they see. Visual representations appear in many forms, such as textbook images, animation or movies, diagrams, charts, physical objects, and/or vivid descriptions (language that appeals to the senses to elaborate on base definitions) of chemical phenomena. In a review of visual-spatial skills, the authors
concluded that advanced visualization skills might be indicative of higher levels of thinking.7 Students with lower levels of visualization skills may take a model at face value, but
help them communicate their understanding and analysis and enhance their comprehension of the subject matter.
2.1 Visualization in Problem Solving
Figure 1).10 Participants with high spatial ability were observed to solve the problems by utilizing multiple views (looking across views). Participants with low spatial ability examined one view at a time. Students with low spatial ability were advised to deconstruct visual steps as a problem-solving strategy and as a method to utilize more visual information. This research promoted the use of visual problem-solving processes through documentation of visual analyses. The studies discussed here spoke to the beneficial foundation visualization may have for chemistry. Multiple visual sources and the goal of flexibility in analysis helped to design the visual information students were given in instructional resources throughout this work.
Figure 1. Engineering students with high spatial abilities used the three views (left) at a time to solve the “pictorial creation” problem.10
influenced by a student’s representational competence, the ability to see the consistencies of chemical concepts between different representations of the phenomena.11 They asked
students and experts to make connections between videos, graphs, animations, and equations of chemical concepts and found that the experts were more flexible and competent in
analyzing, synthesizing, and evaluating the data from the representations they were shown. The different representations each gave information about a specific aspect of the phenomena and experts’ ability to incorporate multiple representations into one concept demonstrated a more sophisticated understanding of the chemical concept. In teaching and learning
chemistry, communication about attaining representational competence models how to solve problems in chemistry.11 Modeling interaction with visual representations also sets an
example for how to build representational competence. In this research, the cultivation of students’ representational competence between verbal and visual representations was crucial in order to gauge the degree of students’ conceptual understanding. Based on the connections experts made between representations, Kozma et al. outlined the skills that appear to be the result of representational competence. These skills guided how representational competence was modeled for students in this work.
1. “The ability to identify and analyze features of a particular representation (such as a peak on a coordinate graph) and patterns of features (such as the shape of a line in a graph) and use them as evidence to support claims or to explain, draw inferences, and make predictions about relationships among chemical phenomena or concepts. 2. The ability to transform one representation into another, to map features of one onto
with the end point of a reaction in a video and a maximum concentration in a molecular-level animation).
3. The ability to generate or select an appropriate representation or set of representations to explain or warrant claims about relationships among chemical phenomena or concepts.
4. The ability to explain why a particular representation or set of representations is more appropriate for a particular purpose than alternative representations.
5. The ability to describe how different representations might say the same thing in different ways and how one representation might say something that cannot be said with another.”11
The research described in this work explored students’ analysis of visual
representations and worked to help students communicate the conceptually significant facets of those representations. Stieff has conducted research to study the use of visual
states of matter than students in a traditional, lecture-based classroom.13 These studies demonstrated that representational competence constitutes incorporating facets of the phenomena into the complete conception of that phenomena and supports the value of focusing attention on the analysis of visual representations.
2.2 Physical, Tangible Models
In the first phase of this research, physical model systems (shown in Figure 2) were developed to allow students to enact symmetry operations and investigate the most
with greater accuracy.14 Though physical models provide another representation of the concepts or procedures they symbolize, perhaps different from students’ mental imagery, the models are most beneficial when they make the connection to the concept transparent while additional features remain simple.15 These points guided the physical model systems
developed in this research to provide a clear platform for students to enact symmetry operations and pinpoint what they could not visualize or understand.
Works detailing physical model resources for topics related to symmetry and group theory have previously been published.16-21 Some activities use tangible examples in which students may explore occurrences of symmetry.16-18 One comprehensive activity required students to determine all the rotation axes and reflection planes of a tennis ball.16 Another activity demonstrated how symmetry was removed by adding more treads to tires.17 The symmetry of role-playing dice gave students practice with high symmetry point groups and differentiated between elements and operations.18 These activities provide students with specific tactile examples to practice symmetry, but do not allow student to address their own specific obstacles. The physical models developed in this research guide students with specific examples, but are designed to allow students to incorporate their own molecular models and address examples from their own coursework.
axes perpendicular to the principle rotation axis with a modified modeling kit to also demonstrate and reaffirm locations of reflection planes.21 The variety of tangible resources developed to assist students in visualizing symmetry concepts encountered in chemistry attests to the range of difficulties students have in the subject. Physical models are a valuable visual resource because they allow students to actively interact with the material and provide students with representations external to their working memory and concrete experiences to support their understanding of symmetry. The models developed in this research address symmetry visually and physically as the aforementioned resources do, but they also focus on students’ communication of their analyses of symmetry within these examples. The model systems promote translation between verbal and visual representations through students’ documented problem-solving processes.
2.3 Visualization Interventions
elements and keep a journal of their observations in order to give them insight to these visualization skills for use in future organic and inorganic chemistry courses, where symmetry would be revisited.23 Though students’ verbalization skills may be targeted through these journals, this research structured students’ documented visual observations with procedural deconstruction to frame their visualization as a problem-solving strategy. Another project that provided on-going symmetry exposure targeted high school students and related symmetry to everyday objects, models, animations, crystals, and x-ray
crystallography.24 The students retained knowledge three weeks after the unit conclusion, but students reported that they found symmetry confusing and difficult to understand.24 In the research presented in this dissertation, students were similarly encouraged to make
connections to real world examples, but were also required to acknowledge and communicate deconstructed aspects of the connections to support understanding. In another study,
directly, we promoted the analysis of visual problems as a strategy where students would employ visual and verbal knowledge.
Website and computer simulation resources can produce very detailed examples of symmetry operations and interactions with specific molecules. For these to be effective conceptual representations, students must understand the spatial implications of the computer representations, such as interpreting shading and depth cues. Though 3-D computer
simulations are powerful instruments to give students practice in visualization, computer monitors are still 2-D and the skill of transforming 2-D to 3-D remains untapped if the
simulation is the sole resource. To address this problem, an exercise in producing 2-D images from a collection of wooden cubes allowed students to methodically practice 2-D to 3-D transformations.27 This exercise supplemented an assignment in exploring molecular structure of literature molecules and substances to teach students the translation of 2-D images to a 3-D knowledge of the structures.27 The physical model systems also address 2-D to 3-D translation, but the whole of this research promotes translation between verbal and visual (2-D and 3-D) understanding to ensure that students comprehend what they translated. The studies discussed here showed that building visualization skills requires time and
practice and may not necessarily result in improved chemistry knowledge. With the
2.4 Deconstruction
In this research, deconstruction refers to a procedural breakdown and examination of the components of a concept or representation involved in the formation of mental constructs. The Modeling Theory of Learning, the theoretical framework used in this research, outlines several principles to create successful thought-revealing activities for students.28 The first principle declares the need to construct a model of the problem that must be solved, but in order to construct this model, the problem must be deconstructed into its simplest parts and the relationships, operations, and patterns inherent in the problem must be examined and understood.28 The procedural deconstruction of the tasks and students’ analyses was emulated in this work to effectively elicit students’ problem-solving processes.
The concept of deconstruction has been documented to have many advantages in learning and instruction. Deconstruction has been used to help students build a more practical sense of reality by breaking down the meanings of classroom instructional models and asking students to discuss the similarities and differences between the models and what they
questions and deeper cognitive questions. Deconstruction was described as a safety net for students because they were able to provide more responses to deconstructed scenarios of a topic than with a direct, singular presentation of a topic.30 In this research, analysis of visual representations was encouraged through deconstruction to make the visual problems
approachable.
Deconstruction also supports critical problem solving. The thought process (“nature of thought”) necessary to progress in science may be interpreted as deconstruction. Humans understand science from many partial points of view and analyze knowledge through “a process of redefinition of the meanings and reorganization of conceptual structures”.31 The ability to deconstruct and understand that only specific aspects of a concept are represented in scientific models is indicative of higher levels of thought.32 As students progress toward an expert level of thought, they understand that a model adds a particular facet of a concept and that this concept is more comprehensive than any single model can display. Connecting multiple representations of chemical concepts (videos, graphs, animations, and equations) helps students build an inclusive and accurate understanding of the concept from the partial representations.11, 33 Promoting familiarity with multiple representations of a concept fosters a refined understanding of the interrelations of the deconstructed parts of the concept. Rather than a specific problem-solving method, these points emphasize the strengths of
deconstruction as a thought process regarding scientific concepts. Previous to this work, structured deconstruction had not been applied to help students analyze visual
General deconstruction is prevalent in many symmetry-related instructional tools to date. In an activity exploring the symmetry elements and operations of the D4h point group,
students use a grid of the sixteen possible orientations of a labeled square to break down the possibilities of different operations on the square.34 Tuvi-Arad and Bonder used online visualization tools to teach high school teachers about symmetry elements and continuous symmetry, which involves investigating how far a structure is from being perfectly
symmetrical by deconstruction of the parts of the structure that make it different.35 These activities show how students may successfully approach complex visual topics by first examining deconstructed portions of a task. In this work, deconstruction was addressed through a structural framework and elevated beyond a breakdown of parts to an introspective examination of the relationships and patterns inherent in the tasks.
2.5 Scaffolding
Late in this research, scaffolding was employed to promote student interaction with advanced visual content. Scaffolding has been used with students of a variety of levels. It refers to the process in which instructors provide decreasing amounts of guidance to help students accomplish higher cognitive goals that would be difficult to attain alone.36 An article outlining scaffolding methods to assist young children with problem solving suggests the following advantages of using scaffolding: maintaining the subject’s interest, simplifying the task to ensure manageability, keeping the subject on track, calling attention to discrepancies between the subject’s work and correct work/assumptions, controlling and managing
supports, articulation, focusing, modeling, problematizing, and promoting shared
understandings.38 Articulation allows instructors insight to students’ thoughts to see if they’re on track to understanding or solving the task. Focusing steers students’ attention to the
relevant aspects of the problem, while modeling allows the instructor to raise students’ attention to a more difficult task or portion of the task and demonstrate how students solve similar tasks. Problematizing calls attention to discrepancies and conflicts that students must overcome and encourages students to challenge themselves and reflect further. Articulation, focus, and problematization echo the principles outlined by the Modeling Theory of Learning within documentation, model construction, and self-assessment. The similarities suggest that scaffolding would favorably introduce thought-eliciting tasks that would help students complete higher-level problems.
Another interpretation of scaffolding is to give students supports that enable them to deal with more complex content and advanced abilities than they would otherwise be able to handle (rather than a scheduled decrease of guidance).39 This view of scaffolding was taken into consideration while scaffolding the visual components of the intervention. In an in-depth analysis of scaffolding, Reiser determined two mechanisms of scaffolding from previously discussed guidelines: structuring and problematizing. Structuring consists of the
to immerse students in NMR and IR spectroscopy activities that are initially beyond their skill and knowledge capabilities.40 Here, Livengood introduced material that was too complex for students to handle on their own and made it approachable by breaking the concepts up and offering supports of organic chemistry relationships that students had already covered. This example demonstrates how scaffolding may be utilized through the planned dispersal of supports rather than gradual removal. Livengood’s work interpreted scaffolding as a dispersal of supports from organic chemistry to help students Scaffolding offers an effective way to challenge students while not alienating them from tasks that seem above their ability. In solving visual tasks within the intervention presented in this work, scaffolding made the images of advanced content approachable and allowed students to work through their mental images independently.
2.6 Verbalization with Respect to Visualization
The motivation of the research presented here was to understand students’
visualization processes and challenges. Verbalization is a crucial bridge to communicating visualization. Even though mental imagery may be evidenced through secondary means like drawings, gestures, or instruments designed to measure visualization skills, verbalizing one’s intentions, thoughts, and interpretations of concepts is most common for both instructors and students. Using verbalization to express mental imagery may not adequately relay the extent of students’ visual understanding if they are unaccustomed to describing visual ideas and representations. Habraken recommends teaching to the pictorial language of chemistry
has a place in translating visual thinking into speech and writing to build upon students’ representational competence. In a study exploring the role of visualization in solving math problems, evidence of graduate students’ visualization, such as drawing, verbal reports, and gestures indicated the type of thinking that was taking place.8 Visual imagery was used to either make sense of a problem, solve it, or both and though it required more time than using a formula, it let the graduate students be more flexible with their problem-solving methods.8 These conclusions were based on a verbal discussion of the students’ problem-solving processes. Any mental imagery and reasons for such images were relayed through
verbalization. When working with complex tasks, encouraging students to articulate their thoughts helps them make sense of the problems and manage their progress on completing the task.42 This ties verbalization in as a major element of scaffolding and relates to the Modeling Theory of Learning through documentation. Through verbalization, students may clarify visual information through, communicate their progress, consider verbal guidance from the instructor, and finally relay their visual understanding of visualization tasks. 2.7 Understanding Visualization through Brain Function
visual perception was so powerful that they favored sight and altered the memory of what they touched to match what they saw. The researchers concluded that vision dominates when a subject’s vision is manipulated to conflict with what a subject sense through touch.43 Later work replicating the same intersensory conflicts discounted that vision always dominated, but concluded that both vision and touch have roles in affect, spatial cognition, and guidance.44 Despite which sensory input dominates, the results of these studies indicate that clear physical information is important for students to understand the spatial representation of objects with the best accuracy.
Figure 3. Subjects responded to numbers in either a number line (left) or clock (right) with the hand that was closest to where the number would appear if the line or clock were in front of the subject.46
line) or on a clock. Visual-spatial thinking manifested in which hand a subject used to respond to a number based on its location in the image in their minds. Based on the
visualized number line or clock, subjects chose a number with the hand that would be closest to the side of an actual number line or clock that contained that number (see Figure 3).46 Based on the evidence that touch and sight are so influential on each other, providing physical resources to visual topics will only add to students’ mental imagery and enhance their understanding. The physical model systems developed in this research provided a physical platform for students to explore and determine visualization problems in their analysis of symmetry problems.
Figure 4. When the right eye is covered, the researcher was able to communicate with the “right” brain, which could communicate through left hand gestures.47
Evidence of students’ visualization may be accessed through verbalization, but the two require separate brain processes. Split-brain studies, a now defunct treatment for
him. When the same patient’s right eye was covered, only his left hand could point to visual cues. When the researcher verbally questioned the patient about his choice, the patient would verbally deny any knowledge of his left hand’s motion.47 Figure 4 illustrates the brain
hemisphere responsible for left eye and hand activity. The portion of the brain responsible for verbal communication was cut off from what the patient’s right hemisphere experienced. This demonstrates that verbalization is not coincident with visualization and some transfer must occur in the brain to understand visual information received verbally or to communicate mental imagery. The translation between visual and verbal understanding was a key point in this research when students found documentation to be so challenging.
separation of visualization skills is supported by research of a brain-damaged patient’s visualization skills.50 Damage to the parietal cortex results in impairment of spatial skills such as mental rotation and maze learning, while damage to the temporal cortex results in impairment of tasks that require visual discrimination between objects. These visual skills were shown to be distinct from one another because damage to one lobe did not affect the visual skills associated with the undamaged lobe.50 By separating thinking abilities through targeted tasks (or damage to specific brain areas), different visualization skills and
verbalization are shown to be distinct and to operate independently. Visual tasks in everyday life and in chemistry courses require the combination of skills that are physically based in multiple locations in the brain. This research utilized deconstruction to teach students to pool their thinking skills and senses in order to ease the translation of representations that speak to a particular skill.
In this work, student improvement in visualization skills was targeted through multiple, varying representations of chemical concepts to provide students space to work on communicating the translation of these representations: physical representations, visual examples with additional visual frames of reference, and meaningful descriptions of the parts, relations, and patterns within complex images. To help students analyze and
2.8 Conclusion
The work discussed in this dissertation provided a platform of deconstruction for students to accurately communicate their analyses of visual problems. The literature
presented here documents some existing methods devised to help students relate to abstract topics, specifically symmetry within inorganic chemistry. Visualization skills are important to promote in chemistry, as they are indicative of higher levels of conceptual understanding and contribute to problem solving abilities.9, 11 Advanced visualization skills correlate to resourceful, flexible problem solving while lower-level visualization may hinder students from understanding and completing tasks that require problem-solving skills.8, 10 Instead of aiming to improve visualization skills, this research sought methods to help students work with visual problems using whatever skills (visual and logical) were available to them and to help students communicate how they interacted with these problems. This research differs from other visualization interventions by placing emphasis on the analysis of visual
representations rather than visual methods used in analysis. Deconstruction and scaffolding offer plausible strategies to make visualization more approachable for students that have difficulty with visual tasks or understanding the visual information associated with chemistry concepts. A specific, procedural form of deconstruction was used throughout this work as a method that could be applied to any problem, but that has not been explicitly used within visualization. Scaffolding enabled students to handle advanced chemistry content.
review has included documented efforts to understand and enhance visualization skills. This dissertation used effective methods reported in the literature (such as scaffolding) in aims to improve students’ visualization skills. New resources were developed to enhance
REFERENCES
1. Harle, M.; Towns, M. A Review of Spatial Ability Literature, Its Connection to Chemistry, and Implications for Instruction. J. Chem. Educ., 2011, 88, 3, 351-360. 2. Wakeham, G. From concrete to abstract in elementary chemistry. J. Chem. Educ., 1934,
11, 3, 168-169.
3. Rochford, K., Archer, M. A. Academic underachievement and cognitive learning disabilities: 10 case studies. SAJHE/SATHO, 1991, 5, 2, 52-73.
4. Shriver, D. F.; Atkins, P. W. Inorganic Chemistry,3rd ed.; W. H. Freeman and Company: New York, NY, 1999.
5. Harris, D. C.; Bertolucci, M. D. Symmetry and Spectroscopy: An Introduction to
Vibrational and Electronic Spectroscopy; Dover Publications, Inc.: Mineola, NY, 1989. 6. Wulfsberg, G. Inorganic Chemistry; University Science Books: Sausalito, CA, 2000. 7. Wu, H.-K.; Shah, P. Exploring Visuospatial Thinking in Chemistry Learning. Sci. Educ.,
2004, 88, 3, 465-492.
8. Presmeg, N. C.; Balderas-Cañas, P. E. Visualization and Affect in Nonroutine Problem Solving. Math. Think. Learn., 2001, 3, 4, 289-313.
9. Carter, C. S.; Larussa, M. A.; Bodner, G. M. A study of two measures of spatial ability as predictors of success in different levels of general chemistry. J. Res. Sci. Teach., 1987,
24, 7, 645-657.
10.Mohler, J. L. The Impact of Visualization Methodology on Spatial Problem Solutions Among High and Low Visual Achievers. J. Ind. Tech., 2008, 24, 1, 1-9.
11.Kozma, R. B.; Russell, J. Multimedia and Understanding: Expert and Novice Responses to Different Representations Chemical Phenomena. J. Res. Sci. Teach., 1997, 34, 9, 949-968.
12.Stieff, M.; Hegarty, M.; Deslongchamps, G. Identifying Representational Competence With Multi-Representational Displays. Cognit. Instruct., 2011, 29, 1, 123-145.
13.Stieff, M. Improving Representational Competence using Molecular Simulations Embedded in Inquiry Activities. J. Res. Sci. Teach., 2011, 48, 10, 1137-1158. 14.Stull, A. T.; Hegarty, M.; Dixon, B.; Stieff, M. Representational Translation With
15.McNeil, N. M.; Jarvin, L. When Theories Don’t Add Up: Disentangling the Manipulatives Debate. Theor. Pract., 2007, 46, 4, 309-316.
16.Herman, M.; Lievin, J. Group Theory. From common objects to molecules. J. Chem. Educ., 1977, 54, 10, 596-598.
17.Jackson, W. G. Symmetry in Automobile Tires and the Left-Right Problem. J. Chem. Educ., 1992, 69, 8, 624-626.
18.Grafton, A. K. Using Role-Playing Game Dice To Teach the Concepts of Symmetry. J. Chem. Educ., 2011, 88, 9, 1281-1282.
19.Moore, D. A.; Cortes-Figueroa, J. E. Hands-On Discovery of Mirror Planes. J. Chem. Educ., 2001, 78, 1, 49.
20.Sein, L. T., Jr. Dynamic Paper Constructions for Easier Visualization of Molecular Symmetry. J. Chem. Educ., 2010, 87, 8, 827-828.
21.Flint, E. B. Teaching Point-Group Symmetry with Three-Dimensional Models. J. Chem. Educ., 2011, 88, 7, 907-909.
22.Ealy, J. B. Students' Understanding Is Enhanced Through Molecular Modeling. J. Sci. Educ. Tech., 2004, 13, 4, 461-471.
23.McKay, S. E.; Boone, S. R. An Early Emphasis on Symmetry and a Three-Dimensional Perspective in the Chemistry Curriculum. J. Chem. Educ., 2001, 78, 11, 1487-1490. 24.Grove, N. P.; Collins, D. J.; Guerin, N. P.; López, J. J.; Lowery Bretz, S.; Zhou, H.-C.
Designing, Teaching, and Evaluating a Unit on Symmetry and Crystallography in the High School Classroom. J. Chem. Educ., 2009, 86, 8, 946-949.
25.Abraham, M.; Varghese, V.; Tang, H. Using Molecular Representations To Aid Student Understanding of Stereochemical Concepts. J. Chem. Educ., 2010, 87, 12, 1425-1429. 26.Shepard, R. N.; Metzler, J. Mental Rotation of Three-Dimensional Objects. Science,
1971, 171, 3972, 701-703.
27.Martin, J. D. From the Wood-Shop to Crystal Engineering: Teaching Three-Dimensional Chemistry. J. Chem. Educ., 2001, 78, 9, 1195-1197.
29.Eichinger, J. Using Models Effectively. Sci. Child., 2005, 42, 7, 43-45.
30.Katsh-Singer, R. Deconstructing to Instruct: The Role of Deconstruction in Instruction and Assessment in Middle School Science Classrooms. Sci. Scope, 2011, 34, 5, 12-15. 31.Manzelli, P.; Eaton, J. The conceptual bases of chemistry and the development of
integrated science. The Environmentalist, 1985, 5, 4, 289-292.
32.Grosslight, L.; Unger, C.; Jay, E. Understanding Models and their Use in Science:
Conceptions of Middle School and High School Students and Experts. J. Res. Sci. Teach., 1991, 28, 9, 799-822.
33.Russell, J. W.; Kozma, R. B.; Jones, T.; Wykoff, J.; Marx, N.; Davis, J. Use of
Simultaneous-Synchronized Macroscopic, Microscopic, and Symbolic Representations To Enhance the Teaching and Learning of Chemical Concepts. J. Chem. Educ., 1997, 74, 3, 330-334.
34.Faltynek, R. A. Group Theory in Advanced Inorgic Chemistry: An Introductory Exercise.
J. Chem. Educ., 1995, 72, 1, 20-24.
35.Tuvi-Arad, I.; Bonder, R. Continuous symmetry and chemistry teachers: learning advanced chemistry content through novel visualization tools. Chem. Educ. Res. Pract., 2010, 11, 1, 48-58.
36.Fretz, E. B.; Wu, H.-K.; Zhang, B.; Krajcik, J. S.; Davis, E. A.; Soloway, E. An Investigation of Software Scaffolds Supporting Modeling Practices. Res. Sci. Educ., 2002, 32, 4, 567–589.
37.Wood, D.; Bruner, J. S.; Ross, G. The Role of Tutoring in Problem Solving. J. Child Psychol. Psych., 1976, 17, 89–100.
38.Hsin, C.-T.; Wu, H.-K. Using Scaffolding Strategies to Promote Young Children’s Scientific Understandings of Floating and Sinking. J. Sci. Educ. Technol., 2011, 20, 656-666.
39.Reiser, B. J. Scaffolding Complex Learning: The Mechanisms of Structuring and Problematizing Student Work. J. Learn. Sci., 2004, 13, 3, 273–304.
40.Livengood, K.; Lewallen, D. W.; Leatherman, J.; Maxwell, J. L. The Use and Evaluation of Scaffolding, Student Centered-Learning, Behaviorism, and Constructivism To Teach Nuclear Magnetic Resonance and IR Spectroscopy in a Two-Semester Organic
41.Habraken, C. L. Integrating into Chemistry Teaching Today’s Student’s Visuospatial Talents and Skills, and the Teaching of Today’s Chemistry’s Graphical Language. J. Sci. Educ. Technol., 2004, 13, 1, 89-94.
42.Quintana, C.; Reiser, B. J.; Davis, E. A.; Krajcik, J.; Fretz, E.; Duncan, R. G. A
Scaffolding Design Framework for Software to Support Science Inquiry. J. Learn. Sci., 2004, 13, 3, 337–386.
43.Rock, I.; Victor, J. Vision and Touch: An Experimentally Created Conflict between the Two Senses. Science, 1964, 143, 3606, 594-596.
44.Heller, M. A.; Calcaterra, J. A.; Green, S. L.; Brown, L. Intersensory conflict between vision and touch: The response modality dominates when precise, attention-riveting judgments are required. Percept. Psychophys., 1999, 61, 7, 1384.
45.Jones, M. G.; Minogue, J.; Tretter, T. R.; Negishi, A.; Taylor, R. Haptic Augmentation of Science Instruction: Does Touch Matter? Sci. Educ., 2006, 90, 1, 111-123.
46.de Hevia, M. D.; Vallar, G.; Girelli, L. Visualizing numbers in the mind's eye: The role of visuo-spatial processes in numerical abilities. Neurosci. Biobehav. R., 2008, 32, 1361-1372.
47.Gazzaniga, M. S.; Bogen, J. E.; Sperry, R. W.Observations on Visual Perception After Disconnexion of the Cerebral Hemispheres in Man. Brain, 1965, 88, 2, 221-236.
48.Gyselinck, V.; Meneghetti, C.; De Beni, R.; Pazzaglia, F. The role of working memory in spatial text processing: What benefit of imagery strategy and visuospatial abilities?
Learn. Individ. Differ., 2009, 19, 12-20.
49.Blajenkova, O.; Kozhevnikov, M.; Motes, M. A. Object-Spatial Imagery: A New Self-Report Imagery Questionnaire. Appl. Cognit. Psych., 2006, 20, 2, 239-263.
CHAPTER 3.
THEORETICAL FRAMEWORK
Lesh et al. developed a framework for creating thought-revealing activities to promote and document how students develop a method to solve problems in a way that allows students to recognize their own problem solving processes.1 The foundation of the thought-revealing activities came from the need to keep students thinking productively during interviews. In a preliminary study, Lesh et al. determined the most effective interviewers were those that interfered the least with students as they verbalized their problem solving.1 However, even if the interviewer asked the right questions and pulled out procedural information from the students as they worked, examining hours of video and audiotape offered external observations about descriptions and replies rather than deliberate explanations from the students. Their activities evolved into decision-making tools with steps for the students to complete along the way. This involved students being required to
document their answers and reasons for each step. The outcome of this deliberate
documentation was an abundance of students’ thoughts about solving the steps instead of only the outcome decision for the problem. Without documented progress, the process may be lost since students value and remember the outcome above all else. As the students in the study worked through the activities, the authors shifted their focus to the developing
Construct Documentation, Construct Shareability and Reusability, and Effective Prototype principles.1 The first three principles specify how the activities should guide students to think about the problem they’ll need to solve. The last three principles provide guidelines for how the thought processes are consciously documented. These guidelines directed the physical model instructional materials and intervention activities developed in this project in order to
Table 2. The six original framework principles as outlined by Lesh, et al. Principle Task Characteristics Pertaining to the Principle
Model Construction The task puts students in a situation where they recognize the need to generate a model for interpreting the given information, possible processes, and goals in a complex, problem-solving situation. A model is a system with the following components:
• Elements
• Relationships (among elements)
• Operations (describing how elements interact)
• Patterns or Rules (apply to relationships and operations)
Reality Some aspect(s) of the task will be meaningful to students in order to encourage them to “make sense of the situation based on extensions of their own personal knowledge and
experiences.”
Self-Assessment The task implies appropriate criteria for assessing the validity of creative solutions. Students are able to judge whether they’ve solved the task and when they need to improve or refine their responses for a given purpose.
Construct Documentation
Questions are posed in a way that students will clearly reveal how they are thinking about the situation by leaving an “audit trail” of responses outlining the given information, possible processes, and goals that they took into account.
Construct Shareability
and Reusability Tasks challenge students to go beyond personally solving a singular problem to developing general ways of thinking. Focus is placed on the process to make it easier to gauge the mastery of a concept rather than the answer produced.
gain valuable insight to students’ processes of visualization before the processes are forgotten in favor of the final outcome of problems posed to the students. These principles are
described in Table 2.
The research by Lesh et al. is founded on constructivism. As students learn, the knowledge they take away comes from actively constructing it.2 Students take in a version of a concept every time it is presented to them and arrange it, along with any other information about that concept, into something compatible with existing knowledge. Lesh et al. define these active assemblies of fitting new information into a larger picture as mental constructs. Mental constructs are “models or conceptual systems embedded in a variety of