Simulation Analysis of Static and Shaking Table Tests on RC Columns
with Insufficient Lap Splices
Fan Wang1, Sylvain Lavarenne2, Thierry Chaudat1, Didier Combescure1, Thierry Payen1, Bernard Fouré3
1
CEA/DEN/DANS/DM2S/SEMT, Saclay, 91191 Gif-sur-Yvette Cedex, France ([email protected]) 2
DSR/SAMS/BAGCS, IRSN, B.P. 17, 92262 Fontenay-aux-Roses Cedex, France 3
Consultant, 15 chemin des Beauvilliers, 78280 Bougival, France
ABSTRACT
This paper presents simulation analyses conducted on a series of RC columns with insufficient lap splices tested under horizontal static loadings and on a shaking table. The analyses are performed using non linear fiber model with the computer code CAST3M. Each fiber is described by a non linear uniaxial constitutive law for concrete or steel bars. A law based on the Eligehausen model has been introduced to account for the bond-slip relationship between the reinforcing bars and the surrounding concrete. It is shown that despite its simplicity, the bond-slip model used can reproduce realistic behavior of the tested RC columns up to failure. The results suggest that this kind of non-linear analysis can be used in the detailed re-evaluation of existing concrete buildings.
INTRODUCTION
Due to the moderate level of seismic activities in France, many reinforced concrete buildings and nuclear facilities constructed in the 1960’s and 1970’s have been designed without any seismic consideration or according to the building codes of that time, which no longer satisfy the current seismic code requirement. In the case of existing nuclear facilities, detailed seismic re-evaluations are necessary for safety reasons and the applications of current design procedures to the existing structures tend to give unrealistic and over-conservative results. Consequently, experimental and analytical approaches have been developed to simulate the actual behavior of RC structures beyond the conventional code limits in order to assess the influence of the lack of relevant detailing on the overall post-elastic behavior.
With the aim of improving modeling tools for obsolete detailing arrangements, IRSN (French institute for radiological protection and nuclear safety) asked CEA (French atomic energy commission) to carry out a campaign of experimental tests and numerical simulations. The experimental program aimed at investigating the seismic behavior of RC columns with insufficient lap splices. It was conducted on 5 scaled models with different transverse clamping reinforcement. During the tests, failure due to concrete splitting in the region of lap splices, before fully developing the flexural strength of the section, was observed on three of the five models tested.
This paper presents the post-test simulation analyses performed on the test models. They are carried out using the general purpose finite element code CAST3M developed in CEA. Fiber models based on a Timoshenko beam element are used. Each fiber is described by a non linear uniaxial constitutive law for concrete or steel bars and a law based on the Eligehausen model has been introduced to account for the bond-slip relationship between the reinforcing bars and the surrounding concrete. The numerical simulations include:
- Calculations for three models tested statically with the measured top displacement of each model as input
loading,
- Calculations for 2 models tested on the shaking table with the measured base accelerations as the input motion.
The primary objective of this study is to evaluate the capability and performance of the fiber element in CAST3M for the seismic assessment of reinforced concrete frame structures.
In the first part of this paper, the experimental program will be presented. The main principles of numerical modeling using fiber element will be reminded before descriptions of the non linear constitutive laws used. Comparisons between numerical and experimental results will be made for the validation of the proposed modeling approach.
EXPERIMENTAL PROGRAM
The experimental program was conducted on 5 scaled column models with rectangular section characterized by insufficient lap splices. It was carried out in two laboratories:
- Static tests on 3 specimens under horizontal cyclic loadings, performed at CEBTP,
- Seismic tests on 2 specimens performed on a shaking table in the CEA Seismic Laboratory.
Test specimens
The models, designated as Specimen 1 to 5, had all identical dimensions as shown in Figure 1. Each specimen had a heavily reinforced foundation slab for fixation and a top slab to hold an additional mass during the test.
The reinforcement of the column was designed according to the French CCBA 68 code previsions to reflect the construction practice in the 1960’s and 1970’s. The five models contained the same flexural reinforcement bars (six 10
mm diameter deformed bars) which were all lap spliced at the bottom of the column. The splice length was kept constant (340 mm) for all the models but the transverse clamping reinforcement and the thickness of the concrete cover were varied as shown in Table 1 for the purpose of the investigation.
The mechanical properties of reinforcement and that of the concrete used in this program were measured in standard material tests and are summarized in Table 2 and Table 3.
Fig. 1. Overall dimensions and reinforcement of the specimens (unit = mm)
Table 1. Clamping reinforcement and concrete cover
Transverse clamping ties
Specimen Type of test Diameter
(mm)
Spacing* (mm)
Number of ties over the splice length
Concrete cover for flexural bars (mm)
1 5 70 5 12.5
2 4 120 3 11.5
3
Static (CEBTP)
5 150 2 9
4 5 150 2 9
5
Dynamic
(CEA) 5 100 3 9
* Constant along the height of the column
Table 2. Properties of the reinforcement
Diameter (mm)
Yielding limit
(MPa) Tensile strength (MPa)
4 180 300
5 190 300
8 555 605
10 565 655
Table 3. Properties of the concrete
Specimen Compressive
strength (MPa)
Tensile strength (MPa)
Modulus of elasticity (MPa)
1 30.5 3.05 28000
2 32.0 3.15 28500
3
4 25.0 3.10 23000
5 28.1 2.89 28700
Static tests
The static experiment setup is shown in Figure 2. The foundation slab of the specimen was firmly bolted to the test platform to provide full fixation during the tests. The top slab was loaded with 4 steel blocks with a total mass of 2500 kg to simulate the axial force in the column. The loading system consisted of two push-only hydraulic actuators supported by a reaction frame. Reversed cyclic forces were applied to the specimen at the level of center of the top mass which is 1.5 meters above the surface of the foundation slab.
Each specimen was subjected to a predetermined loading program. Initially, the increment amplitude was in force but changed into displacement at later stage when the maximal bearing capacity of the column was reached. At each displacement level, one or two complete loading cycles were imposed. The specimens were tested up to failure.
Fig. 2. Static experiment setup
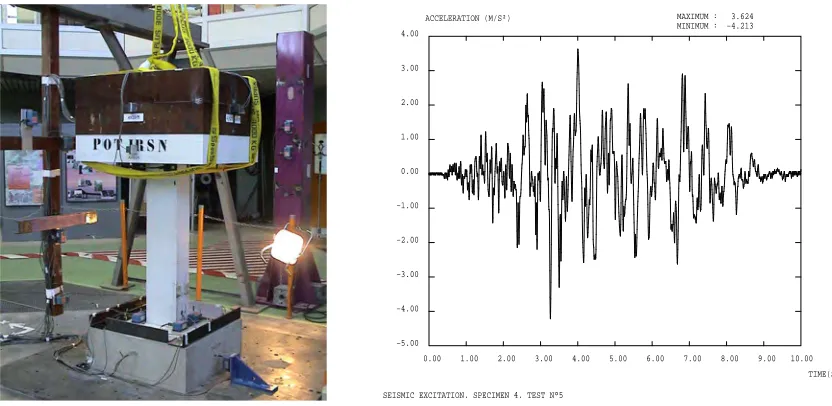
Shaking table tests
Figure 3 shows the dynamic experiment setup on the shaking table. The foundation slab of the specimen was firmly fixed on the surface of the table. As in the static tests, the top slab was loaded with an additional mass of 2500 kg. Each specimen was subjected to a series of artificial seismic excitations with increasing amplitude up to failure. The response of the specimen in acceleration and displacement was recorded during the tests.
SEISMIC EXCITATION, SPECIMEN 4, TEST N°5
TIME(S) ACCELERATION (M/S²)
0.00 1.00 2.00 3.00 4.00 5.00 6.00 7.00 8.00 9.00 10.00 −5.00
−4.00 −3.00 −2.00 −1.00 0.00 1.00 2.00 3.00 4.00
MINIMUM : −4.213 MAXIMUM : 3.624
Fig. 3. Dynamic experiment setup and seismic excitation
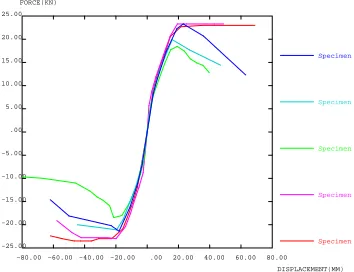
Test results
Figure 4 presents the envelopes of the lateral force-displacement hysteretic curves of the specimens. The test results are summarized in Table 4. For Specimen 1 and Specimen 2, a major horizontal crack at the base of the column was observed with the crushing of the concrete on the opposite side. The data of the strain gauges placed on the reinforcing bars near the crack suggested that the failure was induced by steel yielding. For Specimens 3 to 5, vertical cracks appeared in the splice region at some stage of the loading and leaded to the concrete cover splitting at the final stage. This is typical of lap splice failures.
Table 4. Test results – overall behavior of the specimens
DISPLACEMENT(MM) FORCE(KN)
−80.00 −60.00 −40.00 −20.00 .00 20.00 40.00 60.00 80.00 −25.00 −20.00 −15.00 −10.00 −5.00 .00 5.00 10.00 15.00 20.00 25.00 Specimen N°1 Specimen N°2 Specimen N°3 Specimen N°4 Specimen N°5
Fig. 4. Force-displacement envelopes
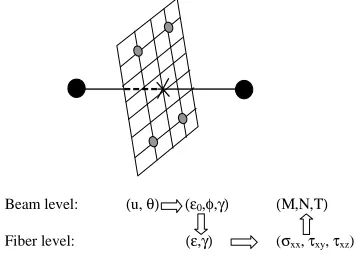
FIBER MODELLING
The behavior of reinforced concrete members such as beams and columns under seismic loading can be reproduced using 1D frame elements with non linear fiber models implemented in the computer code CAST3M developed in CEA [1] [2] [3].
Timoshenko beam and fiber formulation
A simple Timoshenko beam element has been adopted for the fiber formulation in order to allow shear distortion and so the use of non linear constitutive laws not only for bending but also for shear and torsion. In order to avoid shear locking, this beam element has a unique Gauss integration point. The axial strain, curvature and shear strain remain constant along the length of the element [4].
In the fiber formulation, the beam element is idealized as a group of parallel uniaxial fibers. The cross section, which can be of arbitrary shape, is divided into sub-elements (Figure 5). The axial and shear strains in each sub-element are deduced directly from the average axial εx and shear strains εy, εz, the curvatures (in bending φy, φz and in torsion φx) of the beam element and the section geometry.
( )
εx i=εx−yi⋅φz+zi⋅φy( )
γy i=γy−zi ⋅φx( )
γz i=γz +yi ⋅φx (1)The axial force Nx, bending moments My, Mz, shear forces Ty, Tz and torsional moment Mx are calculated by integrating the axial and shear stresses on the cross section.
∫
=S x
x dS
N σ =
∫
⋅S x
y z dS
M σ =−
∫
⋅S x
z y dS
M σ (2)
∫
=S y
y dS
T τ =
∫
S z
z dS
T τ =
∫
⋅ − ⋅S
y z
x (y z )dS
M τ τ
Constitutive laws
Each fiber supports a uniaxial law σ(ε) representative of concrete or steel behavior. Figure 6 shows the Hognestad laws [5] used for concrete with softening in compression and tension and the Menegotto-Pinto law [6] for steel with hardening, Bauschinger effect and buckling. Since the axial stress σx is used for both global axial force and bending moment, the fiber model implicitly takes into account the coupling between these two generalized forces. This may be important for RC elements with low reinforcement ratio and/or high axial force.
Ultimate strength
Specimen Force
(KN) Disp. (mm) Curve shape Failure mode
22,7 21,6
1
-23,0 -22,7
Flexion type
Bar yielding
23,3 19,3
2
-23,0 -19,9
Flexion type
Bar yielding
18,5 19,2
3
-18,5 -21,4 Pinched
Concrete splitting
19,9 16,0
4
-21,1 -19,6 Pinched
Concrete splitting
23,3 23,0
5
-21,4 -18,0 Pinched
Concrete splitting
Beam level: (u, θ) (ε0,φ,γ) (Μ,Ν,Τ)
Fiber level: (ε,γ) (σxx, τxy, τxz)
Fig. 5.Non linear fiber beam model
Strain ε
σpt σc0
Stress σ
Z
σc0
Stress σ
Strain ε Eh<0
E Er<E
a) Hognestad law for concrete b) Menegotto-Pinto law for steel Fig. 6. Uniaxial constitutive laws for concrete and steel
Bond stress-slip law
For the reinforcing bar elements in the anchorage region, a special law has been introduced to account for the bond stress-slip relationship between the steel and the concrete. It can be used to simulate the failure of lap splices. An approach similar to that implemented by Monti and Spacone [7] has been adopted in CAST3M. The uniaxial law σ(ε) is based on the partition of the total strain between the real strain in the reinforcing bars εs and the slippage s between the bar and the concrete (Figure 7). This partition can be written in the following incremental form:
anc s
L s
∆ ε ∆ ε
∆ = + With ∆εs=λ∆ε and ∆s=Lanc(1−λ)∆ε
where Lanc is the length of the anchorage or splice, λ the partition factor.
The axial stress in the steel bars σs is determined by the Menegotto-Pinto law described earlier. The bond stress
τ which is assumed constant along the length of anchorage is governed by the Eligehausen bond-slip model (Figure 7)
[8] [9]. The partition factor λ can be calculated iteratively using the static equilibrium between the axial force inside the steel bar and the bond force applied on the surface.
Fig. 7. Bond-slip model for bar anchorage and lap splices a) Stress distribution
τ σs
s1 s2 s3
τ
τmax
τ= τmax.(s/s1)α
slip
τ
b) Eligehausen bond-slip model
POST-TEST NUMERICAL SIMULATIONS
The fiber models described above were used to perform post-test calculations to simulate the overall behavior of the test models. These simulations included static calculations for Specimens 1, 2 and 3 tested under cyclic loadings and dynamic calculations for Specimens 4 and 5 tested on the shaking table.
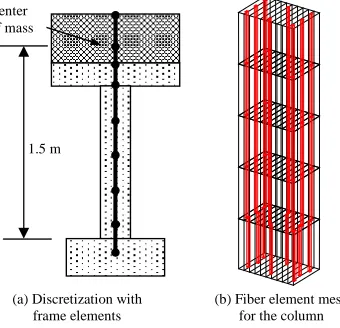
Finite element model
(a) Discretization with frame elements
(b) Fiber element mesh for the column
Figure 8(a) shows how the test model was discretized into frame elements. The upper part of the model consisting of the top slab and the steel blocks (additional mass) was modeled with rigid elements. The RC column itself was discretized into 5 Timoshenko fiber elements as shown in Figure 8(b) with the first 4 elements representing the nominal section of the column and the last element representing the lap splice region. In this bottom element, the steel fibers are offset in accordance with the reinforcement design shown in Figure 1. The bond-slip law was applied to the reinforcing bars in addition to its Menegotto-Pinto constitutive law.
According to the experimental setup and the test data, a fixed-base condition was assumed for the bottom end of the column in the analysis.
The element meshes were almost the same for the 5 specimens. The only difference between them was the positions of the reinforcing bars which were slightly varied according to
the concrete cover thickness defined in Table 1. Fig. 8. Finite element model
Static calculations
Non linear static analyses have been performed for the first three models with their weight and the measured center-of-mass lateral displacement as input loadings. Table 5 presents the bond stress-slip law parameters given by its author Eligehausen [8] [9]. The results of the analysis depend directly on the value of these parameters.
Table 5. Parameters for the mean bond stress-slip relationship (deformed bars) [8] [9]
Confinement of concrete
Unconfined concrete (concrete splitting)
Confined concrete (concrete shearing between the ribs)
1 2 3 4
Bond conditions Good Other Good Other
s1 0.6 mm 0.6 mm 1.0 mm
s2 0.6 mm 0.6 mm 3.0 mm
s3 1.0 mm 2.5 mm Clear rib spacing
α 0.4 0.4
τmax 2.0
c
f (MPa) 1.0 f (MPa) c 2.5 f (MPa) c 1.25 f (MPa) c
τf 0.15τmax 0.4τmax
In the case of Specimen 1 and Specimen 2, as no concrete splitting was observed in the lap splice region, the parameters of the last column in Table 5 have been adopted in the analyses. It can be shown by a simple hand calculation that these parameters should lead to a splice strength larger than the yielding strength of the column. This was confirmed by the results of the numerical computations which are in good agreement with the experimental results as shown in Figure 9.
In the case of Specimen 3, as the failure was induced by concrete splitting, the parameters of the second column in Table 5 were adopted for the analysis in the first place. As can be seen in Figure 10(a), this calculation leaded to a yielding failure as in the case of Specimens 1 and 2 and the strength of the column was largely overestimated. The main reason for this is that the transverse reinforcement ratio of Specimen 3 is so small that it is indeed out of the scope of Table 5 [8]. A second calculation has been performed by reducing the value of the bond strength τmax to0.61 fc and by adjusting the parameters s2 and s3 between the values given by columns 2 and 4 in Table 5. Figure 10(b) presents the computed force-displacement relationship. A very good agreement has been achieved with the test results.
Dynamic calculations
For Specimen 4 and 5 which were tested on the shaking table, the analysis started with a non linear static calculation with the specimen weight as input loading. It was then followed by a succession of dynamic calculations with the measured table accelerations of increasing amplitude as input motions. For each dynamic calculation, the final state
Center of mass
1.5 m
of the specimen in the previous calculation was restored as the initial state of the structure so that the damage caused by each dynamic test (even the white-noise test for the table calibration) was taken into account.
The numerical model validated for Specimen 3 was used. The calculations were performed using the Newmark integration scheme with a time step of 0.001 s. A 1% damping ratio was assumed based on the white-noise test results.
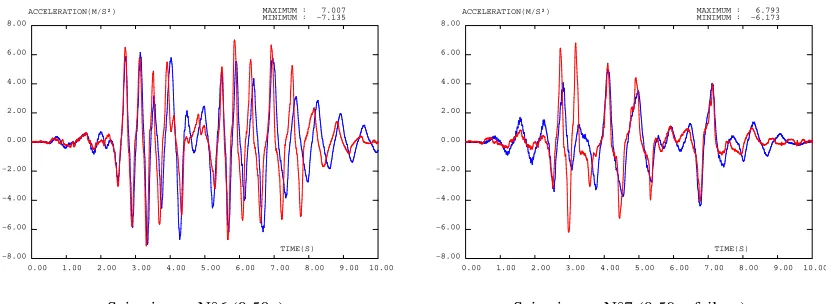
For Specimen 4, very good numerical results have been obtained up to the fourth seismic tests (0,33g) (Figure 11(a)). Even for the last (N°5) test, the numerical response was rather close to the recorded one until the failure of the column during the test (Figure 11(b)). The results for Specimen 5 (Figure 12) also show that the numerical model used can simulate the overall behavior of the column up to failure.
DISPLACEMENT(MM) FORCE (KN)
−80.00 −60.00 −40.00 −20.00 0.00 20.00 40.00 60.00 80.00 −25.00
−20.00 −15.00 −10.00 −5.00 0.00 5.00 10.00 15.00 20.00
25.00 MINIMUM : −24.58
MAXIMUM : 24.70
DISPLACEMENT(MM) FORCE(KN)
−60.00 −40.00 −20.00 0.00 20.00 40.00 60.00
−25.00 −20.00 −15.00 −10.00 −5.00 0.00 5.00 10.00 15.00 20.00
25.00 MINIMUM : −24.52
MAXIMUM : 24.69
a) Specimen 1 b) Specimen 2
Fig. 9. Calculated (red) and experimental (blue) force-displacement curve for Specimen 1 and 2
DISPLACEMENT(MM) FORCE(KN)
−1.00 −0.80 −0.60 −0.40 −0.20 0.00 0.20 0.40 0.60 x1.E2 −30.00
−20.00 −10.00 0.00 10.00 20.00
30.00 MINIMUM : −25.41
MAXIMUM : 25.24
DISPLACEMENT(MM) FORCE(KN)
−1.00 −0.80 −0.60 −0.40 −0.20 0.00 0.20 0.40 0.60 x1.E2 −20.00
−15.00 −10.00 −5.00 0.00 5.00 10.00 15.00
20.00 MINIMUM : −18.38
MAXIMUM : 18.43
a) Calculation 1 b) Calculation 2
Fig. 10. Calculated (red) and experimental (blue) force-displacement curve for Specimen 3
TIME(S) ACCELERATION(M/S²)
0.00 1.00 2.00 3.00 4.00 5.00 6.00 7.00 8.00 9.00 10.00 −8.00
−6.00 −4.00 −2.00 0.00 2.00 4.00 6.00
8.00 MINIMUM : −6.422
MAXIMUM : 7.160
TIME(S) ACCELERATION(M/S²)
0.00 1.00 2.00 3.00 4.00 5.00 6.00 7.00 8.00 9.00 10.00 −8.00
−6.00 −4.00 −2.00 0.00 2.00 4.00 6.00
8.00 MINIMUM : −6.557
MAXIMUM : 6.785
Seismic test N°4 (0.33g) Seismic test N°5 (0.43g, failure)
Fig. 11. Calculated (red) and experimental (blue) acceleration response for Specimen 4
TIME(S) ACCELERATION(M/S²)
0.00 1.00 2.00 3.00 4.00 5.00 6.00 7.00 8.00 9.00 10.00 −8.00
−6.00 −4.00 −2.00 0.00 2.00 4.00 6.00
8.00 MINIMUM : −7.135
MAXIMUM : 7.007
TIME(S) ACCELERATION(M/S²)
0.00 1.00 2.00 3.00 4.00 5.00 6.00 7.00 8.00 9.00 10.00 −8.00
−6.00 −4.00 −2.00 0.00 2.00 4.00 6.00
8.00 MINIMUM : −6.173
MAXIMUM : 6.793
Seismic test N°6 (0.50g) Seismic test N°7 (0.59g, failure)
Fig. 12. Calculated (red) and experimental (blue) acceleration response for Specimen 5
SUMMARY AND CONCLUSION
In the first part of this paper, static and shaking table tests on 5 scaled column models have been outlined. The experimental program aimed at investigating the seismic behavior of RC columns with insufficient lap splices at their base (splice length = 34φ) which can be found in existing buildings constructed in France in the 1960’s and 1970’s. By varying the quantity of the transverse clamping reinforcement and the concrete cover thickness, splice failure was obtained for 3 of the 5 models during the tests. Experimental data have been briefly presented.
The second part of the paper focused on the post-test numerical simulations. These analyses have been performed using non linear fiber model with the computer code CAST3M. Each fiber is described by a non linear uniaxial material constitutive law. A bond-slip relationship proposed by Eligehausen and adopted by CEB-FIP 1990 [8] has been used to model the lap splice of the reinforcing bars. It is shown that despite its simplicity, the bond-slip model used can reproduce realistic behavior of the tested RC columns up to the failure. The results suggest that this kind of non-linear analysis can be used in the re-evaluation of existing concrete buildings even with very poor detailings.
It should be noted, however, that the results of the numerical simulation depend strongly on the determination of the model parameters. In the case of the 3 specimens with lap splice failures reported here, the transverse reinforcement ratios were so small that they were indeed out of the scope of the bond-slip model originally defined by its author. To make the numerical analysis predictive, one should extend the field of validity of the model and improve the rules for the determination of the bond-slip parameters. This can be done by performing elementary tests with small to zero quantity of transverse reinforcement.
REFERENCES
1. Anthoine A., Guedes J., Pegon P., “Non linear behavior of reinforced concrete beams : from 3D continuum
to 1D member modeling”, Computer & Structures, Vol. 65, No. 6, 1997
2. Sollogoub P., Quevel JC, Wang F., Combescure D., “Seismic reevaluation of structures: a combined analytical and experimental approach”, 13th World Conference on Earthquake Engineering, Vancouver, Canada, 2004
3. Combescure D., Wang F., “Assessment of existing RC structures under severe dynamic loading using non
linear modeling” CONSEC’07, France, 2007
4. Guedes J., Pegon P., Pinto A.V., “A fiber Timoshenko beam element in CASTEM 2000”, Technical note n°
1.94.31, ELSA, Joint Research Center, Ispra, 1994.
5. Hognestad E., “A study of combined bending and axial load in reinforced concrete”, Bulletin Series 339, Univ. of Illinois Exp. Sta., Illinois, 1951
6. Menegotto M., Pinto P., “Method of analysis for cyclically loaded reinforced concrete plane frame including changes of geometry and non elastic behavior of elements under combined normal force and bending”, IABSE symposium on resistance and ultimate deformability of structures acted on by well defined repeated loads, final report, Lisbon, 1973
7. Monti, G., Spacone, E. “Insertion of bond-slip into RC beam fiber elements”, 11th European Conference on
Earthquake Engineering, 1998.
8. Comité Euro-International du Béton, “CEB-FIP model code 1990”, Thmoas Telford, 1993
9. Eligehausen R., Balazs G.L., “Bond and detailing”. Bulletin d’Information CEB N°217, Comité Euro-International du Béton, 1993