Research on Streamlining Seismic Safety Evaluation of Underground Reinforced
Concrete Duct-Type Structures in Nuclear Power Stations.
-Part-2. Experimental Aspects of Laminar Shear Sand Box Excitation Tests with
Embedded RC Models
Keizo Ohtomo1), Toshio Suehiro1), Tadashi Kawai1), and Kensei Kanaya2)
1) Central Research Institute of Electric Power Industry, Chiba, Japan 2) Kansai Electric Power Co. Ltd., Osaka, Japan
ABSTRACT
The primary object of the present paper is to identify some aspects of plastic deformation performance of underground reinforced concrete (RC) structures under a strong ground motion. For this purpose, the authors conducted two cases of two-dimensional plane strain condition shake table test, in which overburden depth of a scaled model structure was selected as 3.0 m and 1.5 m, respectively. Nonlinear ground response, plastic structure deformation and dynamic soil-structure interaction are discussed based on these test results. Emphasis is placed on the exclusivity of soil volume change in large ground strain, the degree of plastic deformation and the essential responsibility of dynamic shear stress and earth pressure on the model RC structure.
INTRODUCTION
Earthquake resistance capability of underground reinforced concrete (RC) structures has been a great concern among civil engineering societies in Japan since the 1995 devastating Grate Hanshin Earthquake. During the earthquake, several subway stations collapsed and some extent of subway tunnels sustained minor to moderate damage. Such serious damage prompted us to develop ductility-based design practice in case of strong ground shaking with extremely low occurrence probability. However, the effect of nonlinear soil-structure interaction, which is a key issue to discuss seismic performance of underground RC structures, has yet been fully resolved so far.
Seismic performance and damage development of underground RC structures have been discussed successfully by experimental studies. Honda et al. [1] conducted static loading test on four cases of scaled box RC structures and showed cross section ductility of these structures. Aoyagi et al. [2] carried out static loading test for two types of box RC structures in a soil box filled with dry sand. They indicated considerable soil-structure interaction for structure deformation. These previous studies seem to provide us only post-yielding deformation under highly approximated earthquake loading. Dynamic loading test that incorporates with soil-structure interaction is, therefore, essential to enhance understanding for dynamic behavior of underground RC structures.
The primary object of the present paper is to identify some aspects of plastic deformation performance on underground RC structures under a strong ground motion. A larger-scale shake table (12 m by 12 m) test using a laminar shear soil box (about 5 m in height and 12 m in wide) was conducted for this purpose. Nonlinear ground response, plastic deformation of the model structures and dynamic soil-structure interaction are discussed based on the shake table test.
SHAKE TABLE TEST
Two cases of test were performed in a laminar shear box using a large shake table with a maximum loading capacity of 5000 kN, which is owned by National Research Institute for Earth Science and Disaster Prevention, Ministry of Education, Culture, Sports, Science and Technology. The arrangements of the model RC structures in the laminar box are depicted in Fig. 1. One was Fixed Case in which a two-box type model structure was fixed to the base plate of the shake table. The other was Unfixed Case in which an identical model structures was embedded in the mid-height part of the laminar box. Dry sand with the target relative density about 87 % was used to fill the laminar box. Specific gravity, minimum and maximum void ratio of the sand were 2.688, 0.683 and 1.091, respectively. Shear wave velocity was measured as about 180 m/s at the mid-depth of the sand deposit, ranging 0 m/s to about 200 m/s in accordance with depth, i.e., from the ground surface to the deposit base.
The scaled version of the North-South component of the horizontal ground motion recorded in Kobe University during the 1995 Hyogoken Nanbu Earthquake was employed as an input wave. The tests were programmed into several cases of excitation levels with different peak accelerations as tabulated in Table 1. The structural properties of the model RC structures were so determined taking into account the power of the shaking table that the models were sure to be damaged significantly during the excitation. The mechanical properties of the model RC structures are listed in Table 2. Thickness of the sidewalls and top slab was 10 cm. Thickness of the bottom slab was 30 cm. To facilitate yielding in steel, the main reinforcement was specially treated to lower the yield strength to about 258 kPa. As far as frame stiffness of the model RC structures were concerned, they accounted for about 20 % compared to surrounding sand.
SMiRT 16, Washington DC, August 2001 Paper # 1295
Fig. 1 Shake Table Test Configuration (a) Fixed Case and (b) Unfixed Case (Unit : m)
Table 1 Shaking List Table 2 RC Properties
TEST RESULTS ANS DISCUSSIONS
Nonlinear Ground Response
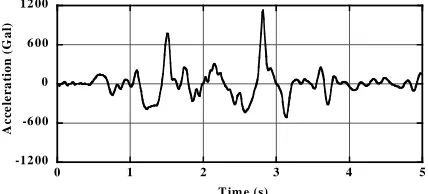
Model ground response that is basically the consequence upon plastic deformation of the model RC structure and dynamic soil-structure interaction is first examined herein. Figure 2 shows an example of the acceleration time history recorded at the shake table for Fixed Case. The peak acceleration was adjusted to 1127 Gal so that distinct nonlinear response in the model ground would occur.
Typical nonlinear ground response is observed in maximum horizontal ground response both in Fixed and Unfixed Cases. Figure 3 shows maximum acceleration amplitude distribution with respect to depth. In case of 225 and 223 Gal in peak acceleration, moderate ground amplification takes places, while acceleration response is rather reduced throughout soil deposit in case of 1127 and 1041 Gal. In the latter shaking case, the effect of hysteretic damping of stress-strain relationship occurs significantly.
Some unique ground response associated with large ground strain is obtained in vertical response. Figure 4 presents the time history of vertical ground surface acceleration and displacement from Fixed and Unfixed Cases under 1127 and 1041 Gal in peak acceleration. Even though only horizontal shaking was applied in the shake table test, vertical response that involves higher frequency components is developed. This is believed to be a volume change of the model ground associated with dilatancy effect, which is most likely to occur in well-compacted soil. Such volume change also plays a crucial role on dynamic earth pressure on the model RC structure sidewalls, as we will discuss later.
Fig. 2 Example of Base Acceleration 11.6
3.0
1.
75
4.
75
3.
0
Dry Sand
Model RC Structure (a)
11.6
3.0
1.
75
4.
75
1.
5 Dry
Sand
Model RC Structure (b)
11.6
3.0
1.
75
4.
75
3.
0
Dry Sand
Model RC Structure (a)
11.6
3.0
1.
75
4.
75
3.
0
Dry Sand
Model RC Structure 11.6
3.0
1.
75
4.
75
3.
0
Dry Sand
Model RC Structure (a)
11.6
3.0
1.
75
4.
75
1.
5 Dry
Sand
Model RC Structure (b)
11.6
3.0
1.
75
4.
75
1.
5 Dry
Sand
Model RC Structure 11.6
3.0
1.
75
4.
75
1.
5 Dry
Sand
Model RC Structure (b)
-12 00 -6 00 0 6 00 12 00
0 1 2 3 4 5
A
c
ce
le
ra
tion (G
a
l)
T im e (s) (in Gal)
No. Fixed case Unfixed case
1 60 105
2 109 223
3 225 1041
4 1127 1044
5 477 596
6 531 1033
7 1126
-Young's modulus (GPa) 22.6 Comp. Strength (MPa) 32.4 Tensile strength (MPa) 2.3 Young's modulus (GPa) 178 Yield strength (MPa) 257.6 Concrete
Rebar (in Gal)
No. Fixed case Unfixed case
1 60 105
2 109 223
3 225 1041
4 1127 1044
5 477 596
6 531 1033
7 1126
-Young's modulus (GPa) 22.6 Comp. Strength (MPa) 32.4 Tensile strength (MPa) 2.3 Young's modulus (GPa) 178 Yield strength (MPa) 257.6 Concrete
Fig. 3 Acceleration Amplitude (a) Fixed Case and (b) Unfixed Case
Fig.4 Ground Surface Vertical Response (a) Fixed Case and (b) Unfixed Case
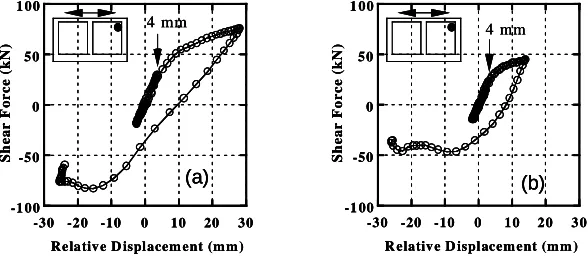
Fig. 5 Shear Force and Relative Displacement Relation (a) Fixed Case and (b) Unfixed Case
Plastic Deformation of Model Structure
Considerably large relative displacement between the top and bottom slabs of the model RC structure (hereafter we define as “relative displacement”.) is acquired in strong ground shaking. This represents the degree of plastic deformation of the model RC structure. The nature of relative displacement is discussed in the light of ground deformation.
Yielding in outer and inner reinforcements at the upper and lower corners was measured in case of Fixed and Unfixed Cases under 1127 and 1041Gal in peak acceleration. Figure 5 depicts the relationship between the shear force on the top slab surface of the model RC structure, which is based on measured shear stress and the relative displacement. Figure 5 expands the part of the duration, i.e., 0 to about 2.0 seconds. Somewhat significant slope degradation in so-called load and displacement relation can be observed when the relative displacement exceeds 4 mm. Indeed, first yielding in reinforcing bars yielding occurred at that relative displacement, thus yielding relative displacement is defined as 4 mm in the present paper.
0 1000 2000 3000 4000 5000
0 1 2
Amplitude Elevation (mm) 1127Gal 225Gal (a) 0 1000 2000 3000 4000 5000
0 1 2
Amplitude Elevation (mm) 1041Gal 223Gal (b) 0 1000 2000 3000 4000 5000
0 1 2
Amplitude Elevation (mm) 1127Gal 225Gal (a) 0 1000 2000 3000 4000 5000
0 1 2
Amplitude Elevation (mm) 1127Gal 225Gal 0 1000 2000 3000 4000 5000
0 1 2
Amplitude Elevation (mm) 1127Gal 225Gal (a) 0 1000 2000 3000 4000 5000
0 1 2
Amplitude Elevation (mm) 1041Gal 223Gal (b) 0 1000 2000 3000 4000 5000
0 1 2
Amplitude Elevation (mm) 1041Gal 223Gal 0 1000 2000 3000 4000 5000
0 1 2
Amplitude Elevation (mm) 1041Gal 223Gal (b) -1 00 -50 0 50 1 00
-30 -20 -10 0 10 20 3 0
Sh ea r F o rce ( k N )
R elativ e D isplacem ent (m m )
4 mm (b) -1 00 -50 0 50 1 00
-30 -20 -10 0 10 20 30
Sh ea r F o rce (k N )
Re lativ e D isplacem ent (m m )
4 mm (a) -1 00 -50 0 50 1 00
-30 -20 -10 0 10 20 3 0
Sh ea r F o rce ( k N )
R elativ e D isplacem ent (m m )
4 mm (b) -1 00 -50 0 50 1 00
-30 -20 -10 0 10 20 3 0
Sh ea r F o rce ( k N )
R elativ e D isplacem ent (m m )
4 mm (b) -1 00 -50 0 50 1 00
-30 -20 -10 0 10 20 30
Sh ea r F o rce (k N )
Re lativ e D isplacem ent (m m )
4 mm (a) -1 00 -50 0 50 1 00
-30 -20 -10 0 10 20 30
Sh ea r F o rce (k N )
Re lativ e D isplacem ent (m m )
4 mm (a) -10 00 -5 00 0 5 00 10 00 -20 -10 0 10 20
0 1 2 3 4 5
A cc . (A V G 1 1)
D isp . (D V G 2 )
A c c e le ra ti o n (G a l) D isp la cem en t (m m)
T im e (s)
AVG1 DVG2 (a) -10 00 -5 00 0 5 00 10 00 -40 -20 0 20 40
0 1 2 3 4 5
A cc . (A V G 1 )
D isp . (D V G 2 )
A c c e lera tio n (G a l) D isp la cem en t (m m)
T im e (s)
AVG1 DVG2 (b) -10 00 -5 00 0 5 00 10 00 -20 -10 0 10 20
0 1 2 3 4 5
A cc . (A V G 1 1)
D isp . (D V G 2 )
A c c e le ra ti o n (G a l) D isp la cem en t (m m)
T im e (s)
AVG1 DVG2 (a) -10 00 -5 00 0 5 00 10 00 -20 -10 0 10 20
0 1 2 3 4 5
A cc . (A V G 1 1)
D isp . (D V G 2 )
A c c e le ra ti o n (G a l) D isp la cem en t (m m)
T im e (s)
AVG1 DVG2 AVG1 DVG2 (a) -10 00 -5 00 0 5 00 10 00 -40 -20 0 20 40
0 1 2 3 4 5
A cc . (A V G 1 )
D isp . (D V G 2 )
A c c e lera tio n (G a l) D isp la cem en t (m m)
T im e (s)
AVG1 DVG2 (b) -10 00 -5 00 0 5 00 10 00 -40 -20 0 20 40
0 1 2 3 4 5
A cc . (A V G 1 )
D isp . (D V G 2 )
A c c e lera tio n (G a l) D isp la cem en t (m m)
T im e (s)
AVG1
DVG2 AVG1
DVG2
Correlation between the relative displacement and the ground deformation is then examined whether or not the dynamic performance of the model RC structure suffers from ground deformation. The time history of the relative displacement and the ground displacement are superimposed in Fig. 6 for Fixed and Unfixed Cases under 1127 and 1041 Gal, respectively. The ground displacement is defined as relative displacement between laminar soil box frames that were roughly located on the same distance with the top and bottom slabs of the model RC structure. In Fixed Case, the relative displacement is almost identical with the ground displacement. As we discussed earlier, yield displacement was about 4 mm, while the maximum relative displacement accounts for about 50 mm, therefore the ratio of maximum to yielding displacement is estimated as 12-13. In addition, this result demonstrates that the relative displacement is fully governed by ground deformation from elastic to plastic range. In Unfixed Case, although the phase for respectively the relative displacement and ground displacement roughly agrees in time history, the ground response is considerably large. This is mainly due to the fact that the space occupied by the model RC structure played resembling a vacant part in the model ground. However, the same nature of the plastic deformation of the model structure seems to be valid for Unfixed Case.
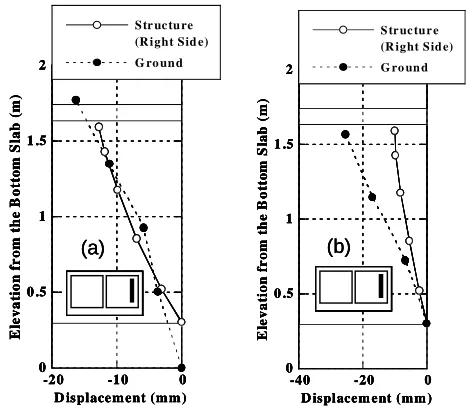
Residual deformation of the model RC structure was also measured. Figure 7 illustrates the residual relative displacement and the ground displacement after 1127 and 1041 Gal shakings for Fixed and Unfixed Case, respectively. In spite of the level ground configuration, the model ground undergoes residual displacement. This is believed to be arising from quite large acceleration peak involved in the latter part of the input motion. Since the model RC structure deforms in accordance with the ground deformation as shown in Fig. 6, deformation of the model RC structure remained after shaking.
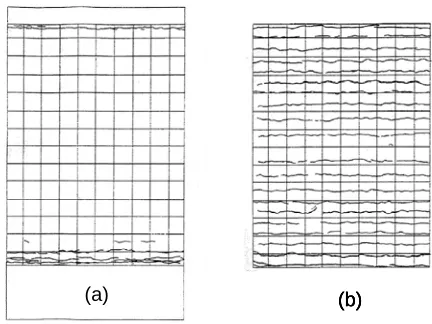
Significant concrete cracks were identified after the shake table test. Figure 8 shows cracks on outer and inner surface of the one of the sidewalls of the model RC structure. Bending cracks are clearly observed at the upper and lower corners. On the contrary, a number of flexural cracks exist on the inner wall. These crack patterns are a reflection on tension stress condition on the inner sidewall face and inward deflection. This was probably caused by dynamic earth pressure, of which nature will be discussed in the following section.
Fig. 6 Relative and Ground Displacements (a) Fixed Case and (b) Unfixed Case
Fig. 7 Residual Deformation Distribution (a) Fixed Case and (b) Unfixed Case
-40 -20 0
0 0 .5 1 1 .5 2
S tr uc tu r e (R ight S id e) G ro un d
D ispl acem ent (m m )
E le v a ti o n fr o m th e B o tto m S la b (m ) (b)
-20 -10 0
0 0 .5 1 1 .5 2
S tr uc tu re (R ight Sid e)
G ro un d
D isplace m ent (m m )
E le v a ti o n f r om th e B o tt o m S la b ( m ) (a)
-40 -20 0
0 0 .5 1 1 .5 2
S tr uc tu r e (R ight S id e) G ro un d
D ispl acem ent (m m )
E le v a ti o n fr o m th e B o tto m S la b (m ) (b)
-40 -20 0
0 0 .5 1 1 .5 2
S tr uc tu r e (R ight S id e) G ro un d
D ispl acem ent (m m )
E le v a ti o n fr o m th e B o tto m S la b (m )
-40 -20 0
0 0 .5 1 1 .5 2
S tr uc tu r e (R ight S id e) G ro un d
D ispl acem ent (m m )
E le v a ti o n fr o m th e B o tto m S la b (m ) (b)
-20 -10 0
0 0 .5 1 1 .5 2
S tr uc tu re (R ight Sid e)
G ro un d
D isplace m ent (m m )
E le v a ti o n f r om th e B o tt o m S la b ( m ) (a)
-20 -10 0
0 0 .5 1 1 .5 2
S tr uc tu re (R ight Sid e)
G ro un d
D isplace m ent (m m )
E le v a ti o n f r om th e B o tt o m S la b ( m )
-20 -10 0
0 0 .5 1 1 .5 2
S tr uc tu re (R ight Sid e)
G ro un d
D isplace m ent (m m )
E le v a ti o n f r om th e B o tt o m S la b ( m ) (a) -80 -40 0 40 80
0 1 2 3 4 5
D H 1 1 D H F 5-8
Di sp la c e m e n t ( m m)
T im e (s) DH11 DHF5-8 (b) -60 -30 0 30 60
0 1 2 3 4 5
D H 1 1 D H F 7
D isp lace me nt (mm )
T im e (s) DHF7 DH11 (a) -80 -40 0 40 80
0 1 2 3 4 5
D H 1 1 D H F 5-8
Di sp la c e m e n t ( m m)
T im e (s) DH11 DHF5-8 (b) -80 -40 0 40 80
0 1 2 3 4 5
D H 1 1 D H F 5-8
Di sp la c e m e n t ( m m)
T im e (s) DH11 DH11 DHF5-8 DHF5-8 (b) -60 -30 0 30 60
0 1 2 3 4 5
D H 1 1 D H F 7
D isp lace me nt (mm )
T im e (s) DHF7 DH11 (a) -60 -30 0 30 60
0 1 2 3 4 5
D H 1 1 D H F 7
D isp lace me nt (mm )
T im e (s) DHF7
DHF7
DH11
Fig. 8 Concrete Cracks (a) Outer and (b) Inner Sidewalls
Dynamic Soil-Structure Interaction Aspects
Nature of respectively dynamic shear stress and earth pressure on the top slab surface and the sidewalls are discussed herein. Their basic features have been already studied theoretically when structural rigidity is smaller than that of surrounding soil [3]. This view is, however, seems to be valid only if structure deformation is accompanied by elastic deformation. Thus the point of interest is to identify some features on this soil-structure interaction effect under plastic deformation. Emphasis is placed on how these soil-structure interaction forces contribute to the degree of relative displacement.
Figure 9 depicts dynamic earth pressure distribution on the sidewalls in case of Fixed Case under 1127 Gal, showing at the yielding and maximum relative displacement, respectively. Sidewall curvature that was estimated with measured rebar strain is also plotted in Fig. 9. The distribution pattern at the yielding relative displacement appears to be generally identical with the one in case of elastic deformation, as studied in the previous study [3]. Positive and negative values of the presenting dynamic earth pressure, which are respectively defined as compression and tension against the sidewalls, are reversed with respect to the sidewall downward direction. This pattern is also asymmetric on the right and left sidewalls.
The distribution pattern discussed here is as a result of the reaction function of dynamic earth pressure for structural deformation. When the deformation of an underground structure extends, it suffers from a couple of cyclic reversed soil shear stress that are developed by vertical seismic wave propagation in soil deposit. Due to the fact that rigidity is slightly different from the underground structure and the soil, a part of the shear stress working on the top slab surface is supported by the underground structure, i.e., sidewall deflection. Indeed, deformation modes are bending associated with section flexural rigidity for the underground structure and simple shear for the ground, thus some extent of relative displacement occurs along with the sidewall as a result of dynamic soil-structure interaction. Since the dynamic earth pressure may be characterized as a kind of subgrade reaction between soil and structure, then positive and negative values on the earth pressure is developed so that the force balance for the relative displacement can be maintained.
On the contrary to the distribution at the yielding relative displacement, an exceptional distribution pattern is clearly observed in case of the maximum relative displacement. The dynamic earth pressure acts as a compression force for the both sidewalls, although the model structure bears cyclic reversed shear deformation. This exclusive nature can be attributed to strain-dependency of well-compacted dry sand.
The dynamic earth pressure nature on the mid part of the sidewalls is then examined in time history and compared to the ground surface vertical displacement in Fig. 10 for Fixed and Unfixed Case under 1127 and 1041 Gal shakings, respectively. Time traces of respective response are almost identical and the positive amplitude involved in the dynamic earth pressure, i.e., compression on the sidewall, is predominant throughout the duration. This tendency is further intensified as when the relative displacement grows. Another aspect is that major positive peaks of both responses occur at almost the same time instant. The positive peak in the vertical displacement indicates rising of the ground surface, representing dilatant of the entire model ground. Thus dilatancy effect is probably responsible for the development of positive peaks appeared in the dynamic earth pressure. As is well known, well-compacted soil undergoes not only simple shear deformation but also volumetric change due to dilatancy effect and the volume change is mostly significant in large ground strain.
Contribution of the dynamic shear force and earth pressure intensities to structural deformation is then examined. Force moments on the center of the bottom slab were calculated from the above-mentioned components and they are compared in Fig. 11 for Fixed and Unfixed Case under 1127 and 1041Gal shakings, respectively. The moment associated with the dynamic shear force on the top slab surface is predominant and the moments of the dynamic earth pressure are considerably small. This undoubtedly demonstrates that the shear force still preserves a major role on the structural deformation, even though considerably large-localized compression earth pressure occurs for the both sidewalls.
Separation and slip at the soil-structure interface is most likely to occur particularly in a strong ground shaking. Slip
(a) (b)
(a)
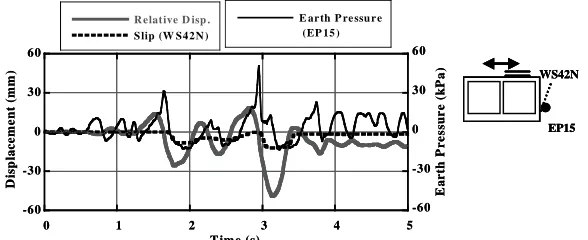
detection means, in which a pair of orthogonally attached metal tips moved horizontally on the top slab surface in accordance with the relative displacement between soil and the top slab surface and the movement was measured using strain gauge, was adopted in the shake table test. Figure 12 shows representative slip indication and the dynamic earth pressure in case of Unfixed Case under 1041 Gal. If some extent of displacement occurs, slip between soil and structure interface is possible. In this sense, evident slip was observed around 1.7 and 3.0 seconds in this shaking case. This is mainly due to the fact that the confining pressure that is roughly proportional to overburden depth is relatively small in Unfixed Case. Spike-shaped peaks are also observed in the dynamic earth pressure when the slip occurs. Since slip and separation are a reflection on strong nonlinearity, dynamic force balance changes abruptly in accordance with stiffness reduction associated with soil-structure interface. Thus these spike-shaped peaks are developed by slip phenomena.
Fig. 9 Dynamic Earth Pressure Distribution (a) at Yielding and (b) Maximum Relative Displacements
Fig. 10 Time Histories of Dynamic Earth Pressure and Ground Surface Vertical Displacement -1 00 -50 0 50 1 00 0 3 50 7 00 10 5 0 14 0 0 17 5 0
-0.05 -0.0 25 0 0.0 25 0.05
E arth P resure (kP a)
E le va ti o n fr om th e B o tto m S la b ( m m )
C urvatu re (1/m)
D y na m ic E ar th P ressu re
C ur vatu re
-1 00 -50 0 50 1 00 0 3 50 7 00 10 50 14 00 17 50
-0.06 -0.03 0 0.03 0.0 6
E arth P resure (kPa )
E le v a ti o n fr o m th e B o ttom S la b ( m m ) Curvature (1/m)
Dy na mic E arth Pressur e Cur vatur e
(b) -20 -10 0 10 20 0 3 50 7 00 10 5 0 14 0 0 17 5 0
-0.02 -0.01 0 0.01 0.02
E arth P resure (kP a)
E le va ti o n fr om th e B o tto m S la b ( m m )
C urvatu re (1/m)
D y na m ic E ar th P ressu re
C urv atur e
-20 -10 0 10 20 0 3 50 7 00 10 50 14 00 17 50
-0.02 -0.01 0 0.01 0.0 2
E arth P resure (kPa )
E le v a ti o n fr o m th e B o ttom S la b ( m m ) Curvature (1/m)
Dy na mic E arth Pre ssure Curva tur e
(a) -1 00 -50 0 50 1 00 0 3 50 7 00 10 5 0 14 0 0 17 5 0
-0.05 -0.0 25 0 0.0 25 0.05
E arth P resure (kP a)
E le va ti o n fr om th e B o tto m S la b ( m m )
C urvatu re (1/m)
D y na m ic E ar th P ressu re
C ur vatu re
-1 00 -50 0 50 1 00 0 3 50 7 00 10 50 14 00 17 50
-0.06 -0.03 0 0.03 0.0 6
E arth P resure (kPa )
E le v a ti o n fr o m th e B o ttom S la b ( m m ) Curvature (1/m)
Dy na mic E arth Pressur e Cur vatur e
(b) -1 00 -50 0 50 1 00 0 3 50 7 00 10 5 0 14 0 0 17 5 0
-0.05 -0.0 25 0 0.0 25 0.05
E arth P resure (kP a)
E le va ti o n fr om th e B o tto m S la b ( m m )
C urvatu re (1/m)
D y na m ic E ar th P ressu re
C ur vatu re
-1 00 -50 0 50 1 00 0 3 50 7 00 10 5 0 14 0 0 17 5 0
-0.05 -0.0 25 0 0.0 25 0.05
E arth P resure (kP a)
E le va ti o n fr om th e B o tto m S la b ( m m )
C urvatu re (1/m)
D y na m ic E ar th P ressu re
C ur vatu re
-1 00 -50 0 50 1 00 0 3 50 7 00 10 50 14 00 17 50
-0.06 -0.03 0 0.03 0.0 6
E arth P resure (kPa )
E le v a ti o n fr o m th e B o ttom S la b ( m m ) Curvature (1/m)
Dy na mic E arth Pressur e Cur vatur e
-1 00 -50 0 50 1 00 0 3 50 7 00 10 50 14 00 17 50
-0.06 -0.03 0 0.03 0.0 6
E arth P resure (kPa )
E le v a ti o n fr o m th e B o ttom S la b ( m m ) Curvature (1/m)
Dy na mic E arth Pressur e Cur vatur e
(b) -20 -10 0 10 20 0 3 50 7 00 10 5 0 14 0 0 17 5 0
-0.02 -0.01 0 0.01 0.02
E arth P resure (kP a)
E le va ti o n fr om th e B o tto m S la b ( m m )
C urvatu re (1/m)
D y na m ic E ar th P ressu re
C urv atur e
-20 -10 0 10 20 0 3 50 7 00 10 50 14 00 17 50
-0.02 -0.01 0 0.01 0.0 2
E arth P resure (kPa )
E le v a ti o n fr o m th e B o ttom S la b ( m m ) Curvature (1/m)
Dy na mic E arth Pre ssure Curva tur e
(a) -20 -10 0 10 20 0 3 50 7 00 10 5 0 14 0 0 17 5 0
-0.02 -0.01 0 0.01 0.02
E arth P resure (kP a)
E le va ti o n fr om th e B o tto m S la b ( m m )
C urvatu re (1/m)
D y na m ic E ar th P ressu re
C urv atur e
-20 -10 0 10 20 0 3 50 7 00 10 5 0 14 0 0 17 5 0
-0.02 -0.01 0 0.01 0.02
E arth P resure (kP a)
E le va ti o n fr om th e B o tto m S la b ( m m )
C urvatu re (1/m)
D y na m ic E ar th P ressu re
C urv atur e
-20 -10 0 10 20 0 3 50 7 00 10 50 14 00 17 50
-0.02 -0.01 0 0.01 0.0 2
E arth P resure (kPa )
E le v a ti o n fr o m th e B o ttom S la b ( m m ) Curvature (1/m)
Dy na mic E arth Pre ssure Curva tur e
-20 -10 0 10 20 0 3 50 7 00 10 50 14 00 17 50
-0.02 -0.01 0 0.01 0.0 2
E arth P resure (kPa )
E le v a ti o n fr o m th e B o ttom S la b ( m m ) Curvature (1/m)
Dy na mic E arth Pre ssure Curva tur e
(a) DVG2 EP53 EP13 -80 -40 0 40 80 -20 -10 0 10 20
0 1 2 3 4 5
E P1 3
E P5 3 DV G 2
E a rt h P r e ss u re ( k P a) D isp lacem e n t (m m )
T im e (s)
DVG2 DVG2 EP53 EP13 EP53 EP13 -80 -40 0 40 80 -20 -10 0 10 20
0 1 2 3 4 5
E P1 3
E P5 3 DV G 2
E a rt h P r e ss u re ( k P a) D isp lacem e n t (m m )
Fig. 11 Force Moment on Bottom Slab (a) Fixed Case and (b) Unfixed Case
Fig. 12 Time Histories of Slip, Relative Displacement and Dynamic Earth Pressure
CONCLUDING REMARKS
A large-scale shake table test was conducted to identify some aspects on plastic performance on underground RC structures during a strong ground shaking. Based on these test results, nonlinear ground response, plastic structure deformation and dynamic soil-structure interaction are discussed. Unique nonlinear ground response in the present test can be summarized as significant hysteretic damping and volume change associated with dilatancy effect in large ground strain level. In addition, the latter feature plays a crucial role on the development of the dynamic earth pressure on the model RC structure sidewalls. The relative displacement of the model RC structure clearly represents the degree of plastic deformation. The yield displacement and the ratio of maximum to yielding displacement are measured as 4 mm and 12-13 for Fixed and Unfixed Cases, respectively. Structure deformation is apparently governed by surrounding ground deformation. This observation can be maintained through small to large ground strain. Exclusive nature of respectively the dynamic shear stress and earth pressure on the top slab and the sidewalls are revealed, particularly in plastic deformation stage. Due to the fact that strong dilatancy-induced soil volume change occurs, the dynamic earth pressure on both sidewalls act in a compression manner in spite of cyclic reversed shear deformation of the model RC structure. This force, however, is found to have extremely minor responsibility for the degree of relative displacement. In fact, the shear stress on the top slab plays a major role on structure deformation. This finding may be valid if structure rigidity is relatively small to ground shear modulus. Obvious soil-structure interface nonlinearity, i.e., slip between the top slab and the model ground, is also identified in Unfixed Case. This can be attributed to relatively low overburden pressure associated with shallower embedment condition.
ACKNOWLEDGEMENT
A part of the present work was supported by nine Japanese Power Companies and Japan Atomic Power Company through the Grant for Joint Research Program “Development Study on the Verification Method of Seismic Performance of Underground RC Structures in Nuclear Power Plants”, 1998-1999. The authors are very grateful to permission to present the present paper and fruitful suggestion from the above companies and the committee, which is organized in Japan Society for Civil Engineers headed by Prof. H. Okamura of Kochi Institute of Technology.
-2 00 -1 00 0 1 00 2 00
0 1 2 3 4 5
Sh ear Fo rce E ar th P ressur e (Le ft) E arth P ressu r e (R ight)
Mo
m
e
n
t (
k
N
.m
)
Time (s) (b)
-2 00 -1 00 0 1 00 2 00
0 1 2 3 4 5
Sh ear Fo rc e E ar th P re ssure (L e ft) E arth P ressu re (R igh t)
M
o
m
e
n
t (k
N
.m)
T ime (s) (a)
-2 00 -1 00 0 1 00 2 00
0 1 2 3 4 5
Sh ear Fo rce E ar th P ressur e (Le ft) E arth P ressu r e (R ight)
Mo
m
e
n
t (
k
N
.m
)
Time (s) (b)
-2 00 -1 00 0 1 00 2 00
0 1 2 3 4 5
Sh ear Fo rce E ar th P ressur e (Le ft) E arth P ressu r e (R ight)
Mo
m
e
n
t (
k
N
.m
)
Time (s) -2 00
-1 00 0 1 00 2 00
0 1 2 3 4 5
Sh ear Fo rce E ar th P ressur e (Le ft) E arth P ressu r e (R ight)
Mo
m
e
n
t (
k
N
.m
)
Time (s) (b)
-2 00 -1 00 0 1 00 2 00
0 1 2 3 4 5
Sh ear Fo rc e E ar th P re ssure (L e ft) E arth P ressu re (R igh t)
M
o
m
e
n
t (k
N
.m)
T ime (s) (a)
-2 00 -1 00 0 1 00 2 00
0 1 2 3 4 5
Sh ear Fo rc e E ar th P re ssure (L e ft) E arth P ressu re (R igh t)
M
o
m
e
n
t (k
N
.m)
T ime (s) -2 00
-1 00 0 1 00 2 00
0 1 2 3 4 5
Sh ear Fo rc e E ar th P re ssure (L e ft) E arth P ressu re (R igh t)
M
o
m
e
n
t (k
N
.m)
T ime (s) (a)
-60 -30 0 30 60
-60 -30 0 30 60
0 1 2 3 4 5
R elative D isp . S lip (W S42N )
E ar th P re ssu r e (EP 15 )
Di
sp
la
c
e
m
e
n
t (
m
m)
E
a
r
th
P
r
ess
u
re (
k
P
a
)
T im e (s)
EP15 WS42N
-60 -30 0 30 60
-60 -30 0 30 60
0 1 2 3 4 5
R elative D isp . S lip (W S42N )
E ar th P re ssu r e (EP 15 )
Di
sp
la
c
e
m
e
n
t (
m
m)
E
a
r
th
P
r
ess
u
re (
k
P
a
)
T im e (s)
EP15 WS42N
REFFERENCES
1. Honda, K., Adachi, M., Ishikawa, H. and Hasegawa, T., “Experimental Study on Deformational Property of Box Culvert Subjected to Lateral Load”, Proceedings of the Japan Concrete Institute Vol.21, No.3, 1999, pp.1261-1266.
2. Aoyagi, Y., Endoh, T. and Katahira, F., “Experimental Study on Soil-Structure Interaction of Underground Reinforced Concrete Ducts Subjected to Earthquake Loading”, SMiRT 11 Transaction, Vol. K, 1991, pp.387-392.