Copyright1998 by the Genetics Society of America
Sequence-Tagged-Site (STS) Markers of Arbitrary Genes: Development,
Characterization and Analysis of Linkage in Black Spruce
Daniel J. Perry and Jean Bousquet
Centre de Recherche en Biologie Forestie`re, Universite´ Laval, Ste-Foy, Que´bec, Canada G1K 7P4
Manuscript received November 11, 1997 Accepted for publication February 23, 1998
ABSTRACT
Sequence-tagged-site (STS) markers of arbitrary genes were investigated in black spruce [Picea mariana (Mill.) B.S.P.]. Thirty-nine pairs of PCR primers were used to screen diverse panels of haploid and diploid DNAs for variation that could be detected by standard agarose gel electrophoresis without further manipulation of amplification products. Codominant length polymorphisms were revealed at 15 loci. Three of these loci also had null amplification alleles as did 3 other loci that had no apparent product-length variation. Dominant product-length polymorphisms were observed at 2 other loci. Alleles of codominant markers differed in size by as little as 1 bp to as much as an estimated 175 bp with nearly all insertions/ deletions found in noncoding regions. Polymorphisms at 3 loci involved large (33 bp to at least 114 bp) direct repeats and similar repeats were found in 7 of 51 cDNAs sequenced. Allelic segregation was in accordance with Mendelian inheritance and linkage was detected for 5 of 63 pairwise combinations of loci tested. Codominant STS markers of 12 loci revealed an average heterozygosity of 0.26 and an average of 2.8 alleles in a range-wide sample of 22 trees.
O
UR ability to evaluate genetic parameters in indi- in a few conifer species (Echt et al. 1996; Pfeiffer et al. 1997; Smith and Devey1994; van de Ven and viduals or populations is directly related to ourability to detect polymorphisms at multiple genetic loci. McNicol1996). The assessment of allelic variation of SSR markers often requires high resolution, labor inten-Currently, several molecular marker technologies are
available to reveal variation in nuclear genomes. Mark- sive techniques such as polyacrylimide gel electrophore-sis followed by silver staining. Also, a high mutation rate, ers based on the polymerase chain reaction (PCR) are
attractive because they may be essentially unlimited in including backward mutations, and a limited range of SSR allele sizes may have a homogenizing effect, limiting numbers and require mere nanogram quantities of
DNA, permitting analysis of single megagametophytes the potential for divergence of SSR loci among popula-tions (Nauta andWeissing1996).
and embryos in conifers (Bousquet et al. 1990).
Of PCR-based markers, random amplified polymor- We are considering different approaches for ob-taining PCR-based markers in black spruce [Picea mari-phic DNAs (RAPDs; Welsh and McClelland 1990;
Williams et al. 1990) and simple sequence repeats ana (Mill.) B.S.P.]. In this paper, we investigate se-quence-tagged-site (STS) markers having polymor-(SSRs, also known as microsatellites; Tautz 1989;
Weber andMay1989) have received much attention. phisms that may be observed without manipulation of amplified products. Such markers combine the techni-RAPDs are simple to develop, but equally migrating
amplification products from different individuals (or cal simplicity of RAPDs with the specificity of SSRs and, as we demonstrate, they may often be codominant. In species) may not represent the same locus, making it
difficult to compare or combine linkage maps. In popu- addition to designing STS primers for black spruce genes, we characterize observed polymorphisms at the lation studies, the dominant nature of RAPDs can be
problematic; estimates of population genetic parame- DNA sequence level and examine allelic segregation in megagametophyte arrays of individual trees, confirming ters may be unreliable if RAPDs are surveyed in diploid
material (Isabelet al. 1995; Szmidtet al. 1996). Mendelian inheritance and in a few instances demon-strating linkage between locus pairs.
SSR markers represent single specific loci and are often highly variable with multiple codominant alleles, but their development is rather complex, often
requir-MATERIALS AND METHODS ing enrichment cloning steps. Nonetheless, primer
se-quences are now available for some nuclear SSR markers
cDNA sequencing:The black spruce cDNA library (provided byB. Rutledge, Natural Resources Canada) derived from an
embryonic cell culture of a single diploid genotype. Reverse transcription had been initiated with a NotI primer-adapter
Corresponding author: Daniel J. Perry, Centre de Recherche en
Biolo-(59AATTCGCGGCCGC(T)15), facilitating the inclusion of the
gie Forestie`re, Pavillon Charles-Euge`ne-Marchand, Universite´ Laval,
Ste-Foy, PQ, G1K 7P4 Canada. E-mail: [email protected] 39-untranslated region (UTR) and directional cloning into
lgt22A. We plated the library with Escherichia coli Y1090 (Pro- haploid panel consisted of one megagametophyte from each of the 22 provenances, usually from the same trees included mega, Madison, WI) following standard procedures.
Arbi-on the diploid panel. Seedcoats and embryos were removed trarily selected plaques were each transferred to 1 ml of SM
and DNA isolation from individual megagametophytes fol-buffer (Sambrooket al. 1989) containing one drop of
chloro-lowed Bousquet et al. (1990) modified to include a
phe-form. Inserts were amplified directly using primers GT11-F
nol:chloroform:isoamyl alcohol (25:24:1) extraction and pre-(59ATTGGTGGCGACGACTCCTGGAG) and GT11-R (59CAG
cipitation with ethanol. About 1–5 ng DNA was used per 15 ACCAACTGGTAATGGTAGCG) in PCRs containing 0.1mm
ml PCR. Amplification products were subjected to electropho-each primer, 0.2 mmeach dNTP, 1ml of a plaque suspension
resis through thin (3 mm) gels (1.2 or 2% agarose in TAE, (in a 50 ml reaction), 0.025 units/ml Taq DNA polymerase
see results) followed by ethidium bromide staining. (Pharmacia Biotech Inc., Piscataway, NJ) and 13of the
sup-Marker segregation analyses:Polymorphic markers were ex-plied reaction buffer (included 1.5 mmMgCl
2). PCR was
car-amined in 22 to 30 megagametophytes from each heterozygote ried out for 35 cycles (948, 1 min; 558, 1 min; 728, 2 min)
among 11 individuals that were a subset of the provenance followed by 10 min at 728in a DNA Thermal Cycler
(Perkin-trees. For each locus, goodness-of-fit to a 1:1 ratio of alternate Elmer, Norwalk, CT). Products were examined by gel
electro-alleles was tested using a G-test (SokalandRohlf1981). In
phoresis (1.2% agarose in TAE) and ethidium bromide staining.
the absence of heterogeneity, data of heterozygotes with like cDNAs were candidates for sequencing if a single product
alleles were pooled. of size 600 to 1350 bp was present in the insert amplification.
Linkage was examined between pairwise combinations of Sequencing templates were PCR-amplified as above, purified
loci using a method equivalent to the double backcross (
Bai-using a QIAquick PCR purification kit (QIAGEN, Chatsworth,
ley1961;Narain1990). This involved the calculation of three
CA) and, starting with primer GT11-F, sequenced using
di-x2statistics; two for testing segregation at individual loci (x2 A
deoxy dye terminator cycle sequencing analyzed on a
Perkin-andx2
B) and the third for testing linkage (x2L). When data were
Elmer-ABI model 373 automated DNA sequencer. With larger
available from more than one double-heterozygote for a pair-inserts of more than 600 bp, a second sequencing run was
wise combination, heterogeneityx2’s were obtained following
initiated from a clone-specific internal primer that was chosen Narain (1990). If heterogeneity was found for the linkage such that its position would also allow it to be used as a forward component, tests for linkage were conducted using individual amplification primer (see below). The deduced amino acid tree data. Otherwise, data were pooled. For each pair of loci sequences of cDNAs were compared to the nonredundant demonstrating linkage, the recombination frequency (y) and protein sequence databases using BLASTX (Altschulet al.
its standard error (SEy) were estimated following Bailey
1990) accessed at the National Center for Biotechnology In- (1961). The possibility of heterogeneous recombination fre-formation/BLAST server (http://www.ncbi.nlm.nih.gov/cgi- quencies among trees was also investigated using a x2 test
bin/BLAST/nph-blast). When BLASTX results were negative, (AdamsandJoly1980).
BLASTN was used to compare the insert sequences with the Genomic sequences of alternative alleles:Sequencing tem-nonredundant nucleotide sequence databases. We also exam- plates of individual alleles were amplified from single megaga-ined the cDNA sequences for the presence of large repeats metophytes and purified using QIAquick PCR or gel purifica-using the program REPEAT of the Genetics Computer Group tion kits (QIAGEN). Sequencing was from the same forward
(GCG) Wisconsin Package v8.1 (Devereuxet al. 1984).
primer used for template amplification. Allelic sequences were Selection and testing of amplification primers: For each aligned manually.
sequenced cDNA, our aim was to select a reverse primer in Production of synthetic heterozygotes:Amplification prod-the presumed 39-UTR and a forward primer about 350 to 600 ucts of heterozygote genotypes that were not represented in bp upstream within the coding region. Occasionally, possible the panel of provenance trees were simulated by template intron locations were identified by examining genomic se- mixing. Approximately 0.25 ng of each of two allelic sequenc-quences of similar plant genes that were found in BLASTX ing templates were combined and amplified by PCR. Alterna-searches and, when possible, the forward primer was located tively, approximately equal quantities of allelic products from such that the predicted amplification product would include separate PCRs of haploid megagametophyte DNAs were com-one or two introns. Typically, 21 mers with G1C contents bined and subjected to five additional thermal cycles as used near 50%, minimal secondary structure and no significant in amplification. The validity of these procedures was con-inter-primer complementarity were selected. firmed by constructing several synthetic heterozygotes corre-sponding to genotypes for which comparison with true hetero-The performance of primer pairs was tested in
amplifica-zygotes was possible. tions of the original plaque suspension and of genomic DNA
of the same genotype from which the cDNA library was cloned (reference DNA). Genomic amplifications were conducted
using 50 ng of reference DNA in 15 ml reaction mixtures RESULTS having the same composition as that used for cDNA templates
above. All PCR of genomic templates was carried out for 40 Characterization of cDNAs:Upon examination of am-cycles (948, 1 min; 558, 2 min; 728, 3 min) followed by 10 min plification products of each of 100 plaques, 71 cDNA at 728. The ramp time to annealing and extension tempera- clones satisfied the requirements for sequencing. Of tures was 4 sec/degree.
these, 51 were sequenced. With one exception (SB66), Screening of DNA panels for polymorphism:Primer pairs
sequencing was full length. that performed satisfactorily in initial tests were used to screen
Many (78%) of the sequenced cDNAs encoded prod-range-wide haploid and diploid panels of black spruce DNAs.
The diploid panel (provenance trees) consisted of one tree ucts similar to those of genes previously characterized from each of 22 provenances distributed across the species in other organisms (Table 1). Of the 11 sequences that range. Needle samples were collected near Quebec City in a did not produce positive BLASTX results, two (SB07 provenance test established in 1975 (Beaulieuet al. 1989).
and SB08) shared about 70% nucleotide identity with DNA was extracted from 50–75 mg of needles following
Bous-Arabidopsis thaliana sequences in the GenBank
ex-quetet al. (1990) with an additional chloroform extraction.
pressed sequence tag (EST) division (accessions ATT-About 50 ng of this DNA was used per 15ml PCR with reaction
TABLE 1
Black spruce cDNAs with similarity to known genes of other organisms
Source organism and Amino acid
Clone Putative identification GenBank accession no. identity
SB01 Aquaporin Spinacia oleracea L77969 83 (264)
SB06 Acyl-CoA oxidase homolog Phalaenopsis sp. U66299 73 (223)
SB09 Thioredoxin Nicotiana tabacum X58527 58 (115)
SB11 Ribosomal protein L15 Rattus norvegicus X78167 68 (204)
SB12 Nucleolysin TIA-1 Homo sapiens M77142 51 (49)
SB13 DNA-binding protein CROC-1B Homo sapiens U39361 49 (136)
SB14 NADH-glutamate synthase Medicago sativa L01660 74 (147)
SB15 Calcium dependent protein kinase Vigna radiata U08140 82 (264)
SB16 Ribosomal protein L13a Cyanophora paradoxa Y09971 68 (177)
SB18 Glutathione S-transferase Nicotiana tabacum X56266 53 (139)
SB21 Fibrillarin Schizosaccharomyces pombe X69930 75 (236)
SB23 Ribosomal protein S15 Arabidopsis thaliana Z23161 89 (139)
SB25 Protein kinase Spinacia oleracea Z30332 52 (98)
SB29 ATAF1 Arabidopsis thaliana X74755 65 (46)
SB30 Rac-like protein Arabidopsis thaliana U43501 85 (198)
SB31 Actin Striga asiatica S68003 100 (53)
SB32 Mitotic cyclin (S13-7) Glycine max X62303 59 (224)
SB34 Regulatory protein preg Neurospora crassa L07314 42 (117)
SB35 GASA5 Arabidopsis thaliana U53221 76 (72)
SB38 Ribosomal protein L17 Nicotiana tabacum L18915 96 (133)
SB40 Heat shock protein 82 Oryza sativa Z11920 89 (196)
SB41 Mitochondrial import site protein ISP42 Saccharomyces cerevisiae X56885 36 (60)
SB42 Ribosomal protein L31 Nicotiana glutinosa U23784 78 (120)
SB46 KIAA0107 Homo sapiens D14663 58 (232)
SB48 BTF3-like transcription factor Nicotiana plumbaginifolia Y09106 56 (111)
SB49 YGL010w Saccharomyces cerevisiae Z72532 54 (53)
SB50 C01F1.3 Caenorhabditis elegans U58761 26 (129)
SB51 Ribosomal protein L3 Oryza sativa D12630 88 (86)
SB52 Glutathione S-transferase Nicotiana tabacum X56266 50 (148) SB53 Ubiquitin-activating enzyme 2 Arabidopsis thaliana U40566 44 (49) SB55 Ubiquitin-conjugating enzyme Saccharomyces cerevisiae U18839 51 (152) SB56 Phosphoglycerate kinase (cytosolic) Nicotiana tabacum Z48976 89 (146)
SB58 Ribosomal protein L5 Solanum melongena AB001583 62 (88)
SB62 Ribosomal protein L15 Rattus norvegicus X78167 68 (204)
SB65 Proteasome subunit HsC10-II Homo sapiens D26598 62 (112)
SB66 Defender against cell death 1 homolog Malus domestica U68560 82 (113) SB67 Late embryogenesis abundant protein Picea glauca L47117 45 (77) SB68 Pyruvate dehydrogenase E1 beta subunit Synechocystis sp. D90906 75 (285) SB71 TAT-binding protein homolog TBP10 Dictyostelium discoideum L16579 83 (175)
SB72 Ribosomal protein L27A Arabidopsis thaliana X91959 78 (56)
Putative identification was determined from the highest scoring BLASTX alignment. Amino acid identity shows the percentage of identical amino acids, with the length of the alignment in parentheses.
(SB18 and SB52; Sb11 and SB62) encoded similar prod- acids (a.a.), and no 39-UTR. And, a BLASTX search with the SB25 sequence suggested similarity to a protein ucts. These pairs had 83.2% and 81.3% nucleotide
iden-tities, respectively, within protein coding regions, but kinase, but the similarity existed in what we inferred to be the 39-UTR of SB25. This may reflect a rearrange-their 39-UTRs appeared completely divergent. All
re-maining cDNAs were unique. ment, perhaps a cloning artifact.
Selection and testing of amplification primers: Ampli-Large (38 bp to 106 bp) direct repeats were found in
noncoding regions of seven cDNAs (SB06, SB08, SB13, fication primers were selected for each of the sequenced cDNAs, excepting SB40 owing to its lack of 39-UTR se-SB24, SB42, SB49 and SB52). In SB13 and SB52, repeat
elements were notably decayed (about 85% identity). quence. All 50 primer pairs produced cleanly amplified products of predicted sizes from corresponding plaque A 38 bp direct repeat in SB08 was itself interrupted by
another of 24 bp. suspensions. Based upon amplification trials using
refer-ence genomic DNA, 39 pairs (78%) were judged suitable Two other peculiarities were noted. SB40 consisted
pairs did not reveal polymorphism. With SB41 primers, a Sb21-473 and Sb21-474 will be required in population studies if electrophoretic conditions are similar to ours. double-banded pattern was obtained for some trees, but
The DNA sequences of all observed allelic products single invariant products were amplified from
megaga-were determined for each of these loci except Sb01. Of metophytes of those trees. We did not investigate this
the codominant markers, the amplification products of putative locus further. Markers generated using the
re-Sb01 were the largest and, with five alleles and an ob-maining 20 primer pairs could be classified into four
served heterozygosity of 0.77 among the range-wide general groups based on the types of polymorphisms
panel of 22 trees, they were also the most variable. We revealed: (1) those with null amplification alleles, but
inferred that the Sb01 polymorphisms were likely within no length variants evident (three loci); (2) loci with
an intron corresponding to intron 2 of the three introns null alleles and length variants (three loci); (3) loci at
in similar plant genes (GuerreroandCrossland1993; which only codominant, length variants were observed
Kaldenhoffet al. 1993). Amplification using a reverse (12 loci); and (4) markers revealing dominant, length
primer within the coding region (SB01-Rb) and the polymorphisms (two loci).
original forward primer (SB01-F) was adopted because Loci with null amplification alleles:Null amplification
it excluded the apparently invariant intron 3 and down-alleles were apparent at six loci (Sb16, Sb17, Sb18, Sb52,
stream sequence, thereby shortening product lengths Sb53 and Sb66). Segregation of null alleles appeared
by about 400 bp and improving resolution of alleles. consistent with the expected 1:1 ratio but replication
DNA sequencing revealed that most of the remaining of results was at times problematic. In some trials, alleles
polymorphisms were due to one or more small (#15 first characterized as null were better described as low
bp) insertions/deletions in introns (Sb07, Sb11, Sb31, amplification alleles and occasionally, a range of
prod-Sb62), the 39-UTR (Sb70, Sb72) or both (Sb08, Sb21). uct concentrations was present. Also, the
misclassifica-Two markers are noteworthy because the observed poly-tion of occasional failed reacpoly-tions as nulls became
evi-morphisms involved large tandem direct repeats of dent upon repetition.
39-UTR sequences. At Sb06, the common allele (Sb06-Three of these loci (Sb17, Sb18 and Sb52) also had
539) had two copies of a 70 bp element where Sb06-609 codominant length polymorphisms that segregated in
had three. At Sb24, the two observed alleles differed by accordance with a 1:1 ratio among megagametophytes
the presence or absence of a 33 bp repeat. Polymor-of heterozygous trees. Differences in sizes Polymor-of alleles at
phisms at Sb29 were unique in that they were located these loci were small, likely less than 5 bp in most cases.
within the protein coding sequence. Relative to the com-Since the presence of null alleles would limit their
po-mon allele (Sb29-574), the Sb29-553 product would have tential value as markers in population studies, they were
a deletion of 7 a.a. and the Sb29-580 product would not characterized further. Codominant alleles were
ini-have an insertion of 2 a.a. tially suspected at Sb66 too, because amplification of
Without exception, segregation of alleles among diploid DNAs of some trees resulted in the production
megagametophytes from heterozygous trees was consis-of additional bands consistent with heteroduplex
prod-tent with the expected 1:1 ratio indicative of Mendelian ucts. However, no length variation was detected among inheritance. In the range-wide sample of 22 trees, these products from corresponding megagametophyte DNAs. 12 loci showed an average observed heterozygosity (H
o)
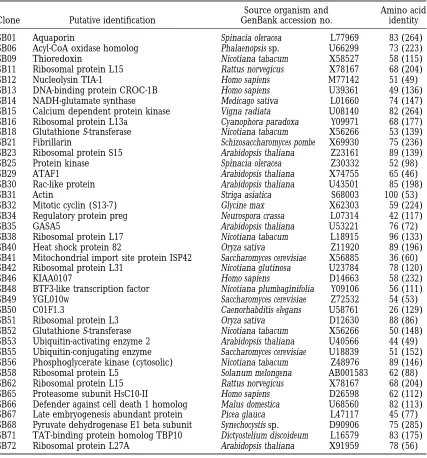
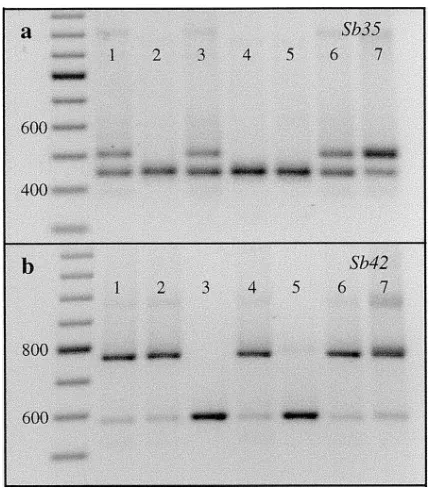
Loci at which all observed polymorphisms were co- of 0.26 and an average of 2.8 alleles (Table 2). dominant:Codominant markers were obtained for 12 Markers with dominant length polymorphisms: Am-loci at which there was no evidence of null alleles (Fig- plification of Sb35 from diploid DNA of provenance ure 1). All were resolved on 2% agarose gels excepting trees produced either a single band of 440 bp or a 440 Sb01 for which 1.2% gels were used. Size differences bp product and a 496 bp product. This two-banded among alleles ranged from 1 bp to an estimated 175 bp. phenotype behaved in a dominant manner (Figure 2a). The presence of slower migrating heteroduplex DNA We sequenced both products amplified from a single made it possible to detect heterozygotes on the diploid megagametophyte and found the 496 bp product to panel using short gels (10 cm), even when differences be identical to the 440 bp product except that it was in sizes among alleles were small. But, when alleles dif- extended by 56 bp of sequence that was composed of fered in length by less than 10 bp, and for Sb01, long 35 bp of additional 39-UTR sequence (as seen in cDNA gels (22 cm) were necessary to assess allelic segregation SB35) plus the 21 bp of primer SB35-R. There was no among megagametophytes and to assign diploid geno- sequence at this location in cDNA SB35 bearing any types with confidence. Genotypes of Sb21 were the least resemblance to a SB35-R priming site and it is not clear resolved of these 12 loci. Three alleles could be distin- how the alleles differed such that priming also occurred guished in homozygotes or haploid megagametophytes, at this distal site in some genotypes.
Figure1.—Codominant sequence-tagged-site (STS) markers of black spruce genes. Polymorphisms were observed on ethidium
bromide-stained agarose gels without further manipulation of amplification products. Negative images are shown. Size markers (left-hand lanes) are fragments of a 100-bp ladder (Pharmacia). Lanes with numbers marked by asterisks contain synthetic heterozygote products representing genotypes not found on the provenance tree panel (see materials and methods). (a)
Lanes 1–5, genotypes Sb01-1930/2075, Sb01-1930/2010, Sb01-1930/1960, Sb01-1930/1930 and Sb01-1900/1930. (b) Allelic segrega-tion among eight megagametophytes of an Sb01-1900/2075 heterozygote. (c) Lanes 1 and 2, alleles Sb06-539 and Sb06-609 ; lane 3 an Sb06-539/609 heterozygote. (d) Lanes 1–4, alternating alleles Sb07-648 and Sb07-645; lane 5, an Sb07-645/648 heterozygote. (e) Lanes 1–4, alleles 634, 645, 646 and 653; lanes 5–10, heterozygotes 634/645, 634/646,
Sb08-634/653, Sb08-645/646, Sb08-645/653 and Sb08-646/653. (f) Lanes 1–4, alternating alleles Sb11-695 and Sb11-691; lane 5, an Sb11-691/695 heterozygote. (g) Lanes 1–3, alleles 474, 473 and 471; lanes 4–6, heterozygotes 473/474, Sb21-471/474 and Sb21-471/473. (h) Lanes 1 and 2, alleles Sb24-738 and Sb24-771; lane 3 an Sb24-738/771 heterozygote. (i) Lanes
1–3, alleles Sb29-553, Sb29-574 and Sb29-580 ; lanes 4–6, heterozygotes Sb29-553/574, Sb29-553/580 and Sb29-574/580 . (j) Lanes 1 and 2, alleles Sb31-449 and Sb31-439 ; lane 3 an Sb31-439/449 heterozygote. (k) Lanes 1–3, alleles 417, 410 and
Sb70-404; lanes 4–6, heterozygotes Sb70-410/417, Sb70-404/417 and Sb70-404/410. (l) Lanes 1–4, alleles Sb62-681, Sb62-689, Sb62-691
and Sb62-706; lanes 5–10, heterozygotes Sb62-681/689, Sb62-681/691, Sb62-681/706, Sb62-689/691, Sb62-689/706 and Sb62-691/
TABLE 2
Allelic length polymorphisms observed at 12 codominant STS loci in black spruce
Locus Putative identification Allele frequenciesa Observed heterozygosity
Sb01 Aquaporin 0.34, 0.45, 0.05, 0.11, 0.05 0.77
Sb06 Acyl-CoA oxidase homolog 0.95, 0.05 0.09
Sb07 unknown 0.02, 0.98 0.05
Ab08 unknown 0.05, 0.27, 0.55, 0.14 0.59
Sb11 Ribosomal protein L15 0.11, 0.89 0.23
Sb21 Fibrillarin 0.18, 0.82b 0.18
Sb24 unknown 0.84, 0.16 0.32
Sb29 ATAF1 0.14, 0.84, 0.02 0.23
Sb31 Actin 0.11, 0.89 0.23
Sb62 Ribosomal protein L15 0.80, 0.05, 0.07, 0.09 0.32
Sb70 unknown 0.02, 0.02, 0.95 0.09
Sb72 Ribosomal protein L27A 0.02, 0.98 0.05
Putative identification refers to gene products identified in BLASTX searches (Table 1). Polymorphisms were directly observed on agarose gels without further manipulation of amplification products. Estimates of allele frequencies and observed heterozygosities are based on a range-wide sample of 22 black spruce trees.
aAlleles are listed in order of increasing sizes (see Figure 1). bAlleles Sb21-473 and Sb21-474 were pooled (seeresults).
ers were positioned to include a large (106 bp) repeat 766 had an additional large direct repeat of at least 114 found in cDNA SB42, but the structure of this repeat bp that included the SB42-R primer site. Although the did not vary among the allelic products. Rather, Sb42- first element of this additional repeat had a site exactly complementary to SB42-R, amplification from the distal site was favored. The distal site was either not present or was not favored in amplifications of the common allele (Sb42-582). The mechanism of suppression of am-plification from the proximal site in heterozygotes is unknown.
Analysis of linkage:All codominant markers and the dominant markers of Sb35 and Sb42 (a total of 17 loci) were included in the analysis of linkage. We examined 63 of 136 possible two-locus combinations; five were indicative of linkage (Table 3) with no heterogeneity of recombination frequencies detected among trees. It may be appropriate to exclude one member of linked pairs in analyses that require an assumption of indepen-dence among loci, retaining those having higher hetero-zygosities. However, the results for the Sb07/Sb62 and
TABLE 3
Linkage of STS markers of black spruce genes
Sample sizes
Figure2.—Segregation of dominant length polymorphisms
Loci Trees Megagametophytes y SEy
of sequence-tagged-site (STS) markers among
megagameto-phytes of heterozygous trees. Polymorphisms were observed Sb01/Sb06 2 46 0.17 0.06 on ethidium bromide-stained agarose gels without further ma- Sb01/Sb29 3 76 0.28 0.05 nipulation of amplification products. Negative images are Sb07/Sb62 1 23 0.26 0.09 shown. Size markers (left-hand lanes) are fragments of a 100 Sb11/Sb24 1 30 0.23 0.08 bp ladder (Pharmacia). (a) Lanes 1–6, segregation of alleles Sb11/Sb62 2 60 0.33 0.06
Sb35-440 and Sb35-440&496 among six megagametophytes of
an Sb35-440/440&496 heterozygote (lane 7). (b) Lanes 1–6, Estimates of recombination frequencies (y) and standard errors (SEy) are given for pairs of loci for which significant segregation of alleles Sb42-582 and Sb42-766 among six
Sb11/Sb24 combinations should be viewed as tentative cases where interspecific crosses have been used to cre-ate presumably highly heterozygous mapping popula-because only one doubly heterozygous tree was available
for each. tions, the amount of length polymorphism has
re-mained low (Bradshaw et al. 1994; Slabaugh et al. 1997).
DISCUSSION
Polymorphisms, and length polymophisms in particu-lar, are most likely to occur in noncoding regions. Allelic variation that can be detected directly on
aga-rose gels without additional manipulation of PCR prod- Therefore, when possible intron locations were identi-fied based upon similar gene sequences in other plants, ucts is reasonably common among STS markers of black
spruce genes. Out of 39 markers screened, 12 showed we placed the amplification primers such that one or two introns would be included in genomic products. codominant length polymorphisms suitable for use in
population studies. Codominant markers were also To ensure that noncoding DNA was included even if no introns were present, reverse amplification primers found for three additional loci, but these are less suited
to population studies owing to the presence of null were placed in the 39-UTR. This strategy was also in-tended to increase specificity when primers were based alleles which could cause erroneous heterozygosity
esti-mates. However, these three markers and dominant upon one member of a gene family, a concern of partic-ular importance in conifers where large gene families length polymorphisms identified at two additional loci
should be well suited to applications such as genome are common (Ahuja et al. 1994; Kinlaw et al. 1994; Perry and Furnier 1996). Our results indicate that mapping.
Most (78%) of the black spruce cDNAs sequenced very similar members of a gene family are generally sufficiently divergent in their 39-UTRs that PCR can be here were similar to previously characterized genes. This
high number probably reflects the fact that we made directed toward single genes.
In addition to large gene families, another interesting no effort to avoid abundantly expressed messages that
are more likely to be already represented in sequence feature of conifer genomes is an abundance of large tandem direct repeats. Large repeats are common in databases. To obtain markers of a wider variety of types
of genes, techniques such as cold-plaque screening noncoding regions of jack pine (Pinus banksiana) alco-hol dehydrogenase (Adh) genes (Perryand Furnier (Hodgeet al. 1992) could be used to identify clones of
rarely expressed mRNAs. Markers could also be tailored 1996) and, in that same study, similar repeats were iden-tified in five of seven genomic sequences of conifer to represent different classes of genes by using libraries
derived from specific tissues, developmental stages, or genes found in GenBank. In the present study, large direct repeats ranging in size from 38 to 106 bp were environmental treatments. Also, for some species, an
increasingly large variety of precharacterized sequences found in seven of 51 cDNAs. Considering the smaller noncoding component of cDNAs, it is not unexpected are becoming available in publicly accessible databases.
STS markers have been developed in other plants that this frequency is lower than that reported for geno-mic gene sequences.
(Bradshawet al. 1994;Ghareyazieet al. 1995;Talbert
et al. 1994; Tragoonrung et al. 1992) including the In codominant STS markers of three Adh loci in jack pine (PerryandFurnier1996), alleles differed by the conifer Cryptomeria japonica (Tsumura et al. 1997). In
general, the proportion of directly observable length presence or absence of large repeats. With this in mind, when a large repeat was present in a black spruce cDNA, polymorphisms has been low and digestion of
amplifi-cation products with restriction enzymes (PCR-RFLP) PCR primers were positioned, when possible, to include the repeat in the amplified products. In one case (Sb06), has routinely been used. Also, the source of sequence
information for previous STS marker development has this strategy was successful and resulted in a codominant marker with alleles differing in size by 70 bp. However, often been genomic clones rather than cDNAs.
How-ever, there are scattered reports of allelic length poly- the polymorphism was not due to the presence or ab-sence of the repeat as anticipated, rather, alleles differed morphisms of plant genes (Bradshawet al. 1994;Davis
andYu1997;PerryandFurnier1996;Tragoonrung by having either a duplication or a triplication of the sequence. In both other cases where primers were posi-et al. 1992). A low frequency of directly observable
length polymorphism may be a reflection of the screen- tioned to flank a large repeat in the cDNA (Sb24 and Sb42), polymorphisms were found but they involved ad-ing panels that have been used; small panels, or panels
with a restricted genetic base, may have encompassed ditional large repeats rather than the elements origi-nally targeted. The presence of the targeted repeats little of the total genetic diversity. When 15 pairs of STS
primers were screened against a diverse panel of 40 was apparently fixed. As illustrated by Sb42, additional repeats may lead to unpredictable results, including rice varieties, six (40%) revealed length polymorphisms
(Ghareyazieet al. 1995), a proportion similar to that dominant length polymorphisms when a primer site is duplicated.
found here for black spruce (15/39, 38%), suggesting
volved large repeated sequences. The remainder were STS markers may be useful when incorporated into based on relatively small insertions or deletions with net linkage maps. Placement of known genes on maps differences among alleles ranging from 1 bp to 27 bp. would add to our knowledge of conifer genome organi-In nearly all cases, each possible heterozygote could zation and assist in combining maps from different indi-be identified unambiguously, even when differences viduals. Although RAPD-based maps are commonly con-among alleles were small. Sb21 was an exception where structed for conifers, it is often difficult to use the same pooling of alleles may be necessary. In many cases, classi- RAPD markers in different trees (Deveyet al. 1995). fication of heterozygous genotypes was simplified by the Plomionet al. (1995) have suggested the use of protein presence of genotype-specific heteroduplex bands. For polymorphisms revealed by 2-D electrophoresis to aid example, the alleles Sb62-689 and Sb62-691 were very in establishing the correspondence of RAPD linkage similar in size, but Sb62-681/689 and Sb62-681/691 het- groups among trees. STS markers may be a more conve-erozygotes were readily discriminated by their distinc- nient choice for this purpose since they use the same tive heteroduplex products (Figure 1l). Moreover, we technology as RAPDs and gene identifications may be have demonstrated that it is possible to predict the het- more easily determined. However, owing to relatively eroduplex banding patterns of hitherto unseen geno- low levels of heterozygosity, few of the markers described types by construction of synthetic heterozygotes via tem- here are likely to be shared among maps if mapped plate mixing. In some cases, template mixing may also individuals are selected arbitrarily with respect to these be a useful tool to ensure that rare homozygotes are loci. Our efforts were focused on a low sensitivity screen-properly identified when the possible genotypes would ing of an extensive sampling of genes in a diverse panel give products of similar size, e.g., Sb62-689/689 and Sb62- of individuals. More sensitive (and more laborious) de-691/691, and, owing to their low frequencies, examples tection techniques, e.g., PCR-RFLP or single-strand con-of both are not available for direct comparison. formation polymorphism, may be warranted for some With codominant length polymorphisms revealed by applications such as genome mapping. Primer pairs pro-15 of a total of 50 pairs of primers synthesized, our ducing products that appear monomorphic under cur-overall success rate may be similar to that of finding rent conditions may be a valuable resource in such en-SSR polymorphisms in conifers. An intensive effort to deavors.
develop SSR markers has been directed toward eastern The codominant STS markers developed here pro-white pine (Pinus strobus;Echtet al. 1996). Primer pairs
vide an additional means to explore natural genetic were selected from 77 SSR containing clones and of variation in black spruce populations. It remains to be those, 16 pairs amplified well and revealed polymor- determined to what extent these primers can be used in phisms in a panel of 16 trees. A similar success rate has other spruces and conifers. Preliminary results indicate been reported for SSR marker development in Norway that primers producing invariant products in black spruce (Picea abies), with 7 of 36 primer pairs amplifying spruce may reveal polymorphisms in related species. single polymorphic loci (Pfeifferet al. 1997). An overall
Clearly, the wider the range of taxa in which primers success rate similar to that for developing SSR markers are useful, the more attractive future STS marker devel-is perhaps unexpected since, unlike SSR markers, STS opment will be.
markers do not target specific sequences that are
ex-B. Rutledge (Natural Resources Canada) kindly provided the
pected to promote polymorphism. Therefore, they do cDNA library,
J. BeaulieuandN. Isabel(Natural Resources Canada)
not entail the added effort and expense of isolating and provided seeds,F. LarochelleandM. Perronhelped with tissue
identifying regions containing such sequences. collections, andD. Fournier, I. Gamache, G. PelletierandP. Perry
provided much assistance in the laboratory. This work was supported
However, SSR markers will likely surpass STS markers
by grants to J.B. from Fonds pour la Formation de Chercheurs et
having directly observed polymorphisms in terms of
het-l’Aide a` la Recherche of Que´bec, Natural Sciences and Engineering
erozygosity and numbers of alleles per locus. Average
Research Council of Canada and Network of Centres of Excellence
heterozygosities of 0.515 and 0.79, and averages of 5.4 in Sustainable Forest Management. The sequences reported in this and 13 alleles per locus were reported for the polymor- article have been deposited in the GenBank database (accession nos.
AF051202–AF051252 and AF051733–AF051765).
phic SSR markers in 16 white pine and 18 Norway spruce, respectively (Echt et al. 1996; Pfeiffer et al. 1997), compared to an observed heterozygosity of 0.26 and 2.8 alleles per locus for codominant STS markers
LITERATURE CITED in 22 black spruce. The amount of variation revealed
Adams, W. T., andR. J. Joly, 1980 Linkage relationships among
by these STS markers appears more in line with that of
twelve allozyme loci in loblolly pine. J. Hered. 71: 199–202.
RAPD and allozyme loci in black spruce (Boyle and
Ahuja, M. R., M. E. Devey, A. T. Groover, K. D. Jermstad and
Morgenstern 1987; Isabelet al. 1995). As with SSR D. B. Neale, 1994 Mapped DNA probes from loblolly pine can
be used for restriction fragment length polymorphism mapping
markers, the total information per PCR may be
in-in other conifers. Theor. Appl. Genet. 88: 279–282.
creased by multiplexing. Indeed, we have conducted
Altschul, S. F., W. Gish, W. Miller, E. W. MyersandD. J. Lipman,
successful trials employing several two-set combinations 1990 Basic local alignment search tool. J. Mol. Biol. 215: 403–
410.
Bailey, N. T. J., 1961 Introduction to the Mathematical Theory of Genetic microsatellite loci: implications for genetic differentiation.
Genet-ics 143: 1021–1032.
Linkage. Oxford University Press, London.
Beaulieu, J., A. CorriveauandG. Daoust, 1989 Phenotypic stabil- Perry, D. J., andG. R. Furnier, 1996 Pinus banksiana has at least
seven expressed alcohol dehydrogenase genes in two linked ity and delineation of black spruce breeding zones in Quebec.
Forestry Canada Information Report LAU-X-85E. groups. Proc. Natl. Acad. Sci. USA 93: 13020–13023.
Pfeiffer, A., A. M. Olivieri, andM. Morgante, 1997 Identification Bousquet, J., L. SimonandM. Lalonde, 1990 DNA amplification
from vegetative and sexual tissues of trees using polymerase chain and characterization of microsatellites in Norway spruce (Picea
abies K.). Genome 40: 411–419.
reaction. Can. J. For. Res. 20: 254–257.
Boyle, T. J. B.,andE. K. Morgenstern, 1987 Some aspects of the Plomion, C., N. Bahrman, C. E. DurelandD. M. O’Malley, 1995
Genomic mapping in Pinus pinaster (maritime pine) using RAPD population structure of black spruce in central New Brunswick.
Silvae Genet. 36: 53–60. and protein markers. Heredity 74: 661–668.
Sambrook, J., E. F. FritschandT. Maniatis, 1989 Molecular Clon-Bradshaw, H. D., Jr., M. Villar, B. D. Watson, K. G. Otto, S.
Stewartet al., 1994 Molecular genetics of growth and develop- ing: a Laboratory Manual, Ed. 2. Cold Spring Harbor Laboratory
Press, New York. ment in Populus. III. A genetic linkage map of a hybrid poplar
composed of RFLP, STS and RAPD markers. Theor. Appl. Genet. Slabaugh M. B., G. M. Huestis, J. Leonard, J. L. Holloway, C. Rosato,et al., 1997 Sequence-based genetic markers for genes
89:167–178.
Davis, T. M., andH. Yu, 1997 A linkage map of the diploid straw- and gene families: single-strand conformational polymorphisms
for the fatty acid synthesis genes of Cuphea. Theor. Appl. Genet. berry, Fragaria vesca. J. Hered. 88: 215–221.
Devereux, J., P. HaeberliandO. Smithies, 1984 A comprehensive 94:400–408.
Smith, D. N.,andM. E. Devey, 1994 Occurrence and inheritance
set of sequence analysis programs for the VAX. Nucl. Acids Res.
12:387–395. of microsatellites in Pinus radiata. Genome 37: 977–983.
Sokal, R. R.,andF. J. Rohlf, 1981 Biometry, Ed. 2. W. H. Freeman, Devey, M. E., A. Delfino-Mix, B. B. KinlochandD. B. Neale, 1995
Random amplified polymorphic DNA markers tightly linked to San Francisco.
Szmidt, A. E., X. R. WangandM. Z. Lu, 1996 Empirical assessment
a gene for resistance to white pine blister rust in sugar pine.
Proc. Natl. Acad. Sci. USA 92: 2066–2070. of allozyme and RAPD variation in Pinus sylvestris (L.) using hap-loid tissue analysis. Heredity 76: 412–420.
Echt, C. S., P. May-Marquardt, M. HseihandR. Zahorchak, 1996
Characterization of microsatellite markers in eastern white pine. Talbert, L. E., N. K. Blake, P. W. Chee, T. K. BlakeandG. M. Magyar, 1994 Evaluation of “sequence-tagged-site” PCR
prod-Genome 39: 1102–1108.
Ghareyazie, B., N. Huang, G. Second, J. BennettandG. S. Khush, ucts as molecular markers in wheat. Theor. Appl. Genet. 87:
789–794. 1995 Classification of rice germplasm. I. Analysis using ALP and
PCR-based RFLP. Theor. Appl. Genet. 91: 218–227. Tautz, D., 1989 Hypervariability of simple sequences as a general
source for polymorphic DNA markers. Nucl. Acids Res. 17: 6463–
Guerrero, F. D., andL. Crossland, 1993 Tissue-specific expression
of a plant turgor-responsive gene with amino acid sequence ho- 6471.
Tragoonrung, S., V. Kanazin, P. M. HayesandT. K. Blake, 1992
mology to transport-facilitating proteins. Plant Mol. Biol. 21: 929–
935. Sequence-tagged-site-facilitated PCR for barley genome mapping. Theor. Appl. Genet. 84: 1002–1008.
Hodge, R., W. Paul, J. Draper andR. Scott, 1992 Cold-plaque
screening: a simple technique for the isolation of low abundance, Tsumura, Y., Y. Suyama, K. Yoshimura, N. ShiratoandY. Mukai,
1997 Sequence-tagged-sites (STSs) of cDNA clones in Cryptome-differentially expressed transcripts from conventional libraries.
Plant J. 2: 257–260. ria japonica and their evaluation as molecular markers in conifers.
Theor. Appl. Genet. 94: 764–772.
Isabel, N., J. BeaulieuandJ. Bousquet, 1995 Complete
congru-ence between gene diversity estimates derived from genotypic van de Ven, W. T. G.,andR. J. McNicol, 1996 Microsatellites as
DNA markers in Sitka spruce. Theor. Appl. Genet. 93: 613–617. data at enzyme and random amplified polymorphic DNA loci in
black spruce. Proc. Natl. Acad. Sci. USA 92: 6369–6373. Weber, J. L., andP. E. May, 1989 Abundant class of human DNA
polymorphisms which can be typed using the polymerase chain
Kaldenhoff, R., A. KollingandG. Richter, 1993 A novel blue
light- and abscisic acid-inducible gene of Arabidopsis thaliana en- reaction. Am. J. Hum. Genet. 44: 388–396.
Welsh, J.,andM. McClelland, 1990 Fingerprinting genomes using
coding an intrinsic membrane protein. Plant Mol. Biol. 23: 1187–
1198. PCR with arbitrary primers. Nucl. Acids Res. 18: 7213–7218.
Williams, J. G., A. R. Kubelik, K. J. Livak, J. A. Rafalski, and Kinlaw, C. S., S. M.Gerttula andM. C. Carter, 1994 Lipid
transfer protein genes of loblolly pine are members of a complex S. V. Tingey, 1990 DNA polymorphisms amplified by arbitrary
primers are useful as genetic markers. Nucl. Acids Res. 18: 6531– gene family. Plant Mol. Biol. 26: 1213–1216.
Narain, P., 1990 Statistical Genetics. John Wiley and Sons, New York. 6535.
APPENDIX
STS primer sequences
Product size (bp)
Clone Forward primer Reverse primer cDNA Genomic
SB01 GCGTTCCAGAAATCCTACTAC CCAAATGCACCATAAATACAGa 220 1900–2075
SB06 TAAGGCAATTCTTCGGCTCAC ACTAAGACAACCATTCTCTCC 539 539–609
SB07 AACAATGGGTTGGAGATCGTC CGCTTGACAGGTCTTGGTAAC 382 645–648
SB08 TTCGATGCTAGGTCTTGAGTC CAGAAATTGGAAGTAAGAACG 382 634–653
SB09 CGTGTTTGCATGTCACTCTAC CAGCATATCCACACCGACATA 449 —
SB11 GTATTACCCAGCTCAAGTTCC AACTATCCCACCACTCCTGTC 469 691–695
SB12 TTATTGAGGATGTCCGTGTTC AGAGGTAGACCATCTAGTCAC 497 600
SB13 AATAGGCGATGGAAGTGTCAG CAGAAGCAAGTACAGATGAGC 502 —
SB14 TACTTCGAGTGTCTCTCATTG GCTGTCAGAGTTTGTAACATC 446 446
SB15 ACAAACTGGAGCGTGAAGAGC ACTATGACGGGAGCCAAGTTG 602 —
SB16 GATTCCACACAAAACCAAGCG CAAAGTATACCCCTTGAACAC 553 1050b
SB17 GAGGGATGAATATGGTCTACG AATAACGCCAAATGCCTCCAC 515 640bc
SB18 TCCTTATGACCGAGCCATTGC AACACGGTGAGAACTGATAGC 597 720bc
SB19 TTTGCGGAAGAGGAGACTATC CGCTGCCCTATATCTTGTATG 397 397
SB21 CAGATCAGGCACGCATTGTTG GTCCATCAGGGCTCATGTTTG 381 471–474
SB23 GGTTTGAAGAGGCAGCCAATG TTGGGAAAGGCGGCACTAATG 412 —
SB24 CAGTATGTGGGTTCATGTTAG TTTGATAGCAGAGACCACTTC 474 738–771
SB25 ACTTACCTGACATGCCCATTG CTCCGAGCTGTTTCATATGTG 351 —
SB26 TTGGGGAAGCTACAGAGATAC GCGAACTAAGAGACAGCAGAC 366 —
SB28 CCAACAAGAAAGCCACGTCAG ACCAACAAACGCCCTCTTCAC 453 550
SB29 AGCGGCATTGAACAGAGTAAC AATGGAAATGAAGGCAGACTC 574 553–580
SB30 CAGTGCTGTGCCTATAACAAC GGCTGATGTGATTCCAGAAAG 525 —
SB31 TTGGCATCTCTCAGCACATTC TAGGTTTCTGGTCACGTCTAC 311 439–449
SB32 TGCTGTCTACACTGCTCAATG CAGAAGCCTGAGGATGTTACC 529 760
SB34 TATCCATCGCCTGCTTCTCAC TGTAGTCAGTCCGAATGTACC 498 1160
SB35 AGTATGGCGAGGGCAGTCTTC TTCACTCCCGATCCACTCATC 327 440–496
SB36 TTCAGATCCATTGCCTGTGAG TGAGGACAAGCAACCACAGAC 429 429
SB38 GATATGGTCATGGCTACAGTG GCAAAAACTGGACCTTATTTC 433 —
SB41 GCTGAGGGGAAGGATTGATAC GCTTCGACAGGCATATTACAG 404 520
SB42 GAAGCTTAACAAGGCCGTATG CCCAAACATAGGCAATAATCC 582 582–766
SB46 GGCTGTCAATACAAGTCATTC TCACGTTGTTATTGTTGTCAC 599 2320
SB48 TCGTAAACCCAAAAGTTCAAG ACCGCATATCCTAAAGGTAAC 504 —
SB49 AGGTCCTCCAAAAGTTCTGTG GCCTCATGTTCCCAAAGTCTC 323 323
SB50 GCGGAACCTTACAGGAATTTG GCATTTAGACCCCGAGGACAG 451 451
SB51 TGAAACAGACTTCTCGTACTG TTCTTACGTAGCTGCTCTAAC 358 358
SB52 —d AAATCATCGCACATAGCTACAG 756 900bc
SB53 CTGATCCTCCAGAAGAAACTC AGTCCGATGGTTGCTTATGTG 569 800b
SB55 TCCAATGTGGTCAGTCTCAAG GCAGATTGAAAGATTCCAGTC 544 —
SB56 CTTTGGACACAACTAAGACTG TAGTGTCACTCCATCTGAAAC 372 475
SB58 CCGACAATCAAATACACTGAG TACCAGACCAGACCTTCAATG 392 520
SB60 TGGGAGAATGACTAGATTGTG AAGCCTTGACAATAGTAAGTG 378 378
SB62 —e ACAGTACGCCGCAGACAAATG 424 681–706
SB64 AGGAGGATATAGCTCGGATAC TGTTACACCGAAACTGTTCAG 510 510
SB65 CGAGTCTTGTTTCTGCGTTAC CTTCGTCCATTGAAAGACTTG 600 —
SB66 AGGTTGTGTACATGGCAATAG AGGCAAGGAGAATTAACAAAG 382 740b
SB67 CAATTCAAGTTCTTCAATCTC GTCAATGGATTTAATGAGTTC 417 417
SB68 ACGTCCAGGTGCAGATGTAAC TCGAACAATGTTGAGATCAAG 502 502
SB70 AAATGGCGGTGTCATCTCTTC AAAATGAGTTCCCTGCCAATC 417 404–417
SB71 AGTATAGGATCTGCTCGAATG CCAATATGAAACACACGGTAG 536 2500
SB72 GCTCAGGAATCACTATCATTG CAAAGATACCAACCGATTAAG 523 515–523
Primers sequences are given 59 to 39. Clone refers to the cDNA from which the primer sequences were selected. Sizes of cDNA products were inferred from sequences of cDNA clones. For genomic products, sizes were estimated from relative electrophoretic mobilities, or inferred from sequences of different alleles. Multiple alleles are represented by a range of genomic product sizes. Dashes in the genomic size column indicate that genomic amplifications were unsatisfactory.
aSequence shown is of SB01-Rb, a primer in the coding region within the presumed exon 3. The original reverse primer located in the 39-UTR (SB01-R) was CAACAGAATCAGCAGCATAAG.
bNull amplification allele(s) also detected.