SELECTION INDEX OBTAINED BY POOLING INFORMATION FROM TWO OR MORE EXPERIMENTS
W. D. HANSON AND HERBERT W. JOHNSON
Biometricd Services and Field Crops Research Branch, A . R . S., U . S . D. A . , Beltsnille, Maryland Received November 16, 1956
ELECTION indexes have been proposed in animal and plant breeding programs
S
as a criterion for selection when certain quantitative characters are considered. Such characters present particular difficulty in selection programs since heritable variations are often masked by nonheritable variations. Investigations have demon- strated that a selection index based on a number of measurements could be used effectively to increase the probability of selecting desirable genotypes as compared to that if selection were practiced with an independent culling level for each measure- ment. The pertinent question is whether a selection index determined from a source of data can be used as a general index for a breeding program. The success of such a general index depends upon the sampling errors expected for the estimated weights of the index and the errors involved in the estimation of the genotype by environment interaction. The effects of genetic source sampled upon the expected genetic correla- tions between the factors involved in the index are of critical interest. Experimental data are necessary to adequately evaluate this problem; therefore, the approach considered in this paper is to present arguments for the combining of information from a series of experiments, to obtain a general index and to present basic relation- ships involved in the application of a selected set of phenotypic weights to specific sources of data.Deaelopment of Relationships
The approach used here is essentially that outlined by SMITH (1936). Let
+
be the genetic worth of an individual and Y the corresponding phenotypic value. Then:+
= aigi, and Y = bipii z
where g, is the genotypic value for a given character involved in a measurement, and a , is the corresponding relative economic worth;
p ,
is the phenotypic value of the character, and b, is any weight.The variance of
+
is:Ti, = E[+ - E+]' = aZa3g2, = a L A z
,
and (A)s 3 z
the variance of Y is:
v p
= E [ Y - EY]2 = b,b,p,, =c
b,B,, (B)? 3 f
422 W. D. HANSON AND HERBERT W . JOHNSON
bjpij, are identified primarily for calculation purposes. Similarly, the covariance
j
between
+
and Y is:U'
= E [ Y-
El'][+
- E+] =c
c b i a j g i j =c
b i A , .i j i
The expected genetic advance (AG) for any set of bj's is:
W
=
[=I
where s represents the selection differential in standard measure. The quantities,
W , V p and V ,
,
for any set of weights are identified in table 1. SMITH (1936) deter- mined the values of bj's which maximize genetic advance for a given source of data to be:where the cij's are the elements of the inverted phenotypic matrix. If one substitutes for b, in (B) above, he obtains, V p = biAi = W , and formula (D) for the expected genetic advance reduces to:
i
i
If any other set of bj's is used in the selection index, equalities E and F do not hold, and the expected genetic advance would be less than that expected if the weights calculated from (E) are used in the index.
The criterion for the establishment of an average selection index would be: when selection is to be based on a weighted index of two or more phenotypes, the weights will be determined such that the advance in genotypic worth will be a maximum with reference to all possible genotypes, for the characters under consideration, evaluated over all possible environments. This implies implicitly that the phenotype as de- viation from E(pi,k) must be considered as:
where p f 3 k and g , have the interpretation previously noted, c is the error within an
bi
bi
S l l k glzk g c i k
g i l k giZk giik
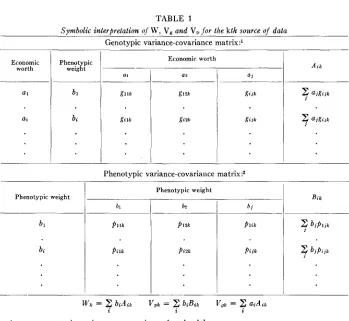
TABLE 1
Symbolic interpretation nf W , V, amd V, f o r the kth source of data Genotypic variance-covariance matrix : l
Economic worth
Economic worth Phenotypic
ax a i
-
Phenotypic weight
i
bl P l l kp i u
Phenotypic weight
b2
P l Z k
P i Z k
P l i k
P i j k
Z
ajgi j k i2
aigajs iWk
2
biAin V p k =2
biBii; V g k GAiki i z
l g i i k = genotypic variance or covariance for the kth source.
2 p i j k = phenotypic variance or covariance for the kth source.
424 W. D. HANSON AND HERBERT W. JOHNSON
to be: The phenotypic weights (bj's) will be selected such that the average genetic advance will be a maximum.
The average genetic advance for t sources of data is:
The maximum AG depends only upon the proportion included in the brackets. Maxi- mizing the proportion in the brackets with respect to the bi's yields simultaneous equations of the form:
where
112
Ck = ___ Wk and
Dk
=(&-
.
( v ~ k ) ~ "
Thus, the weights for combining the t phenotypic matrixes are proportional to the respective Ck's and for combining the t genotypic matrixes are proportional to the respective Dk's. The phenotypic weights for the selection index are calculated in the normal procedure from the pooled matrixes obtained using these weights, where the phenotypic matrixes are expressed on a common base.
An exact solution for the bj's is impracticable; therefore, estimates of the average b j f s would be available if the phenotypic variance-covariance matrixes were simply pooled, as well as the genotypic variance-covariance matrixes, and the bj's calculated. The values of the bj's obtained can be used to estimate the respective Ck and
Dk
constants and to obtain a weighted pooled phenotypic and genotypic variance- covariance matrixes. One thus obtains a set of corrected average bj's.
where the primes are used to identify any selected set of
hi's
as compared to that set which yields maximum expected genetic advance for the selected data ( A G 2 AG').The expected correlation ( r ) between the index of phenotypic values when the specific index is used and when the general index is used is:
For this specific source,
hence,
b'iB, = b'iAi and biBi = b , A i .
i i i i
V
The constant K = -p noted by SMITH (1936) is unity for the selected case. The W
exDected correlation reduces to:
The ratio of the expected genetic advance for any selected set of bj's to the maximum genetic advance expected through the use of an index is essentially the expected correlation between the respective indexes of phenotypic values.
The expected genetic advance (AG) which has been determined is the expected advance in the genotypic worth (#) for the selected group. The expected genetic changes for the individual characters involved in the index can be calculated. The symbol jAG,,b, ... will be defined as the expected genetic change for t h e j t h character (in the units of the character) when characters
i
= a, b,. . .
are used to construct the index. For any selected set ofhi's:
For example, the expected genetic change in X1 when the index is based on X I , Xz and X3 is:
426 W. D. HANSON AND H E R B E RT W. JOHNSON
3
if bi = cijgij is considered. These weights yield maximum expected genetic ad- vance for X I . The expected genetic advance in X I if the selection index is based on X Z and X 3 is:
i
3
C
b i g i iwhich reduces to :
3
if bi =
of the matrix resulting from the inversion of:
p 3 2 p z 2 .
cijgil is substituted in the formula. The cii)s in this case are the elements
i=2
p 2 2 9 2 3
The relationship for expected correlation between the indexes of the phenotypic values holds. For example, 1r12s = ~ 1AG'123, is the expected correlation between the
1AG123
indexes of phenotypic values for X I when the two respective indexes are used.
NUMERICAL EXAMPLE
The data for this example have been obtained from JOHNSON, et al. (1956). I n this reference selection indexes based on different criteria have been evaluated for two different segregating populations (experiments) of soybeans. The populations have also been described in JOHNSON et al. (1955). The lineswere evaluated in the F4 genera- tion a t two or three locations in one year. Although the'mean score ratings for lodging were very similar for the two populations, the response to lodging was distinct, popu- lation one being characterized by loss of dominance of the terminal bud and popula- tion two being characterized by maintenance of dominance of the terminal bud in the lodged plants. The data in grams per plot involving yield of oil ( X I ) , yield of protein ( X 2 ) , and yield of seed ( X 3 ) were selected for this example. The economic worth equivalents of al = 1, a2 = .6, and a3 = 0 for X I
,
X2 and X s,
respectively, were also selected for this example. The phenotypic and genotypic variance-co- variance matrixes are given in table 2. The phenotypic weights which maximize ex- pected genetic advance in the specific populations and the phenotypic weights com- puted from the pooled variance and covariances also are included in the table. The calculations are identical to those outlined by SMITH.l ' pk
wk
procedures ne'cessary for calculating W1 for segregating Population I is outlined in table 3 . The respective variances and covariances were estimated as follows:
I
Segregating population177.29 154.68
174.29 157.68
I
II
I1XI X2 X 3
The weights for pooling the phenotypic matrixes and the genotypic matrixes were calculated by formula (H) and are as follows:
I
Segregating populationI
I
I1.07383
.07510
1
.oooo
1.0172
.OM96
.08040 1.1101
1 ,0890
Since the weights are relative, the weights can be expressed as a proportion of .07383. The two populations are not appreciably different with respect to the variances and covariances involving genotypic worth and phenotypic value. The weights for combining the respective matrixes are essentially unity. The phenotypic variance- covariance matrixes and the genotypic variance-covariance matrixes were pooled proportionately to the weights ckand Dk
.
The phenotypic weights were again cal- culated in the normal procedure yielding:Calculated
Relative b i l d c j j
,8290 ,1073 - ,0507
.1294 - .0612
1 . 1 1
The corrected relative phenotypic weights do not differ appreciably from the esti- mates obtained by simply pooling the genotypic matrixes and the phenotypic matrixes. I t also should be noted that the index is determined principally by yield of oil ( X I ) .
The maximum genetic advance for a population can be computed directly from s d Z X i . As an example, the calculations necessary to compute the genetic ad- vance if the weighted index were used are given in table 4. The calculations necessary to compute T based on relationships (I) or (J) are also indicated.
428 W. D. HANSON AND HERBERT W. JOHNSON
492.532
1
112.13 707.74 139.378 2,103.241
425.19 TABLE 2Phenotypic and genotypic variance-covariance matrixes obtained f r o m two segregating popadations of soybeans
139.378 425.19 482.058 935.98 935.98 2,245.03 Phenotypic' XI
1 2 x3
bl = 1.2433
b2 = -.5942
b3 = .1196 Genotypic XI
X2
x3
bi .7283
b2 = .3401
ba = - ,1189
Segregating population
I
1
I1Specific phenotypic weights
Pooled phenotypic weights
XI
287.455 477.40 1,266.170
128.730 160.607 492.532
X2
477.40 934.95 2,303.13
160.607 254.56 707.74
~
I
1,266.170 ~
N2::;
I
442.07I
1,136.4252,303.13 1,219.54 2,591.68
5.951.19 1,136.425 2,591.68 6,075.24
Phenotypic variances and covariances were constructed on the assumption that genotypes were to be evaluated over one year and two locations with two replications per location.
TABLE 3
Computational procedures f o r the calculation of W for Population I utilizing the pooled phenotypic xieights
Economic north
1
Phenotypic weight
.___
.a335 ,0968 - .CL476
128.730 160.607 492.532 225.09
160.607 254.56 707.74 313.34
492.532 ~ 707.74
I
2,103.24 ~ 917.18W =
2:
biAi = 174.29 ithe weights associated with XI are the largest of the three phenotypic weights and are positive. There are differences in the contribution of Xz and X 3 to the selection indexes. The genetic advances, however, are quite similar for a population when the different indexes were used, the exception being the index from Population I
applied to Population 11. Likewise the correlations of phenotypic values are sur- prisingly close to 1.
a i
1 .6 0
128.73 160.607 492.53
160.607 254.56 707.74
492.532 707.74 2,103.24 TABLE 4
Calciilation required f o r the estimation of genetic advance and correlation ?f phenotypic values f o r population I
Ai
225.09 313.34 917.18 Genotypic variance-covariance matrix:
~- -
I I i
477.40 934.95 2,303.13
b
1,266.17 255.33 225.16 2,303.13 379.32 313.46 5,951.19 995.06 917.47 1 .2433
,1196 - .5942
Population I
Population I1
Weighted average Economic worth
h’
1
.oooo
1 .OoOo1 .oOOo 1 .oOOo
.8290 .lo73 - ,0507
Phenotypic variance-covariance matrix:
b
1 .2433 .1196 - ,5942
b’
1
b 1.2433
.8290 .lo73 - ,0507
b’ ,8290 287.455 477.40 1,266.17
2
blAi = 173.72 iz i
biBi =
2
biBE = 173.78 203.36 4203.41AG = s = ~(14.26)
173 78 d(203.41) (177.05)
r = = ,916
--.5942 ,1196
1
--.OS071
B‘ ~ B i.lo73
biAi = 203.36
2
bEB: = 177.05i
biBi = 203.41 173.72 4177.05
AG’ = s -A= ~(13.06)
13.06 14.26 r = ~ = ,916
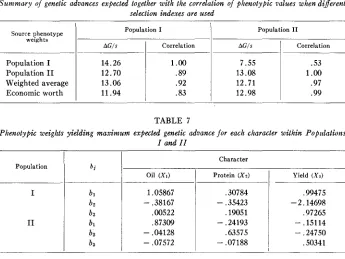
TABLE 5
Summary of the relative phenotypic weights based on the specific indexes f o r each population, on tlae average index and on a n index of economic worth
Phenotype Source
I
X21
x3- .4779 ,4670 ,1294 .6000
.0962 - .1633 - .0612
.moo
the weights are taken to be: bl = 1, bz = 0 and bn = 0. Hence, 1AGl
5
lAGlzn and the expected correlation between the yield (Xl) of oil and the index of phenotypic values is where 1AG123 is the maximum genetic advance expected for X1.
iAG123
430 W. D. HANSON AND HERBERT W. JOHNSON
Population I
AG/s Correlation
14.26 1.00
12.70 .89
13.06 .92
11.94 .83
TABLE 6
Summary of genetic advances expected together with the correlation of phenotypic values when different selection indexes are used
Population I1
AG/s Correlation
7.55 .53
13.08 1
.oo
12.71 .97
12.98 .99
Source phenotype weights
Population I Population I1 Weighted average Economic worth
TABLE 7
Phenotypic weights yielding maximum expected genetic advance for each character wilhin Popillations
I and I I
Population
I
I1
Oil ( X I )
1.05867 - .38167 .00522 ,87309 - .04128 - ,07572
Character
Protein (X2)
.30784
,19051
,63575 - ,35423
- .24193
- ,07188
Yield (X3)
,99475 - 2.14698 ,97265 - ,15114 - ,24750 .SO341
the corresponding indexes for Population I and Population I1 is striking. The ex- pected change for a character within a population when one of the four indexes given in table 5 is used as a criterion for selection can be obtained relatively easy from the calculations as outlined in table 4. For example, the expected change in genotype of X1 (yield of oil) in Population I when the index based on a weighted average (bl = 3290, bz = .1073, ba = -.0507) is used is:
3 3
E
b’;gilC
bk giil ~ ~ : z s = s
98.98
= 7.44 (s) pounds,
=sd177.05
where 3
b;g,, = [A290 X 128.731
-I-
[.lo73x
160.6071-
[.OS07 X 492.5321.i= 1
r ,862 1.OOO .983 .770 .847 .739 .920 1.Ooo
, 7 7 5
,897 .725 .942
TABLE 8
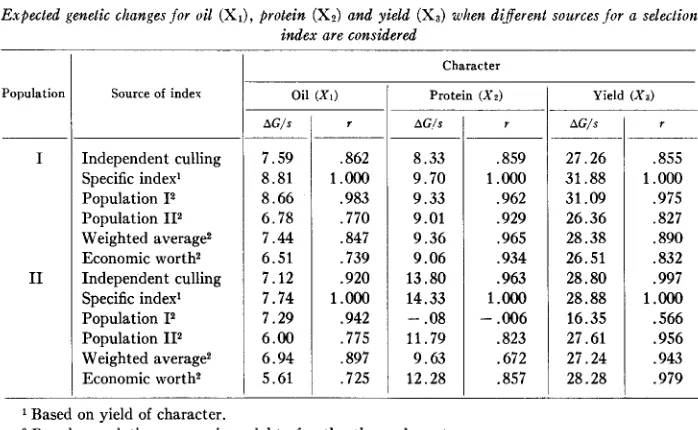
Expected genetic changes for oil (XI), protein (X,) and yield (X,) when different sources .fur a selection index are considered
AC/s _ _ _ ~ 8.33 9.70 9.33 9.01 9.36 9.06 13.80 14.33 11.79 9.63 12.28 -.OS
Population Source of index
Independent culling Specific index’ Population I2 Population 112 Weighted average2 Economic worth2 Independent culling Specific index’ Population I2
Population 112 Weighted average2 Economic worth2
Character
o i l ( X I )
1
Protein ( ~ 2 )AG/s
7.59 8.81 8 .6 6 6.78 7 . 4 4 6.51 7.12 7.74 7.29 6.00 6.94 5.61 r ,859 1.000 ,962 .929 .965 .934 .963 1 .Ooo - .006 .823 .672 .857
Yield (Xa)
AG/s 27.26 31.88 31.09 26.36 28.38 26.51 28.80 28.88 16.35 27.61 27.24 28.28 r ,855 1.000 .975 ,827 .890 ,832 .997 1 .Ooo
.566 .956 .943 .979
Based on yield of character.
2 Based on relative economic weights for the three characters.
can be further noted that if a selection index were available from only one source of data and applied to a different set of data, the changes for the individual characters appear to be less consistent than if a selection index based on economic worth were considered.
DISCUSSION AND SUMMARY
A criterion for the determination of an average selection index from two or more segregating populations has been presented. The criterion is that the phenotypic weights be so selected that the average genetic advance is a maximum. Since a direct solution of the bj’s was impracticable, the phenotypic variances and covariances and the genotypic variances and covariances were merely pooled to obtain an estimate of the average bj’s. Weights for pooling the respective matrixes were then estimated and a set of phenotypic weights were obtained from the pooled matrixes. One itera- tion should be sufficient since changes in bj do not affect appreciably the relative
values of wkand V p k
.
Procedures for the calculation of genetic progress expected in genetic worth or in individual characters if selection is to be based on any set of phenotypic weights were outlined. Such weights are considered as constants. A point of interest was that the ratio of the expected genetic advance for a general index to the maximum genetic advance expected for the data utilizing a selection index is the expected correlation between the indexes of phenotypic values obtained with the two indexes.
As noted by JOHNSON (1955, 1957), the two populations are distinct with respect
43 2 W. D. HANSON AND HERBERT W. JOHNSON
distinct genetic populations. Although lodging is not involved in the index, the genetic correlations between XI
,
Xz and Xs could be affected. If the genetic correla- tions between the characters of the index depend upon the population sampled, ttere could be no justification for considering a general selection index for a breeding pro- gram in soybeans. From the information presented in tables 5 and 6, it appears that selection indexes may deviate yet give similar information in a selection program. COMSTOCK (1955) has noted the possibility of basing a selection index entirely upon economic worth. Of the factors involved in the construction of a selection index, economic worth is the consistent element. For these two sets of data, the average progress expected, if an index based on economic worth were used, is less than that expected for the optimum index; however, the average genetic advances of these two indexes do not differ appreciably. When the expected genetic change for each character involved in the index was considered, the results were surprisingly similar (table 8), the exception being the case when the index derived from Population I was to serve as the criterion for selection in Population 11. Again the index based on relative economic worth appeared quite satisfactory.I n interpreting these results, one certainly must recognize that the environment for the two populations are correlated and that XI (yield of oil) contributes principally to the index. Also, additional sources of genetic data are required to evaluate the effects of genetic populations sampled upon expected genetic correlations and the adequacy of the genotype by environment interaction estimate. Additional theoreti- cal information on the sampling errors expected is essential before an adequate evalu- ation of an average selection index can be made. However, these preliminary results add credence to the assumption that a general selection index in a soybean breeding program is feasible for the criterion of economic worth selected in this paper.
LITERATURE CITED
COMSTOCK, R. E., 1955
annual meeting S-10 Tech. Com., Raleigh, N. C. pp. 64-69. HAZEL, L. N., 1943
JOHNSON, HERBERT W., H. F. ROBINSON, and R. E. COMSTOCK, 1955 Genotypic and phenotypic
JOHNSON, HERBERT W., C. R. BRIM, and C. C. COCKERHAM, 1956 The use of selection indices in ROBINSON, H. F., R. E. COMSTOCK and P. H. HARVEY, 1951 Genotypic and phenotypic correla- SMITH, H. FAIRFIELD, 1936
Basic information needed to construct a selection index. Mineo. report, The genetic basis for constructing selection indexes. Genetics 28: 476-490. correlations in soybeans and their implications in selection. Agron. J. 47: 477483. soybean breeding. (Abstr.) American Society of Agronomy Meeting. Cincinnati, Ohio. tions in corn and their implications in selection. Agron. J. 43: 282-287.