ISSN(Online): 2319 - 8753
ISSN (Print) :2347 - 6710
I
nternational
J
ournal of
I
nnovative
R
esearch in
S
cience,
E
ngineering and
T
echnology
(An ISO 3297: 2007 Certified Organization)Vol. 4, Issue 1, January 2015
Generation of Pulsed Fe Plasma and Study of
Its Physical Parameters
Naseer M. Hadi
1, Sabah H. Sabeeh
2and Mustafa M. R. Sabhan
3Laser & Electro-Optics Research Center, Ministry of Science and Technology, Baghdad, Iraq 1
Department of Applied Science, University of Technology, Baghdad, Iraq 2
P.G. Student, Department of Applied Science, University of Technology, Baghdad, Iraq 3
ABSTRACT: In the present work, a pulsed Fe plasma generation by Q-switched Nd: YAG laser. The energy per pulse
at the target surface was fixed at a level of (475 mJ, 6 ns), focused on Fe solid target at atmospheric pressure and vacuum pressure (1×10⁻¹ mbar).The plasma temperature was measured from Boltzmann plot using six Fe I spectral lines at the wavelengths (501.2, 534.1, 556.9, 576.2, 602.4 and 623.07) nm. The electron density was measured by means of Stark broadening formula (FWHM) for spectral lines Fe I at line transition 576.2 nm and for Fe I at line transition 556.9 nm as the reference electron density, at atmospheric pressure and vacuum pressure. The density was 8.2x1018 cm-3 and electron temperature 1.466 eV at atmospheric pressure, the electron density was 9x1018 cm-3 and the electron temperature 1.711 eV at pressure (1×10⁻¹) mbar. Measurements were done based on theory of local thermodynamic equilibrium (LTE) in the range (500-650 nm) of emitted spectrum.
KEYWORDS: Laser-produced plasma; Plasma parameters; Fe plasma; Temperature; Electron density.
I. INTRODUCTION
Laser-produced plasma spectroscopy (LPPS) also called Laser Induced Plasma spectroscopy (LIPS) is one of the most fruitful methods using solid, liquid and gas target. LPPS uses a low-energy pulsed laser (typically tens to hundreds of mill joules per pulse) to generate a plasma which vaporizes a small amount of the sample [1]. The invention of the laser produced plasma in the mid-1970s led to increase in knowledge on interaction between electromagnetic fields and matter. Laser-produced plasmas applied to various areas in different fields of science. Laser produced plasma is better than an electric discharge because of the high efficiency, cleanliness and large collection angle [2]. Plasmas and laser-produced plasma applications classified as [3-6]. Plasma processing such as plasma surface cleaning, plasma thin film deposition, plasma hardening and plasma in medicine such as surface treatment, sterilization of medical instruments. Laser produced plasma has high temperature and high electron density gradient, this plasma is also high irradiative, it’s emitted a spectrum deepening on the target, the emitted spectrum gives information about the target. Spectroscopic method is one of plasma diagnostic, which can used it to measure the electron temperature and electron density from the emitted spectrum [7].
Temperature is one of the most important parameters used to characterize the state of the plasma. Most important spectroscopic techniques, for electron temperature, are the ratio of lines produced in sequential charge states of a single species. An accurate knowledge of the temperature leads to an understanding of the occurring plasma processes, namely vaporization, dissociation, excitation, ionization and transition probability. Plasma electron temperature can be measured from the relative intensity of two or more optically thin lines having small separation in the emission wavelength and large separation in their upper excited states (Boltzmann plot method) [8]. Moreover, the ionization temperature can be calculated from the relative intensity of two or more lines originating from two consecutive ionization stages. This method enhances the precession in measuring temperature due to enhancement of the separation of the upper excited states by the ionization energy (Saha-Boltzmann plot) [9].
ISSN(Online): 2319 - 8753
ISSN (Print) :2347 - 6710
I
nternational
J
ournal of
I
nnovative
R
esearch in
S
cience,
E
ngineering and
T
echnology
(An ISO 3297: 2007 Certified Organization)Vol. 4, Issue 1, January 2015
In this paper, we will describe the experiment, used to produce plasma from solid Fe target. The emission spectrum detected and analysis the intensity of it to diagnostic the electron temperature and electron density. The measurements of temperature based on relative line intensities of two lines given by equation [12]:
(
)
(
)
……… (1)where the Z refers to the ionization stage. kB is the Boltzmann constant, T is the plasma temperature. Ek,z and gk,Z are
energy and degeneracy of the upper energy level k respectively. nZ is the density number, and PZ is the partition
function of the species in ionization stage Z. L is the characteristic length of the plasma, Aki,Z is the transition probability IZ is The integrated intensity of a spectral line occurring between the upper energy level k and the lower
energy level i of the species in ionization stage Z in optically thin plasma. This yields a linear plot (Boltzmann plot) if one represents the magnitude on the left-hand side for several transitions against the energy of the upper level of the species in ionization stage Z. The value of T was deduced from the slope of the Boltzmann plot.
Electron density can be determined from the line broadening of Stark broadening formula. Laser produced plasma the most broadening is Stark broadening, this broadening results from collisions by electrons and ions. The optical emission spectroscopy (OES) is the tool by which the plasma can be diagnosed [13]. The diagnostics of the plasma can be done through the measurements of electron density (Ne) and temperature (Te). By measurements of the Stark
broadened from line profile of an isolated atom or singly charged ion and calculate the full width at half maximum (FWHM) of the line, Δλ1/2, which is related to the electron density (Ne) by the expression equation [14]:
(
)
………. (2)where w is the electron impact width parameter or Stark width parameter, Ne is electron density number. The Stark width parameter (w) of these lines and atomic data of the selected spectra lines are taken from reference [15, 16]. The measured widths (FWHM) agree fairly well with semi-classical calculations. They are usually normalized to a reference electron density Nr=1016 cm-3.
II. EXPERIMENTALSETUP
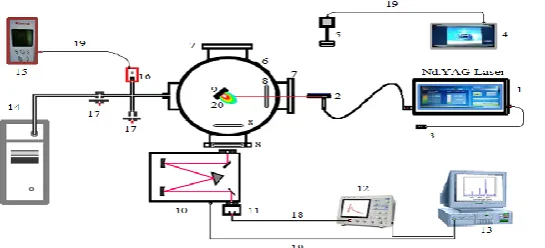
A Q-switched Nd: YAG laser model (RY580) was used at the fundamental wavelength (1064 nm). Repetition rate of (1Hz) is use for laser-produced plasma. The output pulse duration is (6 ns) and the maximum pulse energy (500 mJ), which is measure by a Gentec-EO MAESTRO joule meter. A schematic diagram of experimental set-up and the vacuum chamber is shown in Figure (1). The target holder was fixed at 45° direction in order to ensure that the plasma emission is right-angled with respect to the diagnostic tools. The distance between the target and the laser is 10 cm. The laser is focus on the target by a quartz lens of focal length of 5 cm, the vacuum chamber was evacuated using a rotary pump. Silicon Photo Detector (model DSi 200) was used to detect the visible and UV photons which were produced by laser produced plasma, wavelength in the range of 200-1100 (nm). Pure commercial metal target of Fe was used as target in the present work. A computerized Omni-Lambda 150 grating monochromator device was used.
ISSN(Online): 2319 - 8753
ISSN (Print) :2347 - 6710
I
nternational
J
ournal of
I
nnovative
R
esearch in
S
cience,
E
ngineering and
T
echnology
(An ISO 3297: 2007 Certified Organization)Vol. 4, Issue 1, January 2015
III.RESULTSANDDISCUSSIONS
Results of the present work include the measurement of electron temperature assuming the local thermodynamic equilibrium (LTE) and electron density determine by using Stark broadening in optically thin plasma conditions. The present work include the study of the effect of the surrounding pressure on the plasma intensity at wavelength region [500-650 nm] has done also. All data points were fitted with Lorentzian fitting function using Curve Expert Professional software version 2.0.3.
Figure (2): The emission spectrum of the produced Fe plasma at atmospheric pressure in spectral range [500-650 nm] for laser energies 475 mJ and power density (1×10¹² W cm-2) at zero delay time. The relative error of the fitting line is 4%.
ISSN(Online): 2319 - 8753
ISSN (Print) :2347 - 6710
I
nternational
J
ournal of
I
nnovative
R
esearch in
S
cience,
E
ngineering and
T
echnology
(An ISO 3297: 2007 Certified Organization)Vol. 4, Issue 1, January 2015
Table (1): Spectral lines of Fe I and their atomic data [10,11,15].
Wavelength (nm) Spectrum Aki (s -1
) Ei (cm -1
) Ek (cm -1
) gi gk
501.206 Fe I 5.50E+04 6 928.268 26 874.550 11 11
513.925 Fe I 9.16E+06 24 180.862 43 633.533 7 5
526.655 Fe I 1.10E+07 24 180.862 43 163.326 7 9
534.102 Fe I 5.21E+05 12 968.554 31 686.351 5 5
556.961 Fe I 2.34E+07 27 559.583 45 509.152 5 3
576.299 Fe I 9.60E+06 33 946.933 51 294.220 5 7
588.881 Fe I 1.9E+06 37 409.555 54 386.186 3 3
602.405 Fe I 1.69E+04 36 686.176 53 281.689 9 11
623.072 Fe I 9.99E+05 20 641.110 36 686.176 9 9
649.498 Fe I 7.66E+05 19 390.168 34 782.421 13 11
The plasma temperature measurement for Fe plasma is developed from Boltzmann plot using six Fe I spectral lines at the wavelengths (501.2, 534.1, 556.9, 576.2, 602.4 and 623.07) nm at laser energies 475 mJ. Using equation (1) and plotting ln (Iλ / gA) versus Eexc should yields a straight line with a slope equal to (−1/kT). The parameters of Fe I
spectral lines get it from Reference [10,11,15,16]. However, these lines would be good candidates for calculating the plasma electron temperature. The wavelength separation is very small as well as their separation in the upper excited states is relatively large with the expected plasma temperature (~ 1 eV) [13].
ISSN(Online): 2319 - 8753
ISSN (Print) :2347 - 6710
I
nternational
J
ournal of
I
nnovative
R
esearch in
S
cience,
E
ngineering and
T
echnology
(An ISO 3297: 2007 Certified Organization)Vol. 4, Issue 1, January 2015
Figure (5): Boltzmann plot for laser-produced Fe plasma at vacuum pressure equal to (1×10⁻¹ mbar). The relative error of the slop is 0.74% and the plasma temperature is T= 1.711eV (19837.6 K).
Fig. (4) shows that the temperature is 1.466 eV at atmospheric pressure. Fig. (5) shows that the temperature is 1.711 eV at pressure 1x10⁻¹ mbar, the deference in electron temperature due to difference of pressure, due to the presence of O2
molecules. The O2 molecules are electronegative ions. This gas can react strongly with plasma electrons and reduce the
mean free path.
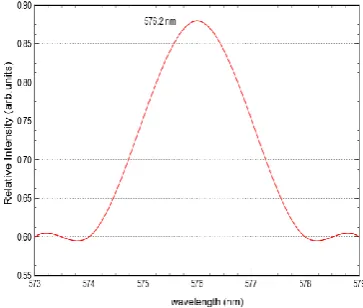
Figure (6): Spectral profile of Fe I at 576.2 nm at atmospheric pressure (1×10+3 mbar, power density 1×10¹² W/ cm2) at zero delay time. The relative error of the fitting line is 1%.
ISSN(Online): 2319 - 8753
ISSN (Print) :2347 - 6710
I
nternational
J
ournal of
I
nnovative
R
esearch in
S
cience,
E
ngineering and
T
echnology
(An ISO 3297: 2007 Certified Organization)Vol. 4, Issue 1, January 2015
Figure (8): Spectral profile of Fe I at 556.9 nm at vacuum pressure (1×10⁻¹ mbar, power density 1×10¹² W/ cm2). The relative error of the fitting line is 1%.
Plasma generated by laser characterized by high density, so Stark effect is leads to a broadening of emitted lines. By using equation (2) we determine the electron density of spectral lines Fe I at line transition 576.2 nm at atmospheric pressure as shown in Fig. (6) and Fe I at 576.2 nm at pressure 10-1 mbar as shown in Fig. (7). The electron density is (8.2x1018 cm-3) at atmospheric pressure and at pressure 10-1 mbar the electron density is (9x1018 cm-3). Also the electron density measured for spectral lines Fe I at line transition 556.9 nm at pressure 10-1 mbar as shown in Fig. (8), the electron density is (9.2×1018 cm−3). Effect of O2 on the temperature can be seen also on the electron density. Results of
the present work shows, the higher temperatures and electron densities are obtained in vacuum pressure (1×10⁻¹ mbar), and the lower ones are found in atmospheric pressure. The presence of this line was attributed to the existence of a very small concentration of water vapour (humidity) around the target [17].
IV. CONCLUSION
We have measured the plasma electron temperature using six spectral lines for electron temperature measurement and two lines for electron density measurement emerging from iron in LPP experiment. Temperature was calculated from line intensity ratios of successive ionization stages of iron and using six Fe I spectral lines for measured the plasma electron temperaturein order to get more accuracy in measurement. The density was determined from the Stark broadening of iron lines from its first ionization stage, and results from both lines were identical within experimental error. Also compare the results generated under the two types of environment air, a first under atmospheric pressure and secondly under vacuum pressure. Results showed a higher temperature value and density at vacuum pressure compared to the results that appeared at atmospheric pressure. Because of oxygen molecules that constantly surround the plasma, where it leads to reduce the mean free path between molecules and leads to reduce the number of collisions between plasma molecules. Plasma expands rapidly, but this expansion is slowed down and finally stopped by the resistance of oxygen molecules around the target. The electron density were re-evaluated and compared to reference density utilizing the Fe I at line transition 556.9 nm. This comparison shows an excellent agreement between the reference density and the measured utilizing the iron emission lines.
REFERENCES
1. D. A. Cremers and L. J. Radziemski,”Handbook of Laser-Induced Breakdown Spectroscopy”, John Wiley & Sons Ltd, West Sussex, 2006. 2. P. T. Rumsby, J. W. M. Paul, and M. M. Masoud, “Control Fusion”, Plasma Phys. Vol. 16, No. 969, 1974.
3. A. Bers and A. K. Ram, "Plasma Electrodynamics and Applications", RLE Progress Report 144, 2002.
4. U. Teubner and P. Gibbon, Rev. Modern Phys., Vol. 81, No. 445, 2009.
5. Ph. Nicolai, V. T. Tikhonchuk, A. Kasperczuk, T. Pisarczyk, S. Borodziuk, K. Rohlena, and J. Ullschmied, Physics Plasma, Vol. 13, No. 062701, 2006.
ISSN(Online): 2319 - 8753
ISSN (Print) :2347 - 6710
I
nternational
J
ournal of
I
nnovative
R
esearch in
S
cience,
E
ngineering and
T
echnology
(An ISO 3297: 2007 Certified Organization)Vol. 4, Issue 1, January 2015
8. De Giacomo, M. Dell’Aglio, F. Colao and R. Fantoni, “Double Pulse Laser Produced Plasma on Metallic Target in Seawater Basic Aspects
and Analytical Approach”, Spectrochim Acta Part B, Vol. 59, No. 9, pp. 1431- 1438, 2004.
9. W. Lochte-Holtgreven, “Plasma Diagnostics”, North Holland, Amsterdam, 1968.
10. NIST Atomic Energy Levels Data Center, NIST Data Base For Atomic Spectroscopy, National Institute of Standards and Technology, USA,
1995.
11. J. E. Sansonetti and W. C. Martin,” Hand Book of Basic Atomic Spectroscopic Data”, National Institute of Standards and Technology, American Institute of Physics, Gaithersburg, Maryland, 2005.
12. V. K. Unnlkrishnan, Kamlesh Alti, V. B. Kartha, C. Santhosh, G. P. Gupta, and B. M. Suri, ”Measurements of Plasma Temperature and Electron Density in Laser-Induced Copper Plasma by Time-Resolved Spectroscopy of Neutral Atom and Ion Emissions”,Pramana,Journal of Physics,Vol. 74, No. 6, pp. 983-993, 2010.
13. H. R. Griem, “Plasma Spectroscopy”, McGraw-Hill, Boston, 1964.
14. R. K. Singh, O. W. Holland and J. Narayan, "Theoretical Model for Deposition of Superconducting Thin Films Using Pulsed Laser Evaporation Technique", Journal of Applied Physics, Vol. 68, No. 1, pp. 233-147, 1990.
15. W. Allen, M. Blaha, W. W. Jones, A. Sanchez, and H. R. Griem, Phys. Rev. A, Vol. 11, No. 477, 1975.
16. H. R. Griem, “Plasma Spectroscopy”, McGraw-Hill Book Company, New York, 1964.
![Figure (2): The emission spectrum of the produced Fe plasma at atmospheric pressure in spectral range [500-650 nm] for laser energies 475 mJ and power density (1×10¹² W cm-2) at zero delay time](https://thumb-us.123doks.com/thumbv2/123dok_us/1682196.1212254/3.595.102.490.520.747/figure-emission-spectrum-produced-atmospheric-pressure-spectral-energies.webp)
![Table (1): Spectral lines of Fe I and their atomic data [10,11,15].](https://thumb-us.123doks.com/thumbv2/123dok_us/1682196.1212254/4.595.187.404.496.712/table-spectral-lines-fe-i-atomic-data.webp)