Two
Tests of Y
Chromosomal Variation in Male Fertility of
Drosophila melanogaster
Andrew
G .
Clark
Department of Biology and Genetics Program, Pennsylvania State University, University Park, Pennsylvania 16802 Manuscript received September 25, 1989
Accepted for publication March 2 1, 1990
ABSTRACT
Deficiency mapping with Y autosome translocations has shown that the Y chromosome of Drosophila melanogaster carries genes that are essential to male fertility. While the qualitative behavior of these lesions provides important insight into the physiological importance of the Y chromosome, quantitative variation in effects on male fertility among extant Y chromosomes in natural populations may have a significant effect on the evolution of the Y chromosome. Here a series of 36 Y chromosome replacement lines were tested in two ways designed to detect subtle variation in effects on male fertility and total male fitness. T h e first test involved crossing males from the 36 lines to an excess of females in an attempt to measure differences in male mating success (virility) and male fecundity. T h e second test challenged males bearing each of the 36 Y chromosomes to competition in populations with males bearing a standard, phenotypically marked (B”Y) chromosome. These tests indicated that the Y chromosome lines did not differ significantly in either male fertility o r total fitness, but that interactions with autosomes approached significance. A deterministic population genetic model was developed allowing Y autosome interaction in fertility, and it is shown that, consistent with the experimental observations, this model cannot protect Y-linked polymorphism.
D
ESPITE the fact that the Y chromosome consti- tutes about 14% of the genome of male Dro-sophila melanogaster, there is a remarkable lack of phenotypic variation associated with the Y chromo- some. In reviewing the literature, WILLIAMSON (1 976) concluded that there were no definitive examples of polygenic variation associated with naturally occur- ring Y chromosomes. In a massive quantitative genetic study, TORO and CHARLESWORTH (1982) failed to find any additive genetic variation for sex ratio. Finally, in the search for morphological mutants in Drosophila, the Y chromosome has presented us with a paucity of morphological markers.
Although these observations suggest that the Y chro- mosome is lacking in gene functions, laboratory ge- netic manipulations have identified several critical functions of the Y chromosome. T h e sterility of X 0 males suggested that the Y chromosome was required for male fertility, and deficiency mapping has identi- fied six distinct factors necessary for normal spermi- ogenesis (BROSSEAU 1960; GATTI and PIMPINELLI
1983). Y-linked rRNA genes can alleviate the bobbed phenotype associated with a deficit of X-linked rDNA, and there is considerable variation in the number of copies of Y-linked rDNA repeats (LYCKEGAARD and CLARK 1989). That we might expect to find pheno- typic variation associated with this copy number vari- ation is supported by observations of variation in the X-linked rDNA array, where spacer length variation is associated with variation in developmental rate
Genetics 125: 527-534 (July, 1990)
(CLUSTER et al. 1987), and selection on bristle length resulted in rDNA changes (FRANKHAM, BRISCOE and
NURTHEN 1980). T h e Y chromosome also has se-
quences that are necessary for chromosome pairing, but recent evidence suggests that the rDNA array may serve in this role as well (MCKEE and LINDSLEY 1987; MCKEE and KARPEN 1990). In Drosophila affinis, the Y chromosome appears to be involved in interactions with the X chromosome in producing a “sex ratio” phenomenon (VOELKER 1972).
Further studies of the Y chromosome have sug- gested its role in interactions with the expression of
genes on other chromosomes. T h e suppression of position effect variegation has long been known to be associated with the Y chromosome (SPOFFORD 1976), and recent evidence suggests that the degree of suppression does not depend on the amount of Y chromosome present (DIMITRI and PISANO 1989). A number of X-linked recessive mutations have been recovered that are lethal in XX females and X 0 males, but are viable in XY males, presumably due to suppres- sion of position effect variegation (LINDSLEY, EDING-
TON and VON HALLE 1960). Finally, X-linked bobbed mutations are often unstable, and reversion is associ- ated with increases in germline copy number of rDNA. This magnification of the rDNA array has been shown to require the presence of a portion of the long arm of the Y chromosome (KOMMA and ENDOW 1986, 1987).
528 A. G. Clark
expect a priori that the patriclinous transmission of the Y chromosome would result in a lower opportunity for selectively maintained polymorphism. Simple models with constant fitnesses fail to maintain poly- morphisms in panmictic populations (CLARK 1987b), and even allowing recombination with the X chromo- some, the conditions for polymorphism are stringent
(CLARK 1988). Selective polymorphism could be main-
tained by some form of frequency dependence, or by appropriate population subdivision and migration, but again, the stringency of conditions for polymorphism suggests that variation among Y chromosomes is even more likely to be neutral than autosomal variation.
An intriguing case of variation associated with the Y chromosome is found in
D.
affinis, which has a naturally occurring polymorphism for X 0 and XY males, both of which are fertile. Rather than exhibit- ing an all-or-none effect on fertility, the Y chromo- some was shown to provide a quantitative advantage in male fitness (VOELKER and KOJIMA 197 1). Although purely theoretical arguments suggest that Y-linked variation is likely to have little phenotypic conse- quence, the presence of so many functions affecting male fertility demands a careful look at this compo- nent of fitness. T h e objective of the study reported here is to test for the existence of subtle quantitative variation in male fertility among an array of naturally occurring Y chromosomes ofD.
melanogaster.METHODS
Drosophila stocks: T h e 72 Y-chromosome replacement lines were constructed following the procedure described in CLARK (1987a). There were a total of 36 distinct Y chro- mosomes among these lines, with each Y chromosome in two different lines having different genetic backgrounds. T h e marked Y chromosome used in assays of total male fitness was the B'Y from the stock BSY/C(l)DX y f/
Z n ( I ) s ~ ~ ~ s c " ~ , y S C ~ ~ S C ' ~ w Tu obtained from the Bowling
Green Stock Center. Males possessing this Y chromosome were readily identified by the Bar eye phenotype. T h e Roth- 15 females used in the net male fitness experiment were from the same line that was used in constructing the back- ground replacement for the Y-replacement lines (CLARK
1987a). T h e stocks used in all of the competitive tests had the P cytotype.
Test of male fertility: Male fertility was directly assayed by placing individual 2-4-day-old virgin males of the 72 replacements lines reared at controlled density in vials with 10 virgin females. After 4 days the females were placed individually into 95-mm vials with fresh medium and al- lowed to lay eggs for 4 more days. O n days 14-1 7 after females first laid eggs, the offspring were scored to deter- mine the total number of offspring sired by individual males. Females of both genetic backgrounds used in constructing the Y replacement lines were used, and nine independent replications of the experiment were performed. The data were structured as (36 Y chromosomes) X (2 male genetic backgrounds) X (2 female genetic backgrounds) X (10 fe- males per male) X (9 replicates), yielding a total of 12,960 vials. These data were analyzed by analysis of variance using the following model:
Ygkl = /.t
+
Y; MI+
+
YM,+
YF,k+
YMF,,k -k RI+
cgklwhere Yqkl is the progeny count from the Ith replicate of the
cross with the ith Y chromosome in a male with background j and a female with background k . T h e model assumes additivity of the effects of the ith Y chromosome with the j t h male background, the kth female background, the Ith
replicate, several interaction terms and a random error term, c. All the effects are random effects. Model fitting and computation of significance tests were done with the pro- cedure GLM in the SAS statistical package.
Test of net male fitness: Net male fitness, which includes components of viability, fertility, and meiotic drive, was assessed by coculturing males from each of the Y chromo- some replacement lines with males bearing a Y chromosome with the Barsronr B'Y translocation. Changes in the relative frequencies of the
k"
and B'Y may reflect differences in relative fitness. Only one genetic background of the Y- replacement lines was used (Roth-15), and one standard Y line (B"Y) was used, so differences among Y- replacement lines should reflect differences due to the Y chromosome. Effects of rearing environment were minimized by rearing the F1 flies (Y,' and B"Y) within the same bottle.Virgin Roth-15 females were crossed to B"Y males and to males from each of the Y-replacement lines. Equal numbers of females from the B"Y and Y,' crosses were placed into bottles, setting up one bottle for each of the Y-replacement lines. After 4 days, the adults were transferred to fresh bottles. Male F, progeny of both phenotypes were collected from these bottles and crossed to virgin Roth-15 females from the common background. Matings of the two types were kept separate, then equal numbers of inseminated females (bearing sperm of Y,' and B'Y males) were placed into five replicate 95-mm vials. These too were transferred to fresh vials after 4 days. At this point, each of the 36 lines has five replicates, each with two duplicate vials. On days 14-1 7 after these females started laying eggs, the adult progeny were scored by eye phenotype. These counts were called generation 1 data, and gave a baseline frequency for the Fn progeny of the original cross. Female progeny from each of these vials, which had been inseminated by males that had emerged, were transferred to five fresh vials and allowed to lay eggs for 4 days. When the progeny from these vials emerged, they were scored as generation 2. T h e generation 1 data consisted of counts from (36 lines) X (5 replicates) X (2 duplicates) = 360 vials. Flies from each of these vials were transferred to five more vials for a total of 360
+
1800 = 2160 vials.A comparison of the frequencies of Y,'and B"Y chromo- somes at generations 1 and 2 reflect differences in net effects on fitness of the two Y chromosomes. Estimates of fitness were obtained from a maximum likelihood model described in RESULTS, and these estimates were analyzed by analysis of variance, fitting the following model:
Y,,kl = /.t -k y, R ,
+
D g h t t $ lwhere Y,k[ is the observation of the Ith vial of the kth
duplicate of the jth replicate of the ith Y chromosome. T h e replicate effect, R,, is nested within Y chromosomes, and the duplicate effect, &, is nested within replicates and Y chro- mosomes. All the effects are random, and t is a random
error term.
Deterministic model of Y autosomal effects on fertility:
Y Chromosome Fertility Effects
TABLE 1
Means, standard errors and sample sizes of fertility estimates
Male fertility Net male fitness
Line N
R1 R2 R3 R4 R5 R6 R7 R 8 R9 R10 R11 R12 R13 R14 R15 R16 R17 R18 R19 R20 R2 1 R22 R23 R24 R25 AH41 AH 198
Eg- 1 Fan6 GB13 GB4 1 Hikone Samark St-4 Wd-4 Wd-7
1 1,393 12,090 10,952 13,122 11.194 10,765
1 1,057 9,966 10,867
1 1,597 10,462 11,106 8,4 12 10,675 12,035 9,652 8,992 1 1,553 13,539 10,856 10,617 10,632 12,069 9,378 1 0 3 7 1 13,153 11,918 6,986 9,796 10,582 9,362 8,930 11,875 10,851 9,629 10,056
(mean fecundity) Log
2.515 f 0.214 2.934 f 0.163 2.501 f 0.211 2.744 f 0.221 2.661 f 0.174 2.408 f 0.255 2.655 f 0.157 2.538 f 0.182 2.581 f 0.188 2.633 f 0.196 2.51 I f 0.165 2.630 f 0.182 2.125 f 0.192 2.672 f 0.165 2.87 1 f 0.166 2.487 f 0.180 2.397 f 0.195 2.804 f 0.167 3.2 17 f 0.096 2.619 f 0.203 2.473 f 0.209 2.580 f 0.184 2.741 f 0.204 2.589 f 0.183 2.640 zk 0.178 2.813 f 0.205 2.735 f 0.193 2.076 f 0.193 2.598 f 0.184 2.553 f 0.188 2.462 f 0.187 2.295 f 0.222 2.736 f 0.194 2.627 f 0.185 2.395 f 0.200 2.277 f 0.198
Virility
1.174 f 0.061 1.276 f 0.054 1.154 f 0.061 1.195 k 0.059 1.226 f 0.049 1.131 f 0.082 1.201 f 0.053 1.196 f 0.062 1.193 f 0.056 1.191 f 0.062 1.190 f 0.056 1.204 f 0.056 1.034 f 0.062 1.242 f 0.059 1.297 f 0.055 1.199 f 0.056 1.152 f 0.068 1.258 f 0.052 1.357 f 0.033 1.189 f 0.064 1.111 f 0.073 1.174 f 0.061 1.230 f 0.062 1.175 f 0.075 1.249 f 0.063 1.244 f 0.062 1.206 f 0.060 1.102 k 0.067 1.214 f 0.060 1.202 f 0.055 1.190 f 0.055 1.143 f 0.067 1.204 f 0.062 1.236 f 0.059 1.146 f 0.064 1.080 f 0.066
N (fitness) Log
2,650 3,251 2,372 2,781 3,972 3,025 3,342 4,383 2,549 2,875 3,082 4,168 2,544 3,984 3,003 3,444 3,680 3,480 3,571 3,513 2,316 2,752 3,491 2,862 3,277 3,318 3,870 1,133 2,628 3,455 3,439 1,865 2,360 3,236 3,717 4,057
0.084 f 0.127 0.163 f 0.145 0.006 f 0.1 17 0.031 f 0.139 0.207 f 0.060 0.247 f 0.168 0.079 f 0.048 0.183 f 0.095 0.052 f 0.067 0.172 f 0.109 0.157 f 0.140 0.239 f 0.084 0.048 f 0.137 0.107 f 0.095 0.159 f 0.064 0.240 f 0.091 0 . 1 6 6 f 0.120 0.205 -C 0.049 0.181 f 0.084 0.038 f 0.116 0.068 f 0.136 0.074 f 0.1 15 0.01 1 f 0.083 0.014 f 0.086 0.217 f 0.066 0.045 f 0.146 0.013 f 0.092 0.350 f 0.191 0.128 f 0.220 0.002 f 0.084 0.173 f 0.070 0.115
*
0.121 0.234 f 0.135 0.234 f 0.15 10.138 f 0.128 0.039 f 0.083
~~ ~
Mean fecundity is reported as the log of the mean number of offspring per female, and virility is the arcsine transformed fraction of inseminated females.
alleles. This results in six male genotypes, whose fertility may be written:
Y Y
AA
5 1
fi2AU f;L1 jk ua f3l f 3 2
In the absence of selection, when all fertilities are 1, the recursions for the frequencies of the four gametic types are identical to those for a model with cytoplasmic variation and one autosomal locus (CLARK 1984). With selection, however, the models differ. A recursion system having one equation for each of the six genotypes can be written directly from a mating table. This recursion system produces the same frequency dynamics as the following system of four equa- tions, which specifies the frequencies of the four gametic types:
FsI’ = sl[(Sl
+
sZ)fll+
%(s3+
s4)f21] %s3(sI+
s2)fzIwhere sl, s2, s3 and s4 are the frequ_encies of the gametes AY, Ay, uY and uy, respectively, and F is the sum of the right hand sides. There are six trivial equilibria to this model, including the four fixation states and the two “edge” equi- libria having an autosomal polymorphism but fixed for one or the other Y chromosome. Analysis of local stability and numerical simulations were done to assess the ability of such a system to maintain Y chromosome polymorphism.
RESULTS
Male fertility: T w o components of male fertility
530 A. G. Clark
0 0
Y chromosome line
FIGURE 1 .-Means & 1 SE of the log transformed mean fecundi- ties of n~ales from the 36 Y replacement lines. Each pair of bars represents the Hanuich (left) and Roth-15 (right) male genetic back- ground for the given Y chromosome. T h e first 25 bars are the 25 Rothrock Y chromosomes, and the 11 rightmost bars are the lines of diverse geographic origin. T h e lines are in the same order as in Table 1.
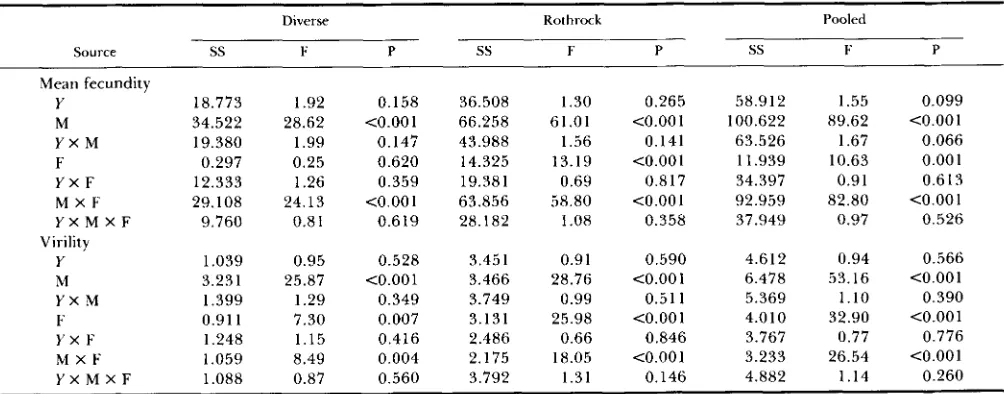
were inseminated indicated the virility of the males, and this statistic was arcsine transformed to make the means independent of the variances. T h e mean num- ber of offspring per female sired by the male was a measure of the fecundity of the mating, and since the female genotype was common within a background, differences among matings reflect variation in male fecundity. Log transformation of mean fecundity data was found to best stabilize variances. T h e means of these two components are given for each line in Table 1, and a plot of the mean fecundity appears in Figure 1. The experiment was performed with each sex hav- ing two different genetic backgrounds, and the influ- ence of each genetic background on fecundity could be accurately assessed. T o test the significance of Y
chromosome and background effects on fecundity and virility, the linear model described in MATERIALS AND METHODS was fitted to the data. T h e results of this analysis of variance appear in Table
2.
Analyses were done separately for each component, and separately for the 11 lines of diverse geographic origin, the 25 lines whose Y chromosome originated from the Roth- rock State Forest in Pennsylvania, and the complete set of 36 lines. T h e two components yielded the same result: all of the background effects were highly sig- nificant, and none of the Y chromosome effects or interactions was significant. T h e only exception to this pattern was the lack of significance of the female background effect in mean fecundity among the di- verse lines.T h e failure to find any quantitative effect of Y chromosome variation on male fertility must be inter- preted in light of the sensitivity of the experiment to detect such variation. This was a large experiment, with over 10,000 flies scored for each line, and a total sample size of 387,090. T h e observation that with only one exception, every opportunity to detect an effect of the genetic background on both fertility components revealed highly significant effects indi- cates that the design could detect genetic differences in both fertility components. T h e pooled standard errors of transformed virility and fecundity were 0.058 and 0.176, which represent 4.8% and 6.1% of the respective normalized means. When the analysis of variance was repeated on untransformed mean fecundity and virility data, as well as total fecundity (number of progeny sired by each male), the Y chro- mosome effects remained insignificant.
TABLE 2
Analysis of variance of male fecundity data
Diverse Rothrock Pooled
Source ss F P ss F P SS F P
Mean fecundity
Y 18.773 1.92 0.158 36.508 1.30 0.265 58.912 1.55 0.099
M 34.522 28.62 <0.001 66.258 61.01 <0.001 100.622 89.62 <0.001
Y X M 19.380 1.99 0.147 43.988 1.56 0.141 63.526 1.67 0.066
F 0.297 0.25 0.620 14.325 13.19 <0.001 11.939 10.63 0.00 1
Y X F 12.333 1.26 0.359 19.381 0.69 0.817 34.397 0.91 0.6 13 M X F 29.108 24.13 <0.001 63.856 58.80 <0.001 92.959 82.80 <0.001 Y X M X F 9.760 0.8 1 0.619 28.182 1.08 0.358 37.949 0.97 0.526 Virility
Y 1.039 0.95 0.528 3.45 1 0.91 0.590 4.612 0.94 0.566
M 3.231 25.87 <0.001 3.466 28.76 <0.001 6.478 53.16 <0.001
F 0.91 1 7.30 0.007 3.131 25.98 <0.001 4.010 32.90 <0.001 Y X F 1.248 1.15 0.416 2.486 0.66 0.846 3.767 0.77 0.776
Y X M 1.399 1.29 0.349 3.749 0.99 0.51 1 5.369 1.10 0.390
M X F 1.059 8.49 0.004 2.175 18.05 <0.001 3.233 26.54 <0.001 Y X M X F 1.088 0.87 0.560 3.792 1.31 0.146 4.882 1.14 0.260
~~
Analyses of variance were done for the 11 lines of diverse origin, the 25 Rothrock lines, and the pooled set of 36 lines separately. Sums
Y
I
Effects 1
Y chromosome line
FIGURE 2,"M ean s & 1 SE of the log-transformed fitness of males from the 36 Y replacement lines estimated by competition with b y .
O n l y the Roth-I5 genetic background was examined. T h e first 25 bars are the 25 Rothrock Y chromosomes, and the 1 I rightmost bars are the lines of diverse geographic origin, as in Figure 1.
Net male fitness: T h e test of male fitness using the
BSY yielded counts of progeny at two times, spanning one complete generation. If the counts from the gen- eration 1 data are n1 of the Y+ and 722 of the BSY, and the respective counts at generation
2
are n3 and n4, then we can define the frequencies of Y+ at the two generations aspl
= nl/(nl+
n2)P l W
p2 = p l w
+
(1-
p i )where w is the relative fitness of the
F
chromosome. T h e likelihood of the sample isL = p23( 1
-
f12)~4,After substituting, the derivative of the logarithm of the likelihood is
" d log(L) -wn1n4
-
n2n3dw wn2
+
w2nlwhich yields a maximum likelihood estimator for w of
i
= n2n3/n1n4.Interestingly, the Y chromosome exhibits haploid transmission, and a means of estimating relative fitness in bacterial cultures is to calculate the slope of the regression of log( p / q ) against time, where
p
and q are the frequencies of two competing strains (KUBITSCHEK 1974). T h e equivalence of this measure of fitness andzi can be seen by taking the logarithm of zi, which can be expressed as log(p'/q')
-
log(p/q), wherep
is the frequency of Y' and q is the frequency of P Y . This is the slope of the line of log(p/q) plotted against gen- erations.For each combination of Y chromosome, replicate and duplicate estimates of log($) were calculated. T h e means and standard errors of these measures appear in Table 1, and Figure
2
presents a graph of theestimates. T h e nested analysis of variance was per- formed as described above, and results are presented in Table 3. T h e results can again be succinctly sum- marized: there was no evidence for a Y chromosome effect. T h e significant duplicate effects, which repre- sent one level of sampling error, indicate that the allele frequencies of the two duplicates could be de- tected as different when data from five descendant vials of each duplicate were scored. In this study 11 3,445 flies were scored, and the pooled standard error was 0.084, or 7.8% of the normalized mean fitness.
Y
autosome fertility model: T h e development of amodel allowing Yautosome interactions was motivated by the observation that the Y X male background effect was weakly significant ( P = 0.066) in the mean fecundity of the pooled data (Table
2).
T h e analysis of the local stability of the equilibrium with fixation of the AY gamete(il
= 1) proceeds by calculating the Jacobian matrix of partial derivatives evaluated at this point and solving the characteristic equation of this matrix. T h e characteristic equation is:( f i 2 / f i l
-
X) ( f Z l / f i l-
X) (f22/2fi1-
X) = 0having the roots O,f22/2fil,f21/'1 andfiZ/fil. If all of these roots are less than one, then this fixation is stable. Similarly, the conditions for the stability of the other three fixations are:
Equilibrium Stability conditions
i 2 = 0 f i l / f i 2
<
l,f21/2fi2<
1, andf22/fi2<
1i,
= 0 f21/f31 1, f22/2f1 1 , a n d f d j i l 1i 4 = 0 f21/2f2
<
1,f22#32<
1, and f31/f32<
1In addition to the four fixations, there are two edge equilibria that maintain a polymorphism at the auto- somal locus. T h e s1
-
s3 edge has an equilibrium atf 1 -f21
f i l
-
2f21 + f lSI =
532 A . G. Clark
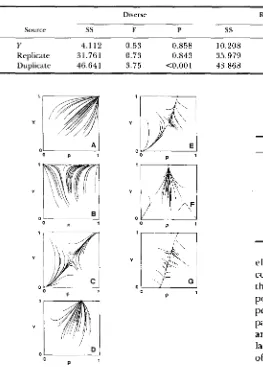
TABLE 3
Analysis of variance of net male fitness
~ ~~ ~ ~ ~~ ~~ ~~ ~
Diverse Rothrock Pooled
Source ss F P SS F P ss F P
Y 4.112 0.53 0.858 10.208 1.12 0.335 15.087 0.87 0.683 Replicate 31.761 0.73 0.843 35.979 0.8 1 0.844 67.739 0.76 0.946 Duplicate 46.641 3.75 <0.001 43.868 1.90 <0.001 90.509 2.55 <0.001
1
Y
0 0
P 1
FIGURE 3,"Phase planes showing all seven possible qualitative behaviors of the Y autosome model. The X axis represents the frequency of the A autosomal allele, and the Y axis is the frequency of the Y allele. For each panel, one set of fitnesses is given and 30 random starting points were iterated until the population attained an equilibrium. No case with a stable interior equilibrium was found.
A. One corner stable ( f i l = l , h 1 = 0.9,jil = 0.8,fiz = 0 . 9 , h ~ =
0.8, j 3 n = 0.7). B. Two corners with same Y stable (fi I = 1 , f . l l =
0.9,Al = 0 . 9 5 , f i 2 = 0.8,f.Ln = 0.9,f& = 0.9). C. Two opposite corners stable (fi I = 1 ,f21 = 0.9,jil = 0.8,fiz = 0.8,hn = O.9,jin =
1). D. One edge stable ( f 1 1 = O.9,f21 = 1,f.l~ = O . 8 , f ~ z = 0 . 9 , f r ~ =
0.8,f3:! = 0.9). E. One edge and one opposite corner stable ( f i t =
0.9,f21 = l . p l = 0.8,fln = 0.9,f22 = 0.9,fv2 = 1). F. One edge and two opposite corners stable ( f i l = l , f 2 ] = 1.1,jil = 1 , f i z = 1.05. f p L = l , f 3 p = 1.05). G. Two opposite edges stable
(51
= 0.9,h1 =1 . f . l = 0 . 8 , f i z = 0 . 8 , f L = 1 . p ~ = 0.9).
the recursion system was followed for another 100,000 random fertility matrices, and each case was iterated until the frequency of the Y-linked allele was either greater than 0.9999 or less than 0.0001. This happened in all cases, suggesting that not only is it impossible to protect a polymorphism, but also that there are no stable interior equilibria.
DISCUSSION
The experiments reported here failed to detect significant variation among 36 Ychromosomes in their
TABLE 4
Results of numerical simulations of the Y autosome fertility model
Equilibrium Frequency
A. One corner 20,979
B. Two corners, same Y 20,717
C. Two diagonally opposed corners 21,539 D. One edge autosomal polymorphism 15,780 E. One edge and opposite fixation 15,748 F. One edge and both opposite fixations 3,992
G. Both autosomal edges 1,245
Total 100,000
effects on male fertility or on net male fitness. This conclusion gains credence when it is recognized that the tests were large enough to have the statistical power to detect differences in fitness of just a few percent. Natural selection may have a significant im- pact on allele frequencies if the selection coefficients are larger than the reciprocal of the effective popu- lation size. T h e experiments do not achieve this level of precision, which means that despite the negative result, there may still be genetic variation among naturally occurring Y chromosomes that is influenced by selection. T h e rate of fixation of Y-linked variants with a given magnitude of selective effect can be much greater than that of autosomes (CHARLESWORTH,
COYNE and BARTON 1987), leaving a smaller oppor-
tunity to detect transient Y-linked polymorphism with differences in fitness. T h e experiments reported here, which involved scoring 500,535 flies, were easily large enough to detect significant variation among X chro- mosomes (CURTSINGER 1984) or among second chro- mosomes (SEAGER and AYALA 1982; CLARK 1986). Regardless of the true magnitude of variation in male fitness, the Y chromosome clearly exhibits far less variation than other chromosomes.
These results are consistent with simple population genetic theory which finds it difficult to maintain stable Y-linked polymorphism (CLARK 1987b). T h e failure to detect variation among geographically di- verse populations may be more surprising. In a suffi- ciently subdivided population, one would expect the rapid fixation of favorable mutations to result in strong subdivision of Y-linked variation. Data of WIL-
Y Chromosome Fertility Effects 533
array. T h e magnitude of subdivision of Y chromo- somes that differ in fitness will depend on the popu- lation sizes, on the rates of adaptive mutation, and gene flow, but there is need for formal theory on this problem. With an average FST of autosomal and X- linked genes of 0.1 16 f 0.130 and 0.153 f 0.159, respectively (SINGH and RHOMBERG 1987), we might expect molecular Y-linked variation to exhibit subdi- vision, but no prediction can be made about subdivi- sion of selectively different variants.
Our test of male fertility could have revealed dif- ferences due to several different components of fit- ness, including mating speed, remating latency, amount of sperm transferred, and possibly sperm competition. Although the genes on the Y chromo- some have functions relating to sperm maturation, variation in those genes might result in sperm having, for example, different properties of sperm competi- tion (PROUT and BUNDGAARD 1977). Models that in- corporate more biological complexity are often better able to maintain polymorphism. For example, stable Y-linked polymorphism can be maintained under some restrictive conditions of mating success, sperm dis- placement, refractory period and viability (T. PROUT, personal communication). T h e variance in the net effects of components of male fertility may be greater than or less than the variance in any single component, because natural selection may maintain a low level of net fitness with variants having antagonistic tradeoffs among components. This motivates the study of the individual components, particularly those that might be related to sperm maturation including sperm com- petition.
Significant variation was detected among the same set of Y chromosomes in their segregation properties
(CLARK 1987b), and the reason these differences were
not detected in the assay of net fitness probably lies in the increased statistical power of that study. Although the magnitude of variation that was detected amounted to only a 3% deviation in segregation val- ues, this level was clearly larger than 1/N for Dro- sophila populations. T h e maintenance of such varia- tion is likely to be transient, since the introduction of a mutant Y chromosome with a 3% advantage should result in a change in frequency from 0.01 to 0.99 in 3 1 1 generations. One mechanism for maintaining sta- ble Y-linked polymorphisms requires recombination with the X (CLARK 1 988), and although X-Y exchanges are rare in Drosophila, they may have important con- sequences in the maintenance of Y-linked variation.
One biological complication that cannot stabilize a Y-linked polymorphism is interaction with the auto- somes, exemplified by the model presented above. Interactions between autosomes and the Y chromo- some in effects on male fertility have been docu- mented in Drosophila mojavensis X Drosophila arizonen- sis hybrids (VIGNEAULT and ZOUROS 19S6), and the
specificity of the interaction has been demonstrated
by mapping an autosomal factor responsible for the hybrid sterility (PANTAZIDIS and ZOUROS 1988). Pop- ulation genetic theory of Y-autosome interaction in hybrid sterility fails to recover conditions for Y poly- morphism, and this property, along with the rapid fixation of alternate Y chromosome types, has sug- gested the possible importance of Y-autosome inter- actions in speciation (ZOUROS 1986). Whether Y-au- tosome interactions provide a general explanation of Haldane’s rule for hybrid male sterility has been ques- tioned by COYNE (1985), who found that among hy- brids of species in the melanogaster group, X-Y mis- matches always produced immotile sperm, while Y- autosome mismatches often had motile sperm. With respect to the maintenance of intraspecific Y chro- mosomal polymorphism, Y-autosome interactions may have an influence on the duration of transient poly- morphism, but the formal theory remains to be done.
I thank T. PROUT for suggesting the use of a marked Y chro- mosome in estimating fitness, and E. ZouRos for discussion con- cerning the theory of Y-autosome interactions. NANCY DOUGHERTY, SHARYN HOUTZ, LISA KEITH, EVA LYCKEGAARD, ANDY MERRI- WETHER, FRAN SZUMSKI and JOHN VIAROPULOS provided excellent technical assistance. This study was supported by grants HD00743 and HD21963 from the U.S. National Institutes of Health.
LITERATURE CITED
BROSSEAU, G. E., 1960 Genetic analysis of the male fertility factors on the Y chromosome of Drosophila melanogaster. Genetics 45:
CHARLESWORTH, B., J. A. COYNE and N. H. BARTON, 1987 The relative rates of evolution of sex chromosomes and autosomes. Am. Nat. 1 3 0 113-146.
CLARK, A. G., 1984 Natural selection with nuclear and cyto- plasmic transmission. I. A deterministic model. Genetics 107:
679-701.
CLARK, A. G . , 1986 Partitioning genetic variation in viability among lines of Drosophila. Am. Nat. 128: 263-27 1.
CLARK, A. G., 1987a Variation in Y chromosome segregation in natural populations of Drosophila melanogaster. Genetics 115:
CLARK, A. G., 1987b Natural selection and Y-linked polymor- phism. Genetics 115: 568-577.
CLARK, A. G., 1988 The evolution of the Y chromosome with X -
Y recombination. Genetics 1 1 9 71 1-720.
CLUSTER, P. D., D. MARINKOVIC, R. W . ALLARD and F. J. AYALA, 1987 Correlations between developmental rates, enzyme ac- tivities, ribosomal DNA spacer-length phenotypes, and adap- tation in Drosophila melanogaster. Proc. Natl. Acad. Sci. USA
84:6 10-6 14.
COYNE, J. A., 1985 The genetic basis of Haldane’s rule. Nature
314: 7346-738.
CURTSINGER, J. W . , 1984 Components of selection in X chromo- some lines of Drosophila melanogaster: sex ratio modification by meiotic drive and viability selection. Genetics 108: 941-952. DIMITRI, P., and C. PISANO, 1989 Position effect variegation in
Drosophila melanogaster: relationship between suppression ef- fect and the amount of Y chromosome. Genetics 122: 793- 800.
FRANKHAM, R . , D. A. BRISCOEand R. K. NURTHEN, 1980 Unequal crossing over at the rRNA tandon as a source of quantitative genetic variation in Drosophila. Genetics 95: 727-742.
257-274.
534 A . G. Clark
GATTI, M., and S . PIMPINELLI, 1983 Cytological and genetic analy- sis of the Y chromosome of Drosophila melanogaster. 1. Organi- zation of the fertility factors. Chromosoma 88: 349-373.
KOMMA, D. J . , and S. A. ENDOW, 1986 Magnification of the ribosomal genes in female Drosophila melanogaster. Genetics
114: 859-874.
KOMMA, D. J., and S. A. ENDOW, 1987 Incomplete Ychromosomes promote magnification in male and female Drosophila. Proc. Natl. Acad. Sci. USA 84: 2382-2386.
KUBITSCHEK, H. E., 1974 Operation of selection pressure on microbial populations, pp. 105-1 30 in Evolution in the Microbial World. Cambridge University Press, Cambridge.
I-INDSLEY, D. L., c .
w.
EDINcToNand E.s.
VON HALLE, 1960 Sex- linked recessive lethals in Drosophila whose expression is sup- pressed by the Y chromosome. Genetics 45: 1650-1670.LYCKEGAARD, E. M. S., and A. G . CLARK, 1989 Ribosomal DNA and Ste copy number variation on the Y chromosome of Dro- sophila melanogaster. Proc. Natl. Acad. Sci. USA 86: 1944- 1948.
MCKEE, B. D., and G. H. KARPEN, 1990 Drosophila ribosomal RNA genes function as an X-Y pairing site during male meiosis.
Cell 61: 61-72.
MCKEE, B., and D. L. LINDSLEY, 1987 Inseparability of X-heter- ochronlatic functions for XY pairing, meiotic drive and male fertility in Drosophila melanogaster. Genetics 116399-407.
PANTATIDIS, A. C., and E. ZOUROS, 1988 Location o f a n autosomal factor causing sterility in Drosophila mojavensis males carrying the Drosophila arizonensis Y chromosome. Heredity 60: 299- 304.
PROUT, T., and J. BUNDGAARD, 1977 Population genetics ofsperm
SEAGER, R. D., and A. J. AYALA, 1982 Chromosome interactions displacement. Genetics 85: 95-1 24.
in Drosophila melanogaster. I . Viability studies. Genetics 102:
SINGH, R. S . , and L. R. RHOMBERG, 1987 A comprehensive study of genic variation in natural populations of Drosophila malano- gaster. 11. Estimates of heterozygosity and patterns of geo-
graphic differentiation. Genetics 117: 255-27 1 .
SPOFFORD, J., 1976 Position effect variegation, pp. 955-1019 in
The Genetics and Biology of Drosophila, Vol. IC, edited by M. ASHBURNER and E. NOVITSKI. Academic Press, New York.
TORO, M. A., and B. CHARLESWORTH, 1982 An attempt to detect genetic variation in sex ratio in Drosophila melanogaster. Hered- ity 49: 199-209.
VIGNEAULT, G., and E. ZOUROS, 1986 T h e genetics of asymmetrical male sterility in Drosophila mojauensis and Drosophila arizonensis
hybrids: interactions between the Y chromosome and auto- somes. Evolution 4 0 1 160-1 170.
VOELKER, R. A,, 1972 Preliminary characterization of “sex ratio” and rediscovery and reinterpretation of “male sex ratio” in
Drosophila affinis. Evolution 71: 597-606.
VOELKER, R. A,, and K.-I. KOJIMA, 1971 Fertility and fitness of X 0 males in Drosophila. 1. Qualitative study. Evolution 25:
119-128.
WILLIAMSON, J . H., 1976 T h e genetics of the Y chromosome, pp.
667-699 in The Genetics and Biology of Drosophila, Vol. Ib, edited by M . ASHBURNER and E. NOVITSKI. Academic Press, New York.
WILLIAMS, S. M., G. R. FURNIER, E. Fuoc and C. STROBECK,
1987 Evolution of the ribosomal DNA spacers of Drosophila melanogaster: different patterns of variation on X and Y chro- mosomes. Genetics 116: 225-232.
ZOUROS, E., 1986 A model for the evolution of asymmetrical male hybrid sterility and its implications for speciation. Evolution
4 0 1171-1 184. 467-483.