University of Windsor University of Windsor
Scholarship at UWindsor
Scholarship at UWindsor
Electronic Theses and Dissertations Theses, Dissertations, and Major Papers
2019
Vortex Induced Convective Heat Transfer Augmentation
Vortex Induced Convective Heat Transfer Augmentation
Junguo Wang University of Windsor
Follow this and additional works at: https://scholar.uwindsor.ca/etd
Part of the Mechanical Engineering Commons
Recommended Citation Recommended Citation
Wang, Junguo, "Vortex Induced Convective Heat Transfer Augmentation" (2019). Electronic Theses and Dissertations. 7669.
https://scholar.uwindsor.ca/etd/7669
This online database contains the full-text of PhD dissertations and Masters’ theses of University of Windsor students from 1954 forward. These documents are made available for personal study and research purposes only, in accordance with the Canadian Copyright Act and the Creative Commons license—CC BY-NC-ND (Attribution, Non-Commercial, No Derivative Works). Under this license, works must always be attributed to the copyright holder (original author), cannot be used for any commercial purposes, and may not be altered. Any other use would require the permission of the copyright holder. Students may inquire about withdrawing their dissertation and/or thesis from this database. For additional inquiries, please contact the repository administrator via email
Vortex Induced Convective Heat Transfer Augmentation
By
Junguo Wang
A Thesis
Submitted to the Faculty of Graduate Studies
through the Department of Mechanical, Automotive, and Materials Engineering in Partial Fulfillment of the Requirements for
the Degree of Master of Applied Science at the University of Windsor
Windsor, Ontario, Canada
2019
Vortex Induced Convective Heat Transfer Augmentation
by
Junguo Wang
APPROVED BY:
____________________________________________ S. Ray
Essex Energy Corporation
______________________________________________ R. Carriveau
Department of Civil and Environmental Engineering
______________________________________________ V. Stoilov
Department of Mechanical, Automotive, and Materials Engineering
____________________________________________ D.S-K. Ting, Advisor
Department of Mechanical, Automotive, and Materials Engineering
iii
DECLARATION OF ORIGINALITY
I hereby certify that I am the sole author of this thesis and that no part of this
thesis has been published or submitted for publication.
I certify that, to the best of my knowledge, my thesis does not infringe upon
anyone’s copyright nor violate any proprietary rights and that any ideas, techniques,
quotations, or any other material from the work of other people included in my
thesis, published or otherwise, are fully acknowledged in accordance with the
standard referencing practices. Furthermore, to the extent that I have included
copyrighted material that surpasses the bounds of fair dealing within the meaning of
the Canada Copyright Act, I certify that I have obtained a written permission from
the copyright owner(s) to include such material(s) in my thesis and have included
copies of such copyright clearances to my appendix.
I declare that this is a true copy of my thesis, including any final revisions,
as approved by my thesis committee and the Graduate Studies office, and that this
thesis has not been submitted for a higher degree to any other University or
iv ABSTRACT
Delta winglet is an effective means to passively augment heat convection from a hot
surface such as a solar panel. The effects of an inclination angle on the flow
downstream of the winglet were studied. A delta winglet with an aspect ratio (c/h)
of 2 and an attack angle of 30 degrees was mounted on a flat plate to scrutinize the
role of its inclination angle (90 and 120) on the flow downstream. The inclined
winglet was placed in a wind tunnel, and the flow was measured by the hotwire. The
experiment shows the 120-degree-inclination-angle delta winglet can generate an
inflow velocity larger than 90 degrees. The heat transfer enhancement caused by the
delta winglet was then investigated. Three different inclination angles (60, 90 and
120) of the delta winglet were studied, and a thermal camera was used to maintain
the heat transfer enhancement of the heated panel. The result shows that the delta
winglet with the inclination angle of 120 degrees can generate the best thermal
performance.
v
DEDICATION
vi
ACKNOWLEDGEMENTS
First, I would like to thank Dr. David S-K. Ting for his scrupulous supervision
throughout my MASc pursuit. I want to thank Mr. Steve Ray for his meticulous
support on this project. I am most grateful to Dr. Carriveau and Dr. Stoilov for
providing valuable suggestions which drastically improve this thesis.
This work was made possible by Natural Sciences and Engineering Research
vii
TABLE OF CONTENTS
DECLARATION OF ORIGINALITY ... iii
ABSTRACT ... iv
DEDICATION ... v
ACKNOWLEDGEMENTS ... vi
LIST OF FIGURES ... ix
LIST OF APPENDICES ... xii
CHAPTER 1 INTRODUCTION ... 1
1.1 Motivation and Background ... 1
1.2 Thesis Objective and Overview ... 2
CHAPTER 2 THE EFFECT OF DELTA WINGLET INCLINATION ANGLE ON THE VORTICAL FLOW DOWNSTREAM... 6
2.1 Introduction ... 6
2.2 Nomenclature ... 7
2.3 Experimentation ... 9
2.4 Data Analysis ... 10
2.5 Results and Discussion ... 14
2.5.1 Vortex Structure ... 14
2.5.2 Turbulent intensity ... 22
2.5.3 Integral Scale ... 25
2.5.4 Taylor Microscale ... 27
2.6 Conclusion ... 29
viii
References ... 30
CHAPTER 3 THE ROLE OF DELTA WINGLET INCLINATION ANGLE ON HEAT TRANSFER ENHANCEMENT ... 34
3.1 Introduction ... 34
3.2 Nomenclature ... 35
3.3 Experimentation ... 38
3.4 Data Analysis ... 40
3.5 Results and Discussion ... 43
3.5.1 Heat Transfer ... 43
3.5.2 Flow Field ... 52
3.6 Conclusion ... 59
Acknowledgement ... 59
References ... 59
CHAPTER 4 CONCLUSIONS ... 64
4.1 Summary and conclusions ... 64
4.2 Recommendations ... 65
APPENDICES ... 67
ix
LIST OF FIGURES
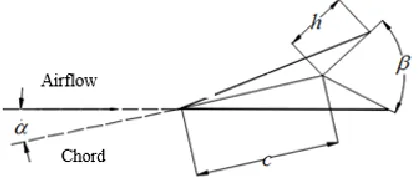
Figure 2. 1 The delta winglet model; c = chord length, h = winglet height, 𝛂 =
attack angle. ... 9
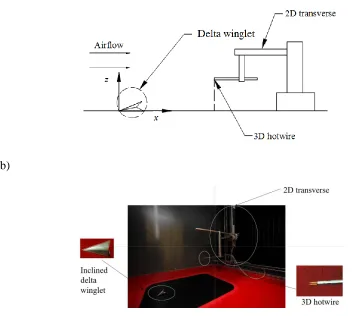
Figure 2. 2 (a) The experiment setup plan, (b) photos detailing the experimental
setup. ... 10
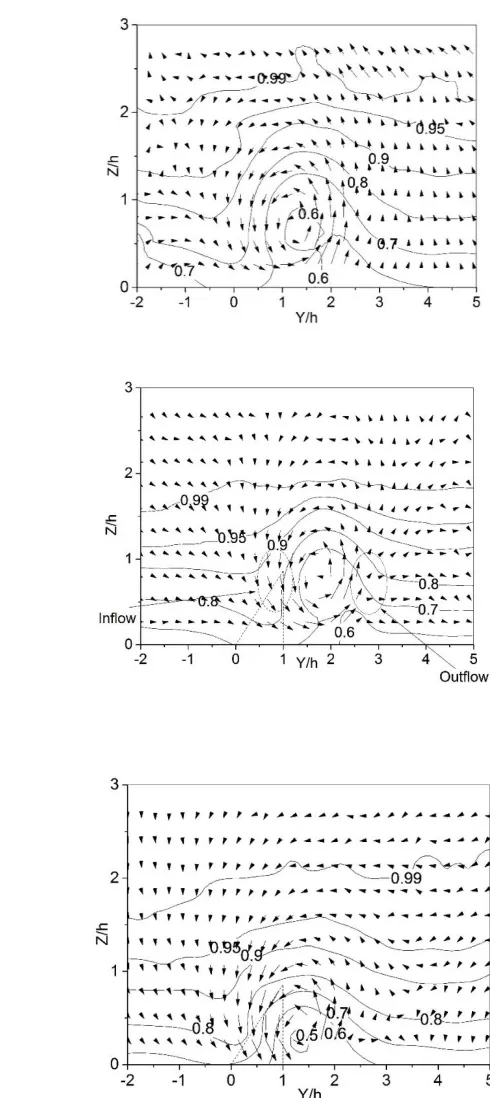
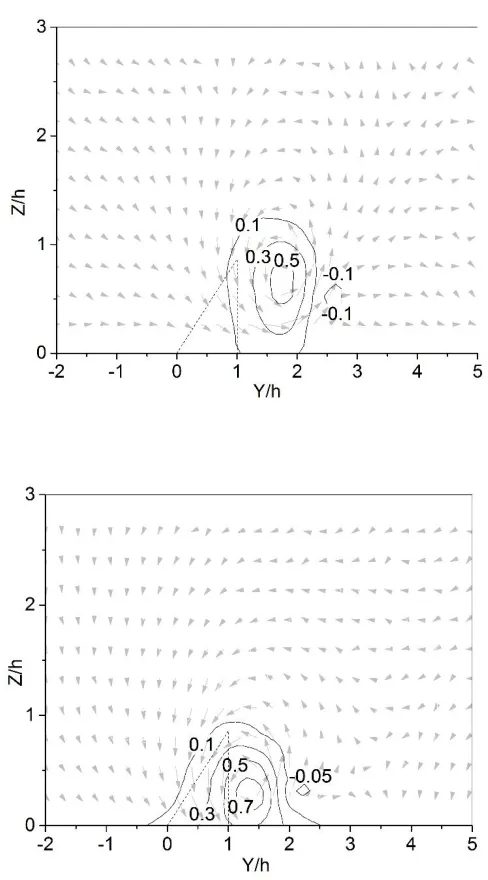
Figure 2. 3 Velocity vectors in the YZ plane and stream-wise time-averaged
velocity contours normalized by 𝑈∞at (a) 13h (200mm) downstream with β =
90°, (b) 13h (200mm) downstream with β = 120°, (c) 6.7h (100mm)
downstream with 𝛽 = 120°. ... 16
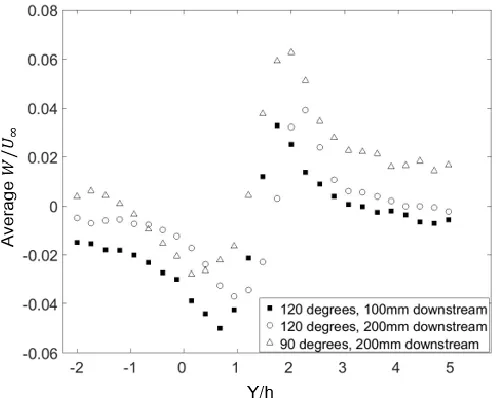
Figure 2. 4 Average of W/U∞ in the Y direction. ... 18
Figure 2. 5 Stream-wise velocity normalized by the freestream velocity in the
center of the vortex (Y/h=1.2, when β = 90°, 200mm downstream; Y/h = 1.7,
when β = 120°, 200mm downstream; Y/h = 1.4, when β = 120°, 100mm
downstream). ... 20
Figure 2. 6 Cross-stream vorticity contours at (a) 13h (200mm) downstream, β =
90°, (b) 13h (200mm) downstream, β = 120°, (c) 6.7h (100mm) downstream,
β = 120° ... 21
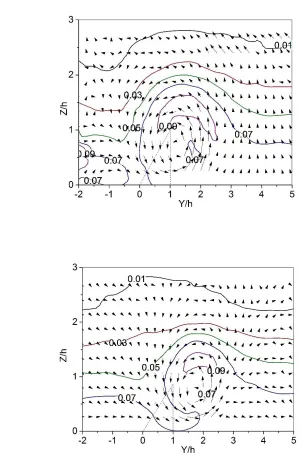
Figure 2. 7 Turbulent intensity in the stream-wise direction (Tu) and velocity
vectors in the YZ plane at 13h (200mm) downstream (a) β = 90°, (b) β = 120°. 23
Figure 2. 8 Normalized stream-wise turbulent kinetic energy and velocity vectors
in the YZ plane at 13h (200mm) downstream (a) β = 90°, (b) β = 120°. ... 24
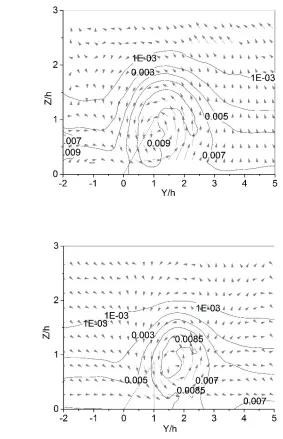
Figure 2. 9 Stream-wise integral scale normalized by h contours at 13h (200 mm)
x
Figure 2. 10 Contours of stream-wise Taylor microscale normalized by h at 13h
(200 mm) downstream (a) β = 90°, (b) β = 120°. ... 28
Figure 3. 1. The delta winglet model; chord length, c = 30 mm, winglet height, h =
15 mm, attack angle, α = 30 degrees, inclination angle, = 60, 90, 120. ... 38
Figure 3. 2. The experiment setup ... 40
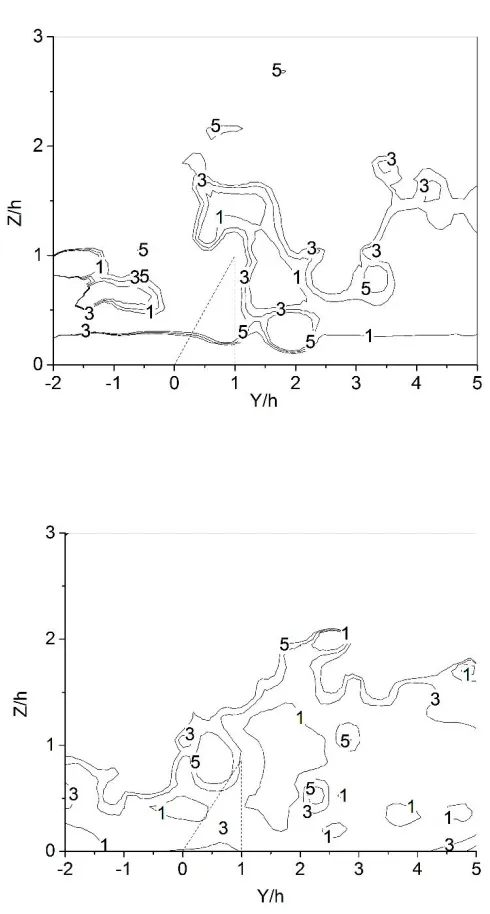
Figure 3. 3. The effect of inclination angle (a) 60 (b) 90 and (c) 120 on Nu/Nu0
distribution. ... 45
Figure 3. 4. The effect of the inclination angle (60, 90, 120) on the
cross-sectional Nu/Nu0 profile at (a) X = 3h, (b) X = 8h, (c) X = 13h... 48
Figure 3. 5. The summit and valley Nu/Nu0 in the Y direction with respect to
downstream distance. ... 50
Figure 3. 6. Averaged Nu/Nu0 with the respect to downstream distance (a) average
between Y/h = 0 to 1, (b) average between Y/h = -2 to 2. ... 51
Figure 3. 7. Velocity vectors in the YZ plane and cross-stream non-dimensional
vorticity (Ω) contours at 13h (200mm) downstream, (a) β = 60, (b) β = 90, (c) β
= 120 . ... 53
Figure 3. 8. W/U∞, averaged from Z/h 0.2 to 2, versus Y/h. ... 55
Figure 3. 9. Velocity vectors in YZ plane and stream-wise time-averaged velocity
contours normalized by U∞ (7m/s) at 13h (200mm) downstream, (a) β = 60, (b) β
xi
Figure 3. 10. Average of turbulent kinetic energy (Z/h ≤ 2) in the Y direction at X
= 13h. ... 58
Figure B. 1 Averaged Nu/Nu0 with the respect to downstream distance average
between Y/h = -2 to 2 ... 71
Figure D. 1 Normalized Nusselt numbers averaged from Y/h = -2 to Y/h = 2 and
xii
LIST OF APPENDICES
Appendix A Uncertainty Analysis ... 67
Appendix B The Effect of Reynolds Number on Heat Transfer ... 71
Appendix C Efficiency Enhancement Analysis ... 73
Appendix D Heat transfer enhancement with different inclination angle from 30 to
150 degrees ... 74
1 CHAPTER 1
INTRODUCTION
1.1 Motivation and Background
The ultimate goal of this research is to study the cooling of a solar panel. In previous
studies, it has been found that the higher the cell temperature of a solar photovoltaic (PV)
solar panel, the lower the efficiency. So, it is essential to study the cooling of the solar
panel to enhance the efficiency of the PV panel. There are two requirements of the cooling
method, one is to enhance the heat transfer rate efficiently, and the other is that the means
should not block the solar radiation which can decrease energy absorbed by the solar panel.
Vortex generators punched out from the surface is one of the commonly used
methods to enhance the heat transfer rate of the surface by generating turbulence and
vortices in the flow. The heat transfer rate is controlled by the secondary flow, turbulence
caused by the vortex generators. Many kinds of turbulent generators (TG) have been
applied to enhance heat transfer via the resulting flow turbulence and vorticity [1,2]. These
vortex generators may include longitude vortex generators [3,4], ribs [5], or dimples [6].
These vortex generators are widely used in many industrial applications including the
cooling of electronics, heat exchangers, and cooling of solar panels, which can enhance the
efficiency of the application.
Delta winglet is a passive turbulent generator (TG) which tends to generate a
longitude vortex capable of penetrating the turbulent boundary layer [7]. The longitude
vortex is a kind of long-lasting vortex which can exist in a long stream-wise distance. In
2 longitude vortex and high-intensity turbulence to enhance the heat transfer rate effectively.
Previous researchers found that the delta winglet has the best performance among all
longitude vortex generators [8]. Many studies have been carried on the heat transfer
augmentation caused by the delta winglet in the heat exchanger. To investigate the heat
transfer enhancement caused by the delta winglet, this research was performed in the wind
tunnel which can be considered as an unconfined flow.
1.2 Thesis Objective and Overview
The objective of this paper is to find the most effective way to enhance convective
heat transfer rate of the solar panel and explain the augmentation in terms of the altered
flow field characteristic. To achieve the objective, the turbulent flow structure and vortex
intensity of longitudinal vortex were qualified under different inclination angles (60, 90
and 120) with a fixed attack angle of 30° and aspect ratio of 2 to investigate the influence
of turbulent vortical flow on the Nusselt number on the PTFE plate. The flow was measured
by a 3D hotwire. The heat transfer enhancement was evaluated by using a thermal camera
and thermal couples. The procedure of the research was presented as follows:
Chapter 1 (Introduction)
The motivation, background and the objective of the research.
Chapter 2
In this part, the effect of the inclination angle of a delta winglet vortex generator
with a length-to-height (c/h) ratio of 2, at 30 degrees with respect to a Reh = 9000 wind, on
3 characteristics at 13h downstream of the leading edge of the delta winglet were detailed
with the help of a triple-hot-wire probe. Specifically, the local velocity, vortex shape, size
and strength, turbulence intensity, integral length, and Taylor microscale were deduced.
The results show that the into-the-plate velocity in the inflow region increased, while the
out-of-the-plate velocity in the outflow area decreased, with the increasing of the
inclination angle. The 90-degree inclination angle appears to furnish higher values of
turbulent intensity, integral length, and Taylor microscale.
Chapter 3
As next step, a delta winglet (DW) with an aspect ratio (c/h) of 2 and an attack
angle of 30 degrees was mounted on a heated flat plate to scrutinize the role of its
inclination angle (60, 90 and 120) on convection heat transfer enhancement. The
experiment was conducted at a Reynolds number, Reh, of 6300 in a wind tunnel. The heat
transfer enhancement deduced from a thermal camera was expressed in terms of Nusselt
number normalized by the reference no-winglet case for the streamwise distance from 0 to
16h. It was found that the largest tested inclination angle of 120 resulted in the most heat
transfer enhancement. The results were explained in terms of the vortical flow
characteristics detailed at 13h, where the most substantial downwash velocity and affected
area were obtained for the 120 inclination angle case. This vertical downwash caused a
larger enhancement than the slightly more considerable turbulent kinetic energy produced
by the 90 inclination angle winglet.
4 In the last chapter, a conclusion and summary were made with respect to the results
of the whole research. Moreover, a possible direction of the future work was raised in this
chapter.
Appendix
Uncertainty analysis of the experiment. And the publication status.
References
[1] Jindal, P., Agarwal, S., Sharma, R. P., and Roy, A. K., 2018, “Enhancement of Film
Cooling Effectiveness Using Rectangular Winglet Pair,” Journal of Thermal
Science and Engineering Applications, 10(4), pp. 041014-041014–9.
[2] Agarwal, S., and Sharma, R. P., 2016, “Numerical Investigation of Heat Transfer
Enhancement Using Hybrid Vortex Generator Arrays in Fin-and-Tube Heat
Exchangers,” Journal of Thermal Science and Engineering Applications, 8(3), pp.
031007-031007–9.
[3] Li, J., Dang, C., and Hihara, E., 2019, “Heat Transfer Enhancement in a Parallel,
Finless Heat Exchanger Using a Longitudinal Vortex Generator, Part B:
Experimental Investigation on the Performance of Finless and Fin-Tube Heat
Exchangers,” International Journal of Heat and Mass Transfer, 128, pp. 66–75.
[4] Li, J., Dang, C., and Hihara, E., 2019, “Heat Transfer Enhancement in a Parallel,
Finless Heat Exchanger Using a Longitudinal Vortex Generator, Part A: Numerical
5 [5] Rezazadeh, R., Pourmahmoud, N., and Asaadi, S., 2018, “Numerical Investigation
and Performance Analyses of Rectangular Mini Channel with Different Types of
Ribs and Their Arrangements,” International Journal of Thermal Sciences,
132(Complete), pp. 76–85.
[6] Chimres, N., Wang, C.-C., and Wongwises, S., 2018, “Optimal Design of the
Semi-Dimple Vortex Generator in the Fin and Tube Heat Exchanger,” International
Journal of Heat and Mass Transfer, 120, pp. 1173–1186.
[7] R. L. Webb and N. Kim, “Enhanced Heat Transfer,” Taylor and Francis, New York,
1994.
[8] Mitra, N., Fiebig, M., and others, 1994, “Comparison of Wing-Type Vortex
Generators for Heat Transfer Enhancement in Channel Flows,” Journal of heat
6 CHAPTER 2
THE EFFECT OF DELTA WINGLET INCLINATION ANGLE ON THE VORTICAL
FLOW DOWNSTREAM
2.1 Introduction
Delta winglet is a passive turbulent generator (TG) which tends to generate a
longitude vortex which can penetrate into the turbulent boundary layer [1]. It is widely
used in many engineering applications such as heat exchangers [2, 3], and the induced
turbulence under various conditions is also of fundamental interest.
Eibeck and Eaton [4] studied the structure of the longitude vortex created by the
delta winglet at different downstream locations in 1987. Their work showed that the
longitude vortex can thicken the otherwise flat surface boundary layer. The typical detailed
structure of the longitude vortex caused by the delta winglet on the flat surface boundary
layer has been detected by Wu et al. [5]. According to their study, the longitudinal main
vortex and the induced vortex can be observed downstream of the winglet. The flow can
be divided into two regions, inflow and outflow. They then discovered that an increase in
aspect ratio can move the vortex toward to the surface and decrease the turbulent intensity
of the flow downstream [6]. The escalation of turbulence fluctuation seems to revert more
when the attack angle of the delta winglet increases [7]. The increase of attack angle of the
delta winglet can also strengthen the intensity of the swirling motion in a circular tube [8],
though it can decrease the vorticity of the longitude vortex for the flat surface case [7].
Oneissi et al. [9] investigated the structure of the turbulence caused by a pair of
7 generated by the delta winglet pair and also that of an inclined projected winglet pair. They
found that the inclined winglet pair can produce larger vortices in the corner of the
rectangular pipe.
It is clear that, due to its fundamental and practical importance, much work has
been done on turbulence flow downstream of delta winglets. To our knowledge, however,
the effect of the inclination angle of the delta winglet on the resulting vortex over a plane
has not been systematically explored. The inclination angle is an important parameter of
the winglet which can affect the structure of the vortical flow [9]. This paper aims at
understanding the effect of inclination angle on the turbulent flow over a flat plate.
2.2 Nomenclature
𝐵 The uncertainty of bias
𝑐 The chord length of the winglet (mm)
E The total uncertainty
ℎ The height of the winglet (mm)
KE Normalized turbulence kinetic energy
𝑁 Sampling number
P The uncertainty of precision
Reh Reynold number based on the winglet height
TG Turbulent generator
8
𝑢𝑖 Instantaneous fluctuating velocity (m/s)
𝑢𝑟𝑚𝑠 Root-mean-square velocity (m/s)
𝑈𝑖 Instantaneous velocities (m/s)
𝑈̅ Time-averaged local velocity (m/s)
𝑈∞ Time-averaged free-stream velocity (m/s)
𝑣𝑖 Instantaneous fluctuating velocity in Y direction (m/s)
𝑉̅ Time-averaged velocity in Y direction (m/s)
𝑤𝑖 Instantaneous fluctuating velocity in Z direction (m/s)
𝑊̅ Time-averaged velocity in Z direction (m/s)
α The attack angle of the winglet (degrees)
𝜆 Taylor micro-scale (m)
𝛬 Integral scale (m)
𝜌(𝜏) Autocorrelation factor
𝜏𝜆 Taylor time scale (s)
𝜏𝛬 Integral time scale (s)
ω The vorticity of the vortex (𝑠−1)
9
2.3 Experimentation
The model of the studied winglet is shown in Fig. 2.1. The winglet is made of
0.1mm thick aluminum (1145-H19) sheet. Based on the knowledge gathered from Wu et
al. [5], the attack angle α is set at 30 degrees. The height h is 15mm and the chord length c
is 30mm, resulting in an aspect ratio c/h = 2. The flow was measured by the hotwire with
two different inclination angles, 𝛽 = 90° and 120°.
Figure 2. 1. The delta winglet model; c = chord length, h = winglet height, 𝛂 = attack
angle.
The model was placed on the base of the 76cm×76cm cross-section wind tunnel.
The winglet was taped in the middle of the test section. The turbulent flow caused by the
winglet was measured using a triple sensor hotwire (type 55P95) and a
constant-temperature anemometer at 13h (200mm) downstream as shown in Fig. 2.2 Flow
measurements was acquired over an 100mm×44mm grid with a resolution of 4mm. The
free-stream velocity was fixed at 10 m/s, leading to a Reynolds number based on the height
of the winglet of 9000 (or 18000 based on the chord length). The instantaneous voltage of
three directions were recorded by the hotwire. Then, the instantaneous velocities were
10 probe [10]. The velocity was sampled at 80 kHz and low passed at 30 kHz to avoid aliasing.
The sample size was held at 106.
(a)
(b)
Figure 2. 2 (a) The experiment setup plan, (b) photos detailing the experimental
setup.
2.4 Data Analysis
The process of data analysis in Ref [11] was followed. The time-averaged velocity
11
𝑈̅ = 1
𝑁∑ 𝑈𝑖
𝑁
𝑖=1
(1)
where the sample size was N=106. The instantaneous fluctuating velocity (u) was obtained
by subtracting the time-averaged velocity from the instantaneous velocity,𝑢𝑖 = 𝑈𝑖− 𝑈̅.
The intensity of this fluctuation was expressed in the root-mean-square form:
𝑢𝑟𝑚𝑠 = √∑ 𝑢𝑖2 𝑁−1 𝑁
𝑖=1 (2)
This turbulence intensity is commonly normalized by the time-averaged
free-stream velocity 𝑈∞, i.e.,
𝑇𝑢 =𝑢𝑟𝑚𝑠
𝑈∞ (3)
Turbulence is inherently three dimensional [11], and thus, the fluctuation occurs in
x, y and z directions. The total turbulent kinetic energy is composed of contributions from
the three orthogonal components,
𝐾𝐸 =1
2[( 𝑢𝑖 𝑈∞)
2+ (𝑣𝑖 𝑈∞)
2+ (𝑤𝑖 𝑈∞)
2] (4)
The integral scale signifies the large, energy containing eddies. It can be calculated
12
𝜌(𝜏) =𝑢(𝑡)𝑢(𝑡 + 𝜏) ̅̅̅̅̅̅̅̅̅̅̅̅̅̅̅̅
𝑢2(𝑡)
̅̅̅̅̅̅̅ (5)
In the case of discrete data, the auto correlation factor is expressed as:
𝜌(𝑛∆𝑡) = 1
𝑁 − 𝑛∑𝑁−𝑛𝑖=1(𝑢𝑖𝑢𝑖+𝑛)
1
𝑁∑𝑁𝑖=1𝑢𝑖2
(6)
where n varied from 0 to N-1. and the integral time scale is defined as:
𝜏𝛬 = ∫ 𝜌(𝜏)𝑑𝜏
∞
0
(7)
For the discrete sample, it is:
𝜏𝛬 = ∑ 𝜌(𝑖∆𝑡)
𝑁𝑘−1
𝑖=1
∆𝑡 (8)
where the 𝑁𝑘 is the point where the 𝜌(𝜏) first comes to the negative side. The integral
scale can be determined, by invoking Taylor frozen hypothesis [11], from:
13 The Taylor microscale represents the small eddies in the turbulent flow, actively
dissipating kinetic energy via viscosity into heat. The Taylor time scale (𝜏𝜆) can be [12]
expressed as:
𝜏𝜆 = √ 2𝑢𝑖
2
̅̅̅̅̅̅
(𝑑𝑢𝑑𝑡𝑖)2
(10)
When the data is discrete,
𝜏𝜆 = √
1
𝑁∑𝑁𝑖=12𝑢𝑖2
1
𝑁 − 1∑ (
𝑢𝑖+1− 𝑢𝑖
∆𝑡 )2
𝑁−1 𝑖=1
(11)
According to the Taylor frozen hypothesis [12], eddies may be considered to be
merely passing through the probe without evolution if the velocity fluctuation is small
compared to the convective current that carries the eddies. Therefore, the Taylor
micro-scale can be obtained from:
𝜆 = 𝑈̅𝜏𝜆 (12)
The vorticity of the longitude vortex can be defined as:
𝜔 =𝜕𝑊̅ 𝜕𝑦 −
𝜕𝑉̅
14 An appropriate non-dimensional vorticity can be formed by multiplying by the
height of the delta winglet, h, and dividing by the time-averaged free-stream velocity 𝑈∞,
i.e.,
𝛺 = 𝜔 × ℎ 𝑈∞
(14)
The total uncertainty (E) of each flow parameter consists of bias uncertainty (B)
arising from the process of calibrating of the hotwire, and the precision (P) uncertainty due
to random variations when repeating the acquisition of the instantaneous velocity data. The
process in Ref [13] was followed; see the Appendix.
2.5 Results and Discussion
To elucidate the effect of the inclination angle of the delta winglet on the flow
downstream, the large longitude vortex was first captured and analyzed. Cross-sectional
velocity vector plots complemented with stream-wise velocity contours work well. The
turbulence in the flow field was delineated in terms of the turbulent intensity, the integral
length and Taylor microscale.
2.5.1 Vortex Structure
The cross-stream (Y-Z plane) velocity vectors and the stream-wise velocity
contours are depicted in Fig. 2.3; where Y/h = 0 (X/h = 0, Z/h = 0) corresponds to the leading
edge of the delta winglet. The studied area, as shown in the figure, was at 13h (200mm)
15 time-averaged velocity normalized by 𝑈∞ ( 10 m/s) portray the winglet perturbed
boundary layer flow behavior. The dotted triangle profile depicts the winglet upstream.
The uncertainty of the mean velocity in this study is approximately 0.28 m/s; see Appendix
A.
The generation of the longitude vortex had been speculated to initiate from the
leading edge of the delta winglet [6, 14]. The generated vortex had been found to persist
far downstream [15, 16]. Comparing the vortex caused by an inclined winglet, the induced
flow could be divided into two regions. The region where the cross-stream velocity vectors
(in the Y-Z plane) point toward the surface is the inflow region; see Fig. 2.3(b). For a heated
surface, the vortex would bring the cooler freestream air down, toward the hot surface in
this region. And the region where the flow moves upward, away from the surface is called
the outflow region; see Fig. 2.3(b). It is clear from Fig. 2.3 that the prevailing vortex rotates
anticlockwise looking upstream. In agreement with previous studies [6, 17], the outflow
region corresponds to the right (looking upstream onto the winglet) of the tailing edge. The
inflow region has a larger stream-wise velocity, as the inner boundary layer is pushed
toward the plate, than the outflow region.
16 (a)
(b)
(c)
Figure 2. 3 Velocity vectors in the YZ plane and stream-wise time-averaged
17
𝟗𝟎°, (b) 13h (200mm) downstream with 𝜷 = 𝟏𝟐𝟎°, (c) 6.7h (100mm) downstream
with 𝜷 = 𝟏𝟐𝟎°.
In other words, the longitude vortex has a significant effect on the thickness of the
turbulent boundary layer. In the current setup, the thickness of the boundary layer without
the delta winglet was around 1.6h (24 mm). The swirling motions generated by the vortex
generator is known to disrupt the boundary layer and create significant mixing downstream
[18, 19]. Consequently, the boundary layer in the current study thickened to slightly more
than 2h for the 𝛽 = 90° case, and to slightly less than 2h at a larger inclination angle, 𝛽 =
120°. The inner boundary layer (< 0.95 freestream stream-wise velocity) thickness
(contour or profile) was skewed by the toward-the-plate in the inflow region and that
out-of-the-plate in the outflow region. The more symmetrical stream-wise velocity contours
along with the less-thickened boundary layer for the larger inclination angle (𝛽 = 120°)
case seems to suggest a lesser flow agitation, compared to the 𝛽 = 90° case. Also, the
boundary layer is less skewed at 100 mm, where the corresponding vortex is smaller. This
implies that the vortex-boundary layer interactions evolve with distance downstream.
To further elucidate the flow field, especially the inflow and outflow regions, the
average of normalized 𝑊̅ velocities are depicted in Fig. 2.4. The location of the lowest and
the largest average 𝑊̅ /𝑈∞ along the studied Y span correspond nicely to the locations of
inflow and outflow. The vortex shifts to the right (looking upstream) by about 0.5h (8mm)
as the inclination angle increases from 90 to 120. This is because the cross section of the
18 (outflow side) as β increases. The larger inclination also resulted in a more negative 𝑊̅ /𝑈∞
in the inflow region and a less positive 𝑊̅ /𝑈∞ in the outflow region. The entire vortex
structure shifts about 4 mm to the outflow side, with increasing distance from 100 to 200
mm. Furthermore, the vortex expands as it evolves downstream.
Figure 2. 4Average of 𝑾̅̅̅/𝑼∞ in the Y direction.
The normalized stream-wise velocity profile at the location of the prevailing vortex
center is shown in Fig. 2.5. The peak stream-wise velocity deficit can be observed around
the center of the longitude vortex, which agrees with Godarad and Stanislas [20].
Increasing the inclination angle from 90 to 120 appears to lead to smaller maximum
stream-wise velocity deficits. The stream-wise peak deficit is much larger at the shorter
19 To better identify the longitude vortex in the YZ plane, the vorticity is depicted in
Fig. 2.6. A high vorticity region can be found at the core of the vortex, concurring with
Luo et al. [21]. The vorticity of the vortex core decreases as the vortex travels downstream.
The location of the vortex core moves upward as the inclination angle increases (Z/h=0.53
for 𝛽 = 90° and 0.8 for 𝛽 = 120°). It also shifts farther downstream. The
winglet-generated vortex expands as it travels downstream, i.e., the vortex at 100 mm is smaller
than that at 200 mm, see Fig. 2.4. The height of the vortex core corresponds to the location
of the peak deficit of the stream-wise velocity shown in Fig. 2.5. With the increase of
inclination angle, the prevailing longitude vortex shrinks according to the contour of the
vorticity. The main vortex separates from the bottom wall in the outflow region. Moreover,
a smaller vortex rotating opposite to the main vortex can be observed at the outflow region
side. It is called induced vortex according to Biswas et al. [22]. Only one induced vortex
can be observed, presumably because the measurement location is quite far downstream,
20
Figure 2. 5 Stream-wise velocity normalized by the freestream velocity in the center
of the vortex (Y/h=1.2, when 𝜷 = 𝟗𝟎°, 200mm downstream; Y/h = 1.7, when 𝜷 =
𝟏𝟐𝟎°, 200mm downstream; Y/h = 1.4, when 𝜷 = 𝟏𝟐𝟎°, 100mm downstream).
21 (b)
(c)
Figure 2. 6 Cross-stream vorticity contours at (a) 13h (200mm) downstream, 𝜷 =
𝟗𝟎°, (b) 13h (200mm) downstream, 𝜷 = 𝟏𝟐𝟎°, (c) 6.7h (100mm) downstream, 𝜷 =
22
2.5.2 Turbulent intensity
Turbulent intensity in the flow is the key parameter to quantify the turbulence. Fig.
2.7 shows the stream-wise turbulence intensity (Tu is the local turbulence
root-mean-square fluctuation, 𝑢𝑟𝑚𝑠, normalized by the freestream time-averaged velocity,𝑈∞),
contours at 13h (200 mm) downstream of the winglet. The Tu value decreases with
increasing inclination angle, and this coincides with the shrinking of the main vortex shown
in Fig. 2.6. The peak stream-wise turbulence intensity (Tu0.09) is above the core of the
vortex, at Z/h1.4. As expected, this corresponds to the location of highest shear stress
(velocity gradient); see Fig. 2.5. With vortex shrinkage, the peak turbulent intensity region
is smaller, and it moves closer to the surface, when β = 120°. Tu decreases from the
proximity of the solid surface to the freestream in both of the inflow and the outflow region,
confirming the low background turbulence outside the perturbed boundary layer, i.e., in
the freestream. More importantly, Tu is larger in the inflow region, compared to that in the
outflow region. This is presumably due to the larger flow (stream-wise velocity as depicted
in Fig. 2.3) and shear. The average turbulent intensity when 𝛽 = 90° is 12% higher than
that at a higher inclination angle of 𝛽 = 120°. The uncertainty of the normalized
23 (a)
(b)
Figure 2. 7 Turbulent intensity in the stream-wise direction (Tu) and velocity
vectors in the YZ plane at 13h (200mm) downstream (a) 𝛃 = 𝟗𝟎°, (b) 𝛃 = 𝟏𝟐𝟎°.
Downstream of a winglet, the turbulent intensity of the stream-wise velocity can be
24 the stream-wise flow is converted to the rotating motion of the vortex, and the rest is
transformed into turbulent kinetic energy. To have a better understanding of the turbulent
kinetic energy budget, the stream-wise KE is plotted in Fig. 2.8.
(a)
(b)
Figure 2. 8 Normalized stream-wise turbulent kinetic energy and velocity vectors in
25 The contours of the turbulent kinetic energy in Fig. 2.8 follow the shape of the
vortex. It can be observed that the region near the core of the longitude vortex generates
the largest energy from the flow to turbulence. The peak deficit of stream-wise velocity in
the core of the vortex also confirms that. Inflow and outflow regions are the high turbulent
kinetic energy regions when the delta winglet is used in the circular pipe [15]. The
stream-wise turbulence kinetic energy decreases as the distance from the core increases. And the
delta winglet generates less turbulent kinetic energy from the flow as the inclination angle
increases, which conforms to the decrease of deficit in the stream-wise velocity (see Fig.
5).
2.5.3 Integral Scale
Integral scale signifies the energy containing eddies. Contours of stream-wise
integral scale, where the associated uncertainty is roughly 6mm, are portrayed in Fig. 2.9.
The integral scale is undefined outside the perturbed boundary layer, where the flow is
26 (a)
(b)
Figure 2. 9 Stream-wise integral scale normalized by h contours at 13h (200 mm)
27 The stream-wise integral scale around the longitudinal vortex appears to be
consistently larger; correlate Fig. 2.9 with Fig. 2.6. Even though what is plotted is the
stream-wise integral scale, and thus, it is more-or-less perpendicular to the longitudinal
vortex, its contours, nonetheless, still indicate the longitudinal vortex, which is primarily
in the YZ plane. Specifically, the smallest stream-wise integral scale inside the 1h contour
matches reasonably well with the vortex core shown in Fig. 2.6. When comparing the
average integral scale, the larger inclination angle, 𝛽 = 120°, produced integral scale
which is 21% smaller than that generated by 𝛽 = 90°.
2.5.4 Taylor Microscale
Taylor microscale represents the small and dissipative eddies in the flow [10]. The
overall contour view of stream-wise Taylor microscale is shown in Fig. 2.10. The
uncertainty of the Taylor microscale is estimated to be around 0.6mm; see Appendix.
28 (b)
Figure 2. 10 Contours of stream-wise Taylor microscale normalized by h at 13h (200
mm) downstream (a) 𝜷 = 𝟗𝟎°, (b) 𝜷 = 𝟏𝟐𝟎°.
The Taylor microscale peaked around Y/h2.5 and Z/h1.5, and Y/h2 and Z/h1.3,
for 𝛽 = 90° and 120°, respectively. These roughly coincide with the maximum
stream-wise turbulent intensity zones in Fig. 2.7. Within the longitudinal vortex region, the
smallest Taylor microscale is detected next to the solid surface bounded by the inflow and
outflow. It appears that the inflow might have some compression effect, resulting in the
occurrence of the smallest Taylor microscale within the disturbed boundary layer. Outside
the boundary layer, where the background turbulence is low, the notion of Taylor
microscale is questionable. That is, the Taylor microscale contours far from the solid
surface (> Z/h=2) should be disregarded. The larger inclination angle which produced a
29 smaller. This appears to suggest more restrained (to near solid surface) and hence, smaller
, and weaker vortical flow for the 𝛽 = 120° case.
2.6 Conclusion
The role of the inclination angle 𝛽 = 90° & 120° of a c/h = 2 (c = winglet chord
length, h = winglet height) delta winglet at 30 with respect to an Reh = 9000 wind was
experimentally investigated. The evolution of the vortical flow was quantified in terms of
vortex size, vorticity, turbulence intensity, integral length and Taylor microscale. The
boundary layer is found to be progressively disturbed as the vortical flow-boundary layer
interactions evolve. The longitude vortex enlarges and shifts to the outflow side as it travels
downstream. With the increase of inclination angle, the longitudinal vortex is reduced and
shifted toward the outflow side. Along with the shrinking of the longitudinal vortex is a
reduced turbulent boundary layer. Moreover, the into-the-plate velocity in the inflow
region increases, but the corresponding out-of-plate velocity in the outflow region
decreases, with increasing inclination angle. The perturbed flow field turbulence, along
with the associated integral scale and Taylor microscale, are also lowered when increasing
from 90 to 120.
Acknowledgement
This work was made possible by Natural Sciences and Engineering Research
30
References
[1] R. L. Webb and N. Kim, “Enhanced Heat Transfer,” Taylor and Francis, New York,
1994.
[2] A. Boonloi and W. Jedsadaratanachai, “Flow topology, heat transfer characteristic
and thermal performance in a circular tube heat exchanger inserted with punched
delta winglet vortex generators,” J. Mech. Sci. Technol., vol. 30, no. 1, pp. 457–
471, 2016.
[3] L. Luo, F. Wen, L. Wang, B. Sundén, and S. Wang, “Thermal enhancement by
using grooves and ribs combined with delta-winglet vortex generator in a solar
receiver heat exchanger,” Appl. Energy, vol. 183, pp. 1317–1332, 2016.
[4] P. Eibeck and J. Eaton, “Heat transfer effects of a longitudinal vortex embedded in
a turbulent boundary layer,” ASME. J. Heat Transf., vol. 109, no. 1, pp. 16–24,
1987.
[5] H. Wu, D. S-K. Ting, and S. Ray, “An experimental study of turbulent flow behind
a delta winglet,” Exp. Therm. Fluid Sci., vol. 88, pp. 46-54, 2017.
[6] H. Wu, D. S-K. Ting, and S. Ray, “Flow over a flat surface behind delta winglet of
varying aspect ratio,” Int. J. Heat Mass Transf., vol. 120, pp. 117–126, 2017.
[7] H. Wu, D. S.-K. Ting, and S. Ray, “The effect of delta winglet attack angle on the
heat transfer performance of a flat surface,” Int. J. Heat Mass Transf., vol. 120, pp.
31 [8] Y. Lei, F. Zheng, C. Song, and Y. Lyu, “Improving the thermal hydraulic
performance of a circular tube by using punched delta-winglet vortex generators,”
Int. J. Heat Mass Transf., vol. 111, pp. 299–311, 2017.
[9] M. Oneissi, C. Habchi, S. Russeil, D. Bougeard, and T. Lemenand, “Novel design
of delta winglet pair vortex generator for heat transfer enhancement,” Int. J. Therm.
Sci., vol. 109, pp. 1–9, 2016.
[10] F.E. Jørgensen, “How to Measure Turbulence with Hot-Wire Anemometers: A
Practical Guide, Dantec Dynamics, Skovlunde,” Denmark, 2002.
[11] D. S-K. Ting, “Basics of Engineering Turbulence,” Academic Press, New York,
2016.
[12] G. I. Taylor, “The spectrum of turbulence,” Proc. R. Soc. Lond. Ser. Math. Phys.
Sci., pp. 476–490, 1938.
[13] R. S. Figliola and D. E. Beasley, “Theory and Design for Mechanical
Measurements”, IOP Publishing, 2001.
[14] L. Li, X. Du, Y. Zhang, L. Yang, and Y. Yang, “Numerical simulation on flow and
heat transfer of fin-and-tube heat exchanger with longitudinal vortex generators,”
Int. J. Therm. Sci., vol. 92, pp. 85–96, 2015.
[15] Y. Xu, M. Islam, and N. Kharoua, “Experimental study of thermal performance and
flow behaviour with winglet vortex generators in a circular tube,” Appl. Therm.
32 [16] Y. Xu, M. Islam, and N. Kharoua, “Numerical study of winglets vortex generator
effects on thermal performance in a circular pipe,” Int. J. Therm. Sci., vol. 112, pp.
304–317, 2017.
[17] A. Jacobi and R. Shah, “Heat transfer surface enhancement through the use of
longitudinal vortices: a review of recent progress,” Exp. Therm. Fluid Sci., vol. 11,
no. 3, pp. 295–309, 1995.
[18] P. Saha, G. Biswas, and S. Sarkar, “Comparison of winglet-type vortex generators
periodically deployed in a plate-fin heat exchanger–A synergy based analysis,” Int.
J. Heat Mass Transf., vol. 74, pp. 292–305, 2014.
[19] L. Tang, W. Chu, N. Ahmed, and M. Zeng, “A new configuration of winglet
longitudinal vortex generator to enhance heat transfer in a rectangular channel,”
Appl. Therm. Eng., vol. 104, pp. 74–84, 2016.
[20] G. Godard and M. Stanislas, “Control of a decelerating boundary layer. Part 1:
Optimization of passive vortex generators,” Aerosp. Sci. Technol., vol. 10, no. 3,
pp. 181–191, 2006.
[21] L. Luo, F. Wen, L. Wang, B. Sunden, and S. Wang, “On the solar receiver thermal
enhancement by using the dimple combined with delta winglet vortex generator,”
Appl. Therm. Eng., vol. 111, pp. 586–598, 2017.
[22] G. Biswas, K. Torii, D. Fujii, K. Nishino, “Numerical and experimental
determination of flow structure and heat transfer effects of longitudinal vortices in
33 [23] C. M. Velte, M. O. Hansen, and V. L. Okulov, “Multiple vortex structures in the
wake of a rectangular winglet in ground effect,” Exp. Therm. Fluid Sci., vol. 72,
pp. 31–39, 2016.
[24] S. Yavuzkurt, “A guide to uncertainty analysis of hot-wire data,” J. Fluids Eng.,
34 CHAPTER 3
THE ROLE OF DELTA WINGLET INCLINATION ANGLE ON HEAT TRANSFER
ENHANCEMENT
3.1 Introduction
Many kinds of turbulent generators (TG) have been applied to enhance heat transfer
via the resulting flow turbulence and vorticity [1,2]. Among them, delta winglet (DW) is a
promising enhancer as it can generate a longitudinal vortex street in addition to promoting
flow turbulence. The vortex street tends to survive far downstream, resulting in a prolonged
area with augmented heat transfer rate [3,4]. Among the delta winglet heat transfer
enhancement studies are those that focus on heat exchangers [5-7], circular tubes [8, 9],
heated plates and channels [10, 11]. Pal et al. [5] numerically investigated a pair of delta
winglets upstream of two tubes in a heat exchange channel. Over their studied conditions,
the average heat transfer rate was augmented by about 40%. Liang et al. [8] numerically
studied heat transfer behavior in a circular pipe fitted with arrays of delta winglets. They
correlated the surface Nusselt number contours with the flow mixing effect. Syaiful et al.
[10] examined the flow over a heated plate mounted with delta winglet pairs. They showed
that perforating the winglet with some holes can decrease the pressure drop without
significantly losing the efficacy of heat transfer augmentation.
From the literature, it is evident that attack angle, aspect ratio and inclination angle
are key parameters affecting winglet-enhanced heat transfer. Wu et al. [12] varied the
attack angle of their delta winglet from 30 to 60, and found that, within the considered
35 the near wake region of a heated flat surface. In Lei et al. [13] heat exchanger study, it is
shown that the thermal performance improved when increasing the aspect ratio from 1 to
2, beyond which the enhancement decreases. Oneissi et al. [14] examined the effect of the
inclination angle of a winglet pair inside a rectangular pipe. They discovered that the
inclined winglet pair which produced large secondary flow in the corner of the rectangular
pipe gave the best heat transfer performance.
It is clear that much work has been performed on the thermal performance of a delta
winglet due to its efficiency, economy, manufacturing simplicity and maintenance ease.
Moreover, a modest change in one of the key winglet parameters can significantly change
the resulting heat transfer rate. Among the influential delta winglet parameters, inclination
angle seems to be least studied, especially regarding its effect on the heat transfer rate from
an unconfined flat surface. Unconfined surface heat transfer is applicable in cooling of a
solar panel [12] or the flat side of a permanent magnet synchronous generator coil [15],
among many other applications. As such, this paper aims at improving our understanding
of the effect of delta winglet inclination angle on the thermal performance of a flat plate.
3.2 Nomenclature
AR Aspect ratio
c The chord length of the winglet (mm)
D Characteristic length (m)
DW Delta winglet
36
hconvection The local convection heat transfer coefficient (W/(m2∙K))
hconvection, 0 The local convection heat transfer coefficient without delta winglet
(W/(m2∙K))
kair The conductivity of air (W/(m∙K))
kPTFE Conductivity of the PTFE plate (W/(m∙K))
K Normalized turbulence kinetic energy
K̅ Averaged turbulent kinetic energy
Nu Local Nusselt number
Nu0 Local Nusselt number without delta winglet
PTFE Polytetrafluoroethylene
Qconvection Heat convected away to the freestream (W)
Qradiation Heat radiated to the air (W)
Qtot Total heat conducted to the upper surface (W)
Reh Reynold number based on the winglet height
tPTFE Thickness of PTFE plate (mm)
Tbottom Temperature at the bottom surface of PTFE plate (100℃)
37
Tsurrounding Surrounding temperature (22℃)
Ttop Temperature at the upper surface of PTFE plate (℃)
ui Instantaneous fluctuating velocity (m/s)
urms Root-mean-square velocity (m/s)
Ui Instantaneous velocities (m/s)
U̅ Time-averaged local velocity (m/s)
U∞ Time-averaged free-stream velocity (m/s)
vi Instantaneous fluctuating velocity in Y direction (m/s)
V
̅ Time-averaged velocity in Y direction (m/s)
wi Instantaneous fluctuating velocity in Z direction (m/s)
W̅ Time-averaged velocity in Z direction (m/s)
α The attack angle of the winglet (degrees)
σ Boltzmann’s constant (5.67×10⁻⁸ Wm-2 K-4)
ω The vorticity of the vortex (s-1)
38
3.3 Experimentation
The studied winglet model is shown in Fig. 3.1. It is made of 0.1 mm thick
aluminum (1145-H19) sheet. Based on the knowledge gathered from Wu et al. [12] and He
et al. [16], the attack angle, α, is set at 30 degrees. The height of the delta winglet, h, is
15mm and the chord length, c, is 30 mm, leading to an aspect ratio c/h = 2. Three different
inclination angles, 60, 90 and 120°, were considered at a free-stream velocity of 7 m/s,
i.e., a Reynolds number based on the height of the winglet, Reh, of 6300.
Figure 3. 1 The delta winglet model; chord length, c = 30 mm, winglet height, h = 15
mm, attack angle, 𝛂 = 30 degrees, inclination angle, = 60, 90, 120.
The model was placed in a 76cm×76cm cross-section wind tunnel over a 3 mm
thick, 295 mm wide and 380 mm long PTFE (Polytetrafluoroethylene) plate. The
conductivity of the PTFE plate was 0.25 W/(m∙K), while its emissivity was 0.92. The
winglet was taped onto the plate as shown in Fig. 3.2. A heated water tank was placed
underneath to generate steam which maintained the bottom surface of the PTFE plate at
100℃. The convective heat transfer enhancement was deduced based on the temperature
39 with an accuracy of 0.5C. A thermal camera with a resolution of 60× 80 pixels was
positioned 0.5 m above the heated plate.
The delta-winglet-generated turbulent flow over the unheated PTFE plate was
characterized with the help of a triple sensor hotwire (type 55P95) and a
constant-temperature anemometer. As the augmentation of the heat transfer rate over a reasonable
stretch of the plate is of interest, the developed velocity field of a typical cross-section at
13h (200mm) downstream from the leading edge of the winglet was scrutinized. Following
the procedure detailed in Ref [17], instantaneous velocities were deducted from the
measured voltages over a 90mm×40mm grid with a resolution of 4mm. To ensure
reliability, a total of 106 data points per hotwire were sampled at 80 kHz, and low passed
at 30 kHz to avoid aliasing.
40 (b)
Figure 3. 2 The experiment setup
3.4 Data Analysis
The total heat conducted through the PTFE plate,
𝑄𝑡𝑜𝑡 =𝑘𝑃𝑇𝐹𝐸𝐴(𝑇𝑏𝑜𝑡𝑡𝑜𝑚−𝑇𝑡𝑜𝑝)
𝑡𝑃𝑇𝐹𝐸 (1)
where PTFE plate conductivity, kPTFE, was 0.25 W/(m∙K), the local heat transfer area, A,
was one pixel on the thermal photo (approximately 20 mm2), the thickness of the PTFE
plate, tPTFE, was 3mm, the temperature of the bottom surface, Tbottom, was 100℃, and the
top surface temperature, Ttop, was measured by the thermal camera. The heat conducted to
the top surface was assumed to be either radiated or convected away by the freestream. The
41
𝑄̇𝑟𝑎𝑑𝑖𝑎𝑡𝑖𝑜𝑛 = 𝜎𝐴(𝑇𝑡𝑜𝑝4 − 𝑇𝑠𝑢𝑟𝑟𝑜𝑢𝑛𝑑𝑖𝑛𝑔4 ) (2)
the Boltzmann’s constant, 𝜎 , was 5.67 × 10⁻⁸𝑊𝑚−2𝐾−4, and the surrounding
temperature, Tsurrounding, was approximately 295 K. The convection heat transfer rate was
thus obtained from the total heat transfer rate minus that radiated to the surrounding, i.e.,
𝑄𝑐𝑜𝑛𝑣𝑒𝑐𝑡𝑖𝑜𝑛= 𝑄𝑡𝑜𝑡− 𝑄𝑟𝑎𝑑𝑖𝑎𝑡𝑖𝑜𝑛 (3)
The convection heat transfer coefficient is defined as:
h𝑐𝑜𝑛𝑣𝑒𝑐𝑡𝑖𝑜𝑛 =
𝑄𝑐𝑜𝑛𝑣𝑒𝑐𝑡𝑖𝑜𝑛
𝐴(𝑇𝑡𝑜𝑝−𝑇𝑠𝑢𝑟𝑟𝑜𝑢𝑛𝑑𝑖𝑛𝑔) (4)
So, the corresponding non-dimensional Nusselt number is:
Nu =h𝑐𝑜𝑛𝑣𝑒𝑐𝑡𝑖𝑜𝑛𝐷
𝑘𝑎𝑖𝑟 (5)
Here, D is the characteristic length and kair is the conductivity of the air. To evaluate the
enhancement of the heat transfer, the measured Nusselt number in the presence of the delta
winglet was normalized by the corresponding local Nusselt number without the winglet,
i.e.,
Nu Nu0=
h𝑐𝑜𝑛𝑣𝑒𝑐𝑡𝑖𝑜𝑛
42 The time-averaged velocity was deduced from [17]:
𝑈̅ = 1
𝑁∑ 𝑈𝑖 𝑁
𝑖=1 (7)
where the sample size is N=106. The instantaneous fluctuating velocity (u) was obtained
by subtracting the time-averaged velocity from the instantaneous velocity, 𝑢𝑖 = 𝑈𝑖− 𝑈̅.
The intensity of this fluctuation was expressed in root-mean-square form:
𝑢𝑟𝑚𝑠 = √∑ 𝑢𝑖2 𝑁−1 𝑁
𝑖=1 (8)
Turbulence is inherently three dimensional [18], and thus, the fluctuations occur in x, y and
z directions. The total turbulent kinetic energy is composed of contributions from the three
orthogonal components,
𝐾 =1
2[( 𝑢𝑟𝑚𝑠
𝑈∞ )
2+ (𝑣𝑟𝑚𝑠 𝑈∞)
2+ (𝑤𝑟𝑚𝑠 𝑈∞ )
2] (9)
The vorticity of the longitude vortex can be defined as:
𝜔 = 𝜕𝑊̅
𝜕𝑦 − 𝜕𝑉̅
𝜕𝑧 (10)
Appropriate non-dimensional vorticity can be formed by multiplying by the height of
43
𝛺 =𝜔×ℎ
𝑈∞ (11)
The total uncertainty (E) of each measurement consists of bias uncertainty (B) and
precision uncertainty (P). The bias uncertainty came from the calibration process. The
precision (P) uncertainty was due to the random variations when repeating the acquisition
of the data; instantaneous velocity data by using the hotwire and the temperature data via
the thermal camera. The procedure in Ref [19] was followed when estimating the pertinent
uncertainties; see the Appendix A.
3.5 Results and Discussion
The temperature distribution along the PTFE plate was captured and analyzed to
reveal the effect of the inclination angle of the winglet on the thermal performance. The
results are presented in terms of the Nusselt number normalized by the reference Nusselt
number without the delta winglet. Detailed flow measurements obtained in the developed
vortical flow region at 13h downstream of the winglet were used to explain the heat transfer
behavior.
3.5.1 Heat Transfer
To evaluate the convective heat transfer enhancement caused by the delta winglet,
the temperature of the upper surface of PTFE plate was captured by a thermal camera. The
local normalized Nusselt numbers were used to illustrate the thermal performance of the
turbulent flow. Figure 3.3 depicts the normalized Nusselt number contours. Point (0,0)
corresponds to the location of the leading edge of delta winglet; see Fig. 3.2. The triangular
44 augmented the local heat transfer rate. The cross-sectional span in the Y direction of the
notably enhanced heat transfer area increases with distance downstream up to X/h around
12 or so. This is presumably due to the expansion of longitude vortex as it evolves
downstream [20]. The uncertainty of normalized Nusselt number is approximately 0.06,
45
Figure 3. 3 The effect of inclination angle (a) 60 (b) 90 and (c) 120 on Nu/Nu0
46 To take a closer look at the convective heat transfer enhancement, the normalized
Nusselt profile in the cross-sectional (Y) direction and how it evolves with distance
downstream are plotted in Fig. 3.4. It is clear from the figure that the largest Nu/Nu0 peak
is produced by the 120-degree inclination angle delta winglet, and this peak value decreases
as we move downstream (i.e. Nu/Nu0 1.65, 1.48, and 1.31 at X/h = 3, 8, and 13,
respectively). At X/h = 3, the location of the Nu/Nu0 maximum hovers around Y/h = 1 for
all three studied inclination angles. Farther downstream, the decaying Nu/Nu0 peaks of the
three inclination angles appear to depart from each other. The = 120 maximum shifts
slightly to the right (increasing Y/h), the = 90 peak remains at Y/h 1, and the = 60
maximum moves to the left.
To the right of the peak, Nu/Nu0 decreases to its minimum. This is true for all three
studied , where Nu/Nu0 minimum occurs at Y/h 2~3. These Nu/Nu0 maximum and
minimum were also detected by Nandana and Janoske [21]. The location of the Nu/Nu0
minimum has been associated with the outflow region where there is a lack of fresh cold
air from the freestream [22]. The fluid mechanics behind the thermal behavior of the
current study will be expounded in the next section, where the flow details are delineated.
It is interesting to note that the Nu/Nu0 values to the left of the peak are higher than those
to its right. These left-side values notably increase, while the right-side values decrease,
with distance downstream. These seem to portray some history effect as the vortex street
swirls downstream, picking up thermal energy along the way, in addition to the slow
weakening of the vortex street. The enhanced area becomes larger as the downstream
47 explained in terms of the expansion of the vortex. Also, the delta winglet with 120
48
Figure 3. 4 The effect of the inclination angle (60, 90, 120) on the cross-sectional
49 Figure 3.5 depicts the summit and valley values of normalized Nusselt numbers in
the Y span direction with respect to distance downstream. The 120°-inclination angle
winglet gave the largest maximum and minimum values in all the locations downstream,
while the 60° winglet produced the lowest enhancement values. The value of maximum
Nusselt numbers peak at the near wake region for the 120° and 90° inclination angles. In
general, the summit value decreases with distance downstream. However, there appears to
be an initial sharp decrease in the very near wake, which presumably has something to do
with the ‘heat fin effect’ caused by the highly conductive aluminum winglet. Otherwise,
the peak Nu/Nu0 value increases with downstream distance, before it decreases farther
downstream. This increasing followed by decreasing trend is more obvious at lower
inclination angles. The decrease in the peak Nu/Nu0 value for X/h larger than about 7 is
probably due to the decay of the longitude vortex, the associated turbulence dissipation,
and slight warming as the vortex picks up heat and swirls downstream. The valley
(minimum) value of Nu/Nu0 also has an overall (albeit slow) decrease with respect to
downstream distance. It is interesting to note that this valley Nu/Nu0 continues to drop
below unity, even though the vortex street weakens. This less-than-no-winglet reference
heat transfer rate appears to confirm the warming of the vortex street as it swirls
50
Figure 3. 5 The summit and valley Nu/Nu0 in the Y direction with respect to
downstream distance.
To evaluate the overall convective heat transfer performance, the average of
Nu/Nu0 in the Y direction is presented in Fig. 3.6. Two averages have been applied, one
from Y/h = 0 (approximately the start of notable enhancement) to Y/h=1 (roughly the
Nu/Nu0 peak), see Fig. 4a, and the other from Y/h = -2 to 2 (the span over which notable
change in Nu/Nu0 has been detected). The entire enhancement region of Nu/ Nu0 is
approximately from Y/h= -2 to 2, beyond which Nu/Nu0 falls back to unity. Therefore the
region from Y/h = -2 to 2 is chosen to represent the overall enhancement of the normalized
Nusselt number. For the 120° inclination angle case, the average Nu/Nu0 between Y/h = 0
51 al. [9] and Biswas et al. [23], and may be attributed to the decay of the primarily
longitudinal vortex street. The continual decrease is not observed for the 60° and 90°
winglets, where there is an increase after an initial decrease, beyond which the continual
decrease takes place. When the average is taken over a wider Y span, from Y/h = -2 to 2,
the variation of the averaged Nu/Nu0 with respect to distance downstream becomes less
obvious. The overall augmentation of Nu/Nu0 lasted over the entire studied stretch, up to
X/h of 16. Comparing Fig. 3.6(a) with 3.6(b), we see that while the most significantly
altered Nu with respect to the reference Nu0 decays with distance downstream, the larger
span (Y/h = -2 to 2) average shows the averaged enhancement in Nu/Nu0 is longer lasting.
In other words, the vortex street seems to expand and thus weakens as far as its largest
local boosting of Nu/Nu0 is concerned (Fig. 3.4). On the other hand, the expansion spreads
the vortex onto a larger span and thus, the overall enhancement in Nu/Nu0 diminishes
significantly slower. It is worth emphasizing that the most consistent observation is that
the 120° winglet is the most effective heat transfer promoter.
Figure 3. 6 Averaged Nu/Nu0 with the respect to downstream distance (a) average
52
3.5.2 Flow Field
To understand the physics underlying the thermal performance observed, the flow
field at X/h = 13 cross section was systematically scrutinized. To recognize the longitude
vortex in the YZ plane, the cross-stream velocity vectors and non-dimensional vorticity are
presented in Fig. 7. The uncertainty of the mean velocity is about 0.28m/s. The dotted lines
in the figure show the delta winglet when looking upstream. A high vorticity region
corresponds to the vortex. The region where the velocity vectors is pointing downward,
into the heated surface, is called the “inflow region,” while the region where the velocity
vectors point away from the surface is termed the “outflow region.” Cooler freestream air
is brought to the hot surface in the inflow region and quickly sweeps to the right, and thus,
the local convective heat transfer rate is notably enhanced. The flow to the right (looking
upstream, as in Fig. 3.7) of the inflow region is dragged along the hot surface to the right.
This heated air is subsequently scooped away from the surface by the outgoing flow in the
outflow region. As this volume of air is saturated with thermal energy, it resulted in a local
reduction in Nu; see Fig. 3.4.
The longitude vortex is bounded by the inflow and outflow regions. The highest
vorticity region, consisting of the streamlines formed from the leading edge of the winglet,
is the vortex core [24]. Other than the main vortex, smaller vortices induced by the main
vortex are also detected. The location of the main vortex moves to the right, in the positive
Y direction, as the inclination angle increases. This corroborates well with the local Nu/Nu0
results shown in Fig. 3.4c, where the peak Nu/Nuo occurs in the proximity of the inflow
53
Figure 3. 7 Velocity vectors in the YZ plane and cross-stream non-dimensional
vorticity (𝜴) contours at 13h (200mm) downstream, (a) β = 60, (b) β = 90, (c) β =
54 The inflow and outflow regions can also be inferred from the average W (vertical)
velocity within the boundary layer (Z/h ≤ 2); see Figs. 3.8 and 3.9. As expected, the largest
into-the-plate velocity coincides with the inflow region, while the largest out-of-plate
velocity correlates to the outflow region. These locations also substantiate the peak and
valley of Nu/Nu0 depicted in Fig. 3.4c, with the peak corresponding roughly to the
switching from negative W into a positive one. The inflow region moves to the right, in the
positive Y direction, by approximately 0.53h (8mm) as the inclination angle increases from
60° to 120°. The into-the-plate velocity in the inflow region is the largest when the
inclination angle is 120°, implying that the largest amount cool air is brought down to the
surface, and quickly swept to the right, into the outflow. As such, the location of the inflow
55
Figure 3. 8 𝑾̅̅̅/𝑼∞, averaged from Z/h 0.2 to 2, versus Y/h.
To further elucidate the flow field, the boundary layer and velocity vectors are
plotted in Fig. 3.9. It is clear from the figure that the vortical flow significantly distorted
the flow field, including the boundary layer. The inner boundary layer where 𝑈̅/𝑈∞ ≤
0.95 is squashed by the longitude vortex in the inflow region and extended away from
the surface in the outflow region. These characteristics have also been observed by
Hernon and Patten [25]. As a consequence, the thermal resistance of the inflow region
is reduced while that in the outflow region is increased, as far as the boundary layer
thickness is concerned. In agreement with Nu/Nuo and 𝑊̅ /𝑈∞ results, the swirling