ABSTRACT
SCHWARTZ, BLAKE EVAN. An Evaluation of US Army Special Operations Command’s Requirements and Capabilities Analysis System using Condition Number Analysis and Scaling of Quantized Responses. (Under the direction of Dr. Thom Hodgson).
An Evaluation of US Army Special Operations Command’s Requirements and Capabilities Analysis System using Condition Number Analysis and Scaling of
Quantized Responses
by
Blake Evan Schwartz
A thesis submitted to the Graduate Faculty of North Carolina State University
in partial fulfillment of the requirements for the degree of
Master of Science
Operations Research
Raleigh, North Carolina 2013
APPROVED BY:
_______________________________ ______________________________ Dr. Thom Hodgson Dr. Russell King
BIOGRAPHY
MAJ Blake Evan Schwartz is a 2003 graduate of the United States Military Academy at West Point, where he double majored in Spanish and German. Blake was commissioned into the US Army as a Second Lieutenant in the Infantry upon graduation. He has served multiple combat deployments as an Infantry and Special Forces officer. In 2011, Blake was selected to join the Operations Research/ Systems Analysis branch. He then attended North Carolina State University under the Army’s Advanced Civil Schooling program to earn a Master of
ACKNOWLEDGMENTS
TABLE OF CONTENTS
LIST OF TABLES ... ... v
LIST OF FIGURES ... ... vi
I. BACKGROUND ... ... 1
II. ANALYSIS OF THE CURRENT SYSTEM ... ... 5
III. ISSUES WITH THE REQUIREMENTS AND CAPABILITIES ANALYSIS SYSTEM ... ... 12
IV. METHODS: CONDITION NUMBER ANALYSIS ... ... 22
V. METHODS: SCALING OF WEIGHTS ... ... 29
VI. RESULTS ... ... 34
VII. DISCUSSION OF RESULTS .. ... 46
VIII. CONCLUSIONS AND RECOMMENDATIONS ... ... 53
IX. AREAS FOR FURTHER STUDY ... ... 60
X. REFERENCES ... ... 62
APPENDICES ... ... 63
A. OFFICE OF THE SECRETARY OF DEFENSE APPROVED JOINT CAPABILITY AREAS ... ... 64
B. REQUIREMENTS AND CAPABILITIES ANALYSIS SYSTEM LOGIC REPLICATOR ... 65
D. OUTPUT OF SENSITIVITY OF JOINT CAPABILITY AREA
LIST OF TABLES
Table 1: Proportions of all responses by unit ... ... 13
Table 2: Simple Statistics of responses for Special Forces Command ... ... 16
Table 3: Rescaled Simple Statistics of responses for Special Forces Command ... 17
Table 4: Distribution of responses over commands ... ... 17
Table 5: Responses by command ... ... 18
Table 6: Expected Responses by command ... 19
Table 7: (nij - Êij)2 / Êij values ... 19
LIST OF FIGURES
Figure 1: Illustration of Requirements and Capabilities Analysis system logic ... 9
Figure 2: Goodness of Fit Testing for Command Responses against total Response Distribution ... 15
Figure 3: The A matrix ... 24
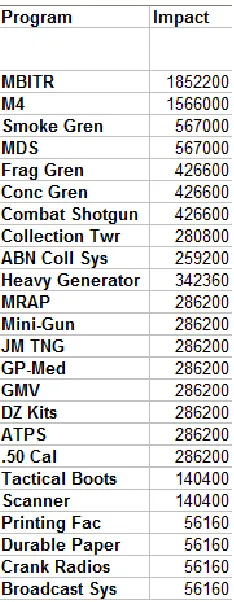
Figure 4: the b vector of prioritized Elements of Cost ... 25
Figure 5: The A matrix and inverse of its truncated version ... 36
Figure 6: The modified A matrix with its inverse and condition number ... 38
Figure 7: SensitivityComparisonof Original and Revised Data... ...40
I. BACKGROUND
US Army Special Operations Command (USASOC) is a subordinate command of Special Operations Command (SOCOM) in the US Army. USASOC has its headquarters at Ft. Bragg, NC. The units subordinate to USASOC include the Army’s Special Operations
The Requirements and Capabilities Analysis System is a database-structured system which links Elements of Cost (such as materiel, training, weapons systems, etc.) to
capabilities that USASOC units are required to have. The capabilities are defined as Joint Capability Areas published by the Department of Defense. For example, Maneuver to Engage is a Joint Capability Area. The approved Joint Capability Areas that the
Requirements and Capabilities Analysis System includes are included in Appendix A. To continue with the example, each unit subordinate to USASOC, at every echelon, is evaluated to determine how important the capability to Maneuver to Engage is to performing each of their core missions. It has been determined that for every Special Forces Company, for example, Maneuver to Engage has a Critical level of importance for the Special Forces core mission of Counter-Terrorism. The three possible levels of importance, in decreasing level of importance, are Critical, Essential, and Enhancing. For other types of units, or at other echelons, Maneuver to Engage may be less important than for Special Forces Companies. The capability may also be less important for Special Forces Companies conducting a different core mission, such as Foreign Internal Defense.
Each Joint Capability Area has component Tasks, and the Elements of Cost support the Tasks. Each Task is determined to be Critical, Essential, or Enhancing to its parent Joint Capability Area, and each Element of Cost is determined to be Critical, Essential, or
Enhancing to the Task it supports. The contribution of each Element of Cost to enhancing each specific capability required of a unit (as defined by the Joint Capability Areas) is therefore measurable. USASOC’s goal is to determine how best to allocate funding to the
defined by the Joint Capability Areas. [3] defines USASOC’s enduring goal of using optimization to allocate resources to enhance capabilities.
Currently, the optimizer that SOCOM is implementing to allocate resources uses a Prioritized Required Capabilities List, which is a ranked list of the capabilities of each unit type at each echelon. Funding of Elements of Cost is determined using the relationship of each Element of Cost to each capability, for each unit type, core mission, and echelon. One disadvantage of this method is that the contribution of each Element of Cost to each
capability is determined by imprecise means, primarily by expert assessment at SOCOM [2]. The Requirements and Capabilities Analysis System, if adopted in totality by SOCOM, would rectify this by defining the contributions of each Element of Cost, measured as the levels of importance to each Task, and each Task’s level of importance to each capability.
The levels for each Element of Cost and Task are determined by unit survey, so the end users of the Elements of Cost determine the response levels. The capability of the Requirements and Capabilities Analysis System to rank each Element of Cost by overall contribution to any subset of USASOC units is also critical for USASOC’s allocation of its own resources, even
if the system is not adopted by SOCOM. If SOCOM continues to use the Strategy-to-Task Optimizing Resource Model in its current form, USASOC would use the Requirements and Capabilities Analysis system for its own internal budgeting, and to provide the Prioritized Capabilities List for use by SOCOM and the Strategy-to-Task Optimizing Resource Model.
be helpful to reference the Weight Generator tab of the Requirements and Capabilities Analysis System Logic Replicator in EXCEL, attached as Appendix B.
USASOC is still working to implement the Requirements and Capabilities Analysis System, and has not done an evaluation of the sensitivity or validity of the system. The purpose of this study is to conduct an analysis of the logic and sensitivity of the
Requirements and Capabilities Analysis System, determine whether the system is constructed in a way that achieves what USASOC intends, and make recommendations for
II. ANALYSIS OF THE CURRENT SYSTEM
The Requirements and Capabilities Analysis System has two primary outputs: relative weights for each of the capabilities that are required of USASOC units, and relative weights for each Element of Cost that USASOC units may spend money on. While the current system that SOCOM is implementing utilizes a prioritized list of capabilities, USASOC hopes that SOCOM will adopt the Requirements and Capabilities Analysis system in total, and use the prioritized list of Elements of Cost to allocate resources [1]. First, we will address the mechanism by which the Requirements and Capabilities Analysis System generates a prioritized list of capabilities. The concept is to define the capabilities required of each USASOC unit, then evaluate which capabilities are most important to the units’ overall mission success. We can then allocate resources to the units by determining how much each Element of Cost contributes to a capability for one of the units conducting one of its missions. This last part may be done by the Requirements and Capabilities Analysis system, using the prioritized list of Elements of Cost that it can generate, or can be done separately (as SOCOM currently intends).
Attribute 1): Core Operation or Core Activity being conducted. The USASOC Core Operations are: Unconventional Warfare, Foreign Internal Defense, Counter-Weapons of Mass Destruction, Counter-Insurgency, Counter-Terrorism, Stability Operations, and Support to Major Operations and Campaigns. The USASOC Core Activities are: Civil Affairs
Operations, Direct Action, Hostage Rescue and Recovery, Interdiction and Offensive Weapons of Mass Destruction Operations, Military Information Support Operations, Preparation of the Environment, Security Forces Assistance, Special Reconnaissance, Combat Support/ Combat Service Support. Each mission conducted by a USASOC unit involves one or more Core Operations and Core Activities. Every Joint Capability Area is evaluated as Critical, Essential, Enhancing, or Not Applicable for each Core Operation and Core Activity. See Appendix E for the responses for each Core Operation and Core Activity by each USASOC command.
Attribute 2): Unit. This describes the echelon and type of unit conducting the mission.
Attribute 3): Frequency. Many missions recur regularly, and the frequency is the number of times an identical mission occurs during the time period being evaluated.
Attribute 4): Quantity. This denotes how many of the unit in question are performing the mission. For example, a mission may call for four Special Forces teams.
Attribute 5): Duration. This denotes the length of the mission, in days.
To determine the weight for each capability, the Requirements and Capabilities Analysis System identifies each instance of the capability being required for a mission during the time period under consideration. For each instance, it multiplies the Frequency *
Quantity * Duration * a criticality score associated with the Critical, Essential, or Enhancing level of importance. The criticality scores are currently set to 15 for Critical, 9 for Essential, and 5 for Enhancing. If a capability is not applicable to a mission, the criticality score is zero, so the instance is not counted toward the capability’s weight. There is also an optional Commander’s Priority weight assigned to each mission. This value may be included in the
product for each instance to allow the commander greater control in applying resources to missions that he views are the most important. The Requirements and Capabilities Analysis System then sums the products for each instance to determine the raw score for each
capability. It rank orders the capabilities to produce a Prioritized Required Capabilities List, which is to be used by the optimizer to determine the relative importance of capabilities to fund.
The current system that SOCOM, the higher headquarters for USASOC, is implementing uses a Prioritized Required Capabilities List to determine the relative
importance of each capability to fund, but it uses a highly subjective method of determining the impact an Element of Cost will have on a capability. SOCOM currently uses surveys from units and a few analysts’ expertise to assign the relative weights for the impact of an Element of Cost on a capability [2]. One of the advantages of the Requirements and
Prioritized Required Capabilities List, creating much more sound relative weights for each Element of Cost.
The Requirements and Capabilities Analysis System evaluates each Element of Cost by determining a score for it, similar to the score for each capability. As with the capability scores, the scale of each score individually is meaningless; but the scores are compared, ranked, and each score’s percentage of the total of all scores is determined. That percentage
is then used to rank the Elements of Cost. The score for each Element of Cost is generated in a similar manner to the capability scores, with the added dimension of a doctrinal component. Each Joint Capability Area is doctrinally defined to contain tasks. For a unit to possess the capability defined in the Joint Capability Area, it must be able to conduct the Tasks that constitute the capability. A Task may be used in multiple Joint Capability Areas. Similarly, each Task is doctrinally defined to have Elements of Cost that support it. For example, the Joint Capability Area Maneuver to Engage may have the Task Conduct Convoy Operations. One among many Elements of Cost supporting the Task may be the Ground Mobility
Vehicle. Each Task is assessed to be either Critical, Essential, or Enhancing to each Joint Capability Area where it is applicable. Similarly, each Element of Cost is assessed to be Critical, Essential, or Enhancing to each Tasks that utilizes it. The Critical, Essential, and Enhancing levels are again assigned weights of 15, 9, and 5 respectively.
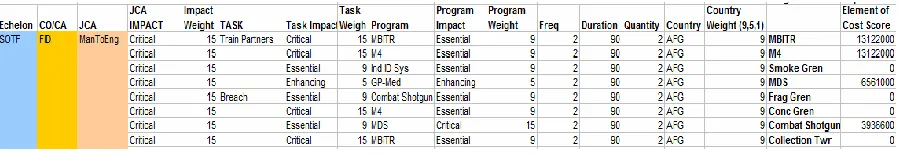
For illustration, Figure 1 below shows a few Tasks and supporting Elements of Cost under the Maneuver to Engage Joint Capability Area, for one echelon of Special Forces, for the Core Mission of Foreign Internal Defense. The total Element of Cost score in the last column is the sum of the products resulting from each instance of an Element of Cost supporting a Task. For the Element of Cost M4, for example, we calculate:
Capability Weight (Column 5) * Task Weight (Column 8) * Element of Cost Weight (Column 11) * Frequency * Duration * Quantity * Country Weight (Column 16)
= Total for first instance of M4
The final score is then the summation of the products for each instance, so the total score for each Element of Cost is given by:
, where n is the number of instances of an Element of Cost.
We then add the totals for the two instances of M4 to get the final score in the last column.
Figure 1- Illustration of Requirements and Capabilities Analysis system logic.
* * * * * *
j j j j j j j
Capability Task ElementOfCost Freq Dur Qty Ctry
1
* * * * * *
n
j j j j j j j
j
Capability Task ElementOfCost Freq Dur Qty Ctry
As shown, each Element of Cost may have multiple instances under each mission because it may support more than one Task, and more than one Capability. The products determined for each instance of an Element of Cost are then summed to yield a final score for each Element of Cost. The Elements of Cost are then ranked by percentage of the total of all scores, and this percentage becomes the relative weight for each Element of Cost. When the optimizer at SOCOM determines the best portfolio for meeting capability requirements, it will use the relative weights for each Element of Cost to measure its impact on a Joint Capability Requirement. The optimizer uses dependencies and redundancies between
Elements of Cost as constraints, and other constraints may be added to enable commanders to fund capabilities and Elements of Cost they consider indispensable. It should be noted that the optimizer used by SOCOM uses a system that will not be discussed in depth here to determine the price of each Element of Cost, allowing it to determine an optimal portfolio for maximizing capabilities while meeting the budgetary constraints of SOCOM. In addition to their importance for SOCOM’s optimizer, USASOC intends to use the relative weights for
III. ISSUES WITH THE REQUIREMENTS AND CAPABILITIES ANALYSIS SYSTEM
During our evaluation of the Requirements and Capabilities Analysis System, we determined that there are two issues with the system as it currently stands. Both concern the inputs to the system; the logic that generates a prioritized list of the Elements of Cost is very sound, but the inputs to the system are flawed. Our two concerns are:
1). When prompted by survey to evaluate the importance of each Joint Capability Area to each of the USASOC core missions, many of the units rated too many of the capabilities as Critical. We will discuss the implications of this fault, and make recommendations to rectify the distribution of the responses.
2). The numerical values assigned to the importance levels (Critical, Essential, and
Enhancing) are arbitrary, not based on any analysis or concrete metric. We will discuss and recommend appropriate methods for determining quantitative values for these qualitative levels.
We verified that 1) is an issue with the system by determining the mean and standard deviations for values of programs, organized by type of USASOC unit. The results are attached as Appendix C. While some of the USASOC elements showed a relatively
were as close as within 11% of the scale to the Critical value, much closer than to the
Essential value on the scale. With the weights set at [15, 9, 5], mean response values for one element was as high as 13.3. Because the data is not mound shaped, the standard deviations can not be easily used to approximate confidence intervals for the responses. For example, using the Empirical Rule, a 95% Confidence Interval for Special Forces responses would be [6.48 – 20.12]. The upper value is completely meaningless because the highest value possible out of the three discrete choices is 15. The lower value is also of very little value, since the scale is not continuous and does not include the value 6.48. This determination of the first two moments for the response data confirmed what appeared to be the case with the raw responses, i.e. that some units responded that a very high proportion of Joint Capability Areas were Critical regardless of the core mission, while other units responded with a more central distribution. However, we wanted to conduct a more explicit test of the responses, and perform a qualitative test that would divorce the response data from the scale of the values chosen for them. In order to do this, we started by performing a simple Chi-Squared Goodness of Fitness Test on the data to determine whether the proportions of the responses of each type matched an expected proportion. For the expected proportion, we used the proportions of all responses by all units, given below in Table 1.
Table 1- Proportions of all responses by unit.
Total All Data
Total Count Proportion
Critical 34055 0.535178
Essential 16867 0.265067
For example, as indicated above, the proportion of all responses that was Critical was 0.535. The Chi-Squared test was to determine whether Special Forces units, Ranger units, and the other unit types responded in the same proportions as the overall data. The Chi-Squared test is given by
Χ2=∑[(n i-Ei)
2
/Ei] ,
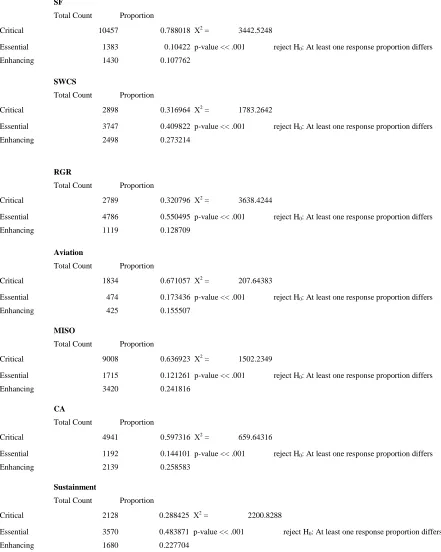
with n-1 = 2 degrees of freedom. The critical value for testing at the α=.05 level is 5.991. The results of the Chi-Squared tests for each of the USASOC component commands (Special Forces, JFK Special Warfare Training Center and School, Rangers, Special Operations Aviation, Military Information Support Operations, Civil Affairs, and Sustainment) are given below in Figure 2. For all 7 commands, we reject the null hypothesis and conclude that the response proportions for the command in question differ from the overall response
SF
Total Count Proportion
Critical 10457 0.788018 Χ2 = 3442.5248
Essential 1383 0.10422 p-value << .001 reject H0: At least one response proportion differs
Enhancing 1430 0.107762
SWCS
Total Count Proportion
Critical 2898 0.316964 Χ2 = 1783.2642
Essential 3747 0.409822 p-value << .001 reject H0: At least one response proportion differs
Enhancing 2498 0.273214
RGR
Total Count Proportion
Critical 2789 0.320796 Χ2 = 3638.4244
Essential 4786 0.550495 p-value << .001 reject H0: At least one response proportion differs
Enhancing 1119 0.128709
Aviation
Total Count Proportion
Critical 1834 0.671057 Χ2 = 207.64383
Essential 474 0.173436 p-value << .001 reject H0: At least one response proportion differs
Enhancing 425 0.155507
MISO
Total Count Proportion
Critical 9008 0.636923 Χ2 = 1502.2349
Essential 1715 0.121261 p-value << .001 reject H0: At least one response proportion differs
Enhancing 3420 0.241816
CA
Total Count Proportion
Critical 4941 0.597316 Χ2 = 659.64316
Essential 1192 0.144101 p-value << .001 reject H0: At least one response proportion differs
Enhancing 2139 0.258583
Sustainment
Total Count Proportion
Critical 2128 0.288425 Χ2 = 2200.8288
Essential 3570 0.483871 p-value << .001 reject H0: At least one response proportion differs
Enhancing 1680 0.227704
These results led me to conclude that the different commands responded to the surveys about the importance of capabilities with a different distribution of responses. Next we wanted to determine whether a stronger conclusion could be drawn that would indicate that the commands responded to the surveys using different metrics. Simple statistics about the responses (given in Appendix C) indicate that some commands were much more likely to respond with a value of Critical than other commands were. The means and standard
deviations of the responses could normally be used to conduct confidence interval analysis to determine whether the confidence intervals for expected response values from different commands would overlap. For example, for Special Forces Command, the simple statistics of responses are given below in Table 2.
Table 2- Simple Statistics of responses for Special Forces Command.
Mean 13.3
Variance 11.63
Std Dev 3.41
Table 3- Rescaled Simple Statistics of responses for Special Forces Command.
Mean 2.68
Variance 0.43
Std Dev 0.66
This dependence on the assigned values of responses led me to conclude that the responses should be evaluated using categorical, or qualitative testing. We conducted a Chi-Squared Test for Independence with the independent variable as Command and the
dependent variable Response. Using the raw response data provided in Appendix C, we constructed a table showing the distribution of responses over the different commands, given below in Table 4.
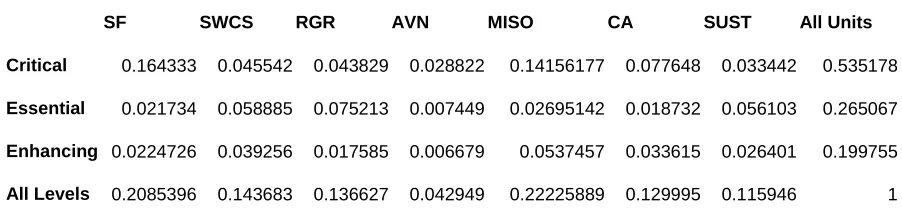
Table 4- Distribution of responses over commands.
SF SWCS RGR AVN MISO CA SUST All Units
Critical 0.164333 0.045542 0.043829 0.028822 0.14156177 0.077648 0.033442 0.535178
Essential 0.021734 0.058885 0.075213 0.007449 0.02695142 0.018732 0.056103 0.265067
Enhancing 0.0224726 0.039256 0.017585 0.006679 0.0537457 0.033615 0.026401 0.199755
All Levels 0.2085396 0.143683 0.136627 0.042949 0.22225889 0.129995 0.115946 1
the first cell [SF, Critical] representing the proportion of all responses that were both Critical and performed by Special Forces Command, the content is 0.164333. The Expected value if independence were true is 0.2085396*0.535178 = 0.111606. These two values are clearly not equivalent, nor are the results for the rest of the table’s cells. This provides our first indication that the variables are not independent.
Next we performed the actual Chi-Squared test for independence between the two variables. The null hypothesis is that the Command and Response variables are independent. The Chi-Squared value is given by:
Χ2=∑
ij(nij - Êij)
2
/Êij
where nij is the value in row i and column j of the data table of actual responses and Êij is the
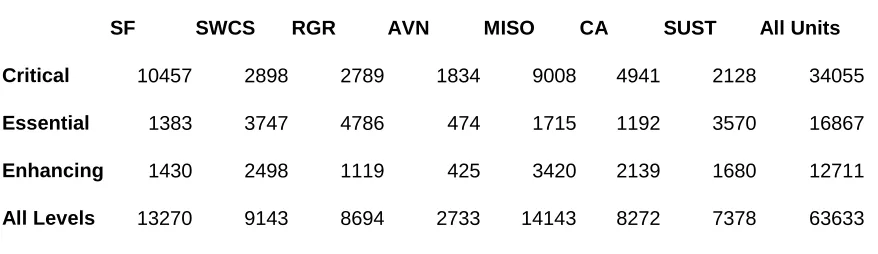
value in row i and column j of the table of expected responses. The large number of responses means that the Chi-Squared test is a valid approach, even though it is usually preferred for comparing multiple variables to an independent variable. First, we constructed the table of actual responses from the data given in Appendix C, shown below in Table 5:
Table 5- Responses by Command.
SF SWCS RGR AVN MISO CA SUST All Units Critical 10457 2898 2789 1834 9008 4941 2128 34055
Essential 1383 3747 4786 474 1715 1192 3570 16867
Enhancing 1430 2498 1119 425 3420 2139 1680 12711
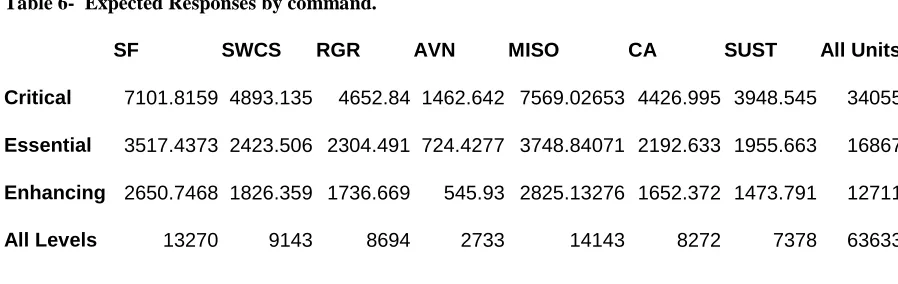
Next we constructed the table of expected responses, where the value for each cell = (total number of responses at the response level/ total of all responses) * (total number of responses for the command). The resulting table is shown in Table 6 below:
Table 6- Expected Responses by command.
SF SWCS RGR AVN MISO CA SUST All Units Critical 7101.8159 4893.135 4652.84 1462.642 7569.02653 4426.995 3948.545 34055
Essential 3517.4373 2423.506 2304.491 724.4277 3748.84071 2192.633 1955.663 16867
Enhancing 2650.7468 1826.359 1736.669 545.93 2825.13276 1652.372 1473.791 12711
All Levels 13270 9143 8694 2733 14143 8272 7378 63633
The Chi-Squared statistic can then be calculated. We did this by making a table of the (nij -
Êij)
2
/ Êijvalues, which were then easy to sum. This table is given in Figure 6 below:
Table 7- (nij - Êij)2 / Êij values.
SF SWCS RGR AVN MISO CA SUST Critical 1585.1242 813.4997 746.6192 94.28592 273.568159 59.67962 839.3941
Essential 1295.2108 722.769 2672.123 86.57048 1103.40992 456.6503 1332.583
Enhancing 562.18976 246.9955 219.6818 26.78743 125.25678 143.3132 28.85215
This is tested against the critical Chi-Squared value at α=.05 with degrees of freedom
(rows-1) * columns-(rows-1) = 12. The critical value in this case is 22.36. It is clear that the test value is far greater than the critical value, so we strongly reject the null hypothesis of independence. We conclude that there is a dependency relationship between the USASOC command and the response level.
This is an important conclusion, and confirms that different USASOC commands responded to the survey about Joint Capability Areas using a different scale. Some commands were much more likely than others to respond that any given capability was Critical, and had a much higher proportion of Critical responses. This causes a few problems for the system. First, if some commands respond with a higher baseline response, all the Elements of Cost that support the capabilities used by these commands will have an advantage because they will be evaluated as Critical more often. So commands that
responded with primarily Critical values will be relatively better supported by the results of the Requirements and Capabilities Analysis System. For the system to work as intended, commands should not be able to gain an advantage for all of their Elements of Cost by responding that almost everything is Critical. For USASOC’s Elements of Cost to be
evaluated fairly, USASOC commands must respond on an even scale.
IV. METHODS: CONDITION NUMBER ANALYSIS
During this study, we conducted a simple sensitivity analysis of the Requirements and Capabilities Analysis System by recreating the logic behind the system’s report generator in
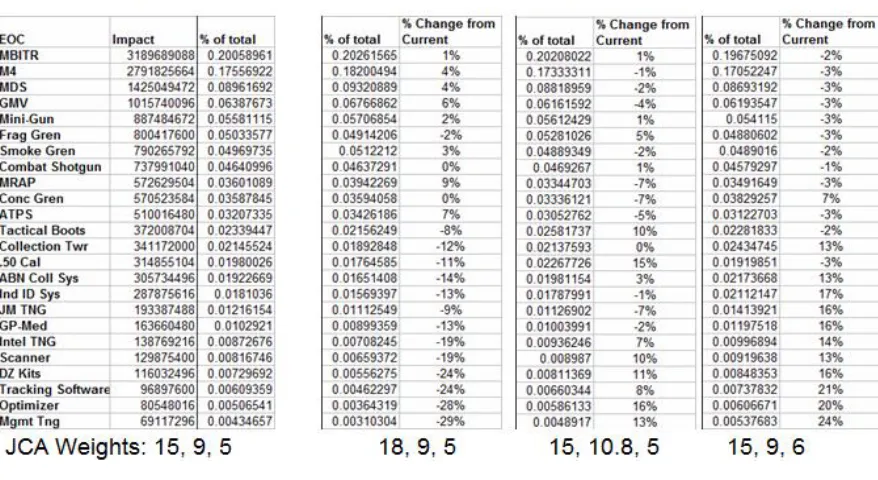
EXCEL. Because of the massive size of the database, we limited the Replicator to only two core operations, three echelons of Special Forces, and five Joint Capability Areas. The actual database contains data for sixteen Core Operations and Core Activities, and seven types of units with two to seven echelons for each unit type. Using the smaller set for simulation, we determined the change in the prioritized list of Elements of Cost that resulted from changing the values of the weights assigned to the Critical, Essential, and Enhancing characterizations for Joint Capability Areas, Tasks, and Elements of Cost. Currently, USASOC has the weights at each level the same: Critical is always 15, Essential is 9, and Enhancing is 5. We changed each of these values for the Joint Capability Areas by 20% for each level, and evaluated the resulting changes using the Weight Generator tab of the Logic Replicator (Appendix B). The results are detailed in Appendix D, and show that 20% changes in the Joint Capability Area values result in changes in up to 29% in the percentage of total score for individual Joint Capability Areas. Changing the relationship between Critical and Enhancing had the largest effect, and it was on items that tend to be rated Enhancing. These tend to be less frequently used, so their weights have greater impact on their relative
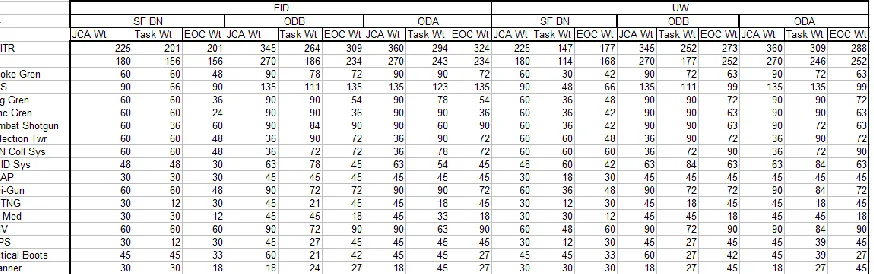
in the database. If we had used averages, every entry in the matrix would be between the minimum and maximum weight value, and the conditioning of the matrix would not reflect the diversity of the true data very well. Including the database frequency of response by making the matrix entries sums allowed the different frequencies with which Elements of Cost appear affect the conditioning of the matrix, as they affect the prioritized list of Elements of Cost generated by the Requirements and Capabilities Analysis system. See Figure 7 below for the A matrix derived from the responses. The Logic Replicator in Appendix B shows how the fields are fully realized in the database, and Figure 3 shows the compression of the matrix form.
Figure 3- The A matrix. Elements of Cost are the vertical axis, Core Missions/ Echelons/ Response Types are the horizontal axis.
Element of Cost (i.e. the b vector) using the A matrix and all missions which use the Elements of Cost. Each mission has a frequency (number of times a mission is conducted during the cycle), duration (in days), quantity (number of units in the echelon conducting the mission), and a country weight that allows the commander to prioritize which countries have greater import. The operations on A that yield the results b in our matrix construct are a function of these mission factors. They relate the doctrinal information in A to the computation of scores that reflect mission use as well.
The advantage of transforming the database into matrix form is that we can then examine the matrix using its condition number to draw conclusions about the database system. The condition number C of a matrix is the ratio of the matrix’s largest to smallest singular value, and is a measure of the matrix’s sensitivity [4,5]. With the form Ax=b: if A
has a high condition number, small changes in b may necessitate large changes in A. Similarly, small changes in A may result in large changes in b. For the Requirements and Capabilities Analysis system, this means that small changes in inputs of weights given to Joint Capability Areas, Tasks, or Elements of Cost may result in large differences in the results of the report. This could be very significant for the Requirements and Capabilities Analysis system because the values that constitute the A matrix are subjective. The Critical, Essential, or Enhancing characterizations for Joint Capability Areas, Tasks, and Elements of Cost are determined through surveys at the unit level and through expert estimation at USASOC. It is important for the validity of the results that the final report’s values do not
fluctuate greatly with small differences in these responses.
Another interpretation of the condition number is also important. In general, the condition number of a matrix gives an upper bound on how much precision may be lost when solving a system of equations using the matrix. The expression log10(C) is a bound on the
number of digits of precision that may be lost. For example, the condition number associated with the equation Ax = b gives a bound on how inaccurate the solution x will be after
number is small then the error in the solution will not be much bigger than the error in the inputs.
||A|| * ||A-1|| is a commonly accepted means of computing the condition number of a square matrix [6], and is the method we adopted for this study. We applied this method to the A matrix we derived from the Requirements and Capabilities Analysis system data, multiplying the norm of A times the norm of A-1 to find the condition number.
V. METHODS: SCALING OF WEIGHTS
Issue 2) is equally important to the validity of the Requirements and Capabilities Analysis System’s results. The valuations of 15, 9, and 5 respectively for the levels of Critical, Essential, and Enhancing were arbitrary and without basis in analysis [1]. The first step in assigning quantitative values to qualitative responses is to identify the metric on which we are measuring the responses [8]. In this case, we look at the definitions of the levels used in the surveys:
Critical: “Mission failure or operational show stopper” if this element is lacking. Essential: “New or improved capability or increased probability of success” with this
element.
Enhancing: This element “will enhance operational effectiveness, improve quality of life, improve efficiency; not critical or essential for mission accomplishment.”
These were the definitions given for the levels for the Joint Capability Areas, Tasks, and Elements of Cost, but they are most suitable for the Elements of Cost. It is not very meaningful to say that a capability (as defined by the Joint Capability Areas) will grant a unit a “new or improved capability or increased probability of success” in conducting a core
Critical: Used by over 90% of units at this echelon conducting this core mission. Essential: Used by over 40% of units at this echelon conducting this core mission. Enhancing: Used by over 5% of units at this echelon conducting this core mission.
With this metric, there is a clear definition of the levels that is uniformly applicable (and verifiable) across all component units of USASOC. The resulting weights should then be:
Critical: 9 Essential: 4 Enhancing: 0.5
With this method, the levels are no longer a subjective judgment that units could game to try to garner the most resources for the Elements of Cost that their units want. The metric is also expandable to a continuous spectrum- if desired, units need not be constrained to three levels. The levels could simply be (percent of units utilizing the Capability) / 10. As the levels are individually read by the Requirements and Capabilities Analysis System
currently, this would not add processing time or otherwise compromise the current method of prioritizing the Elements of Cost.
success. Essential meant that success did not depend on the Capability, but that it provided increased probability of success or additional options. Enhancing meant that the Capability provided enhanced efficiency or quality of life, but would not effect mission success. With these definitions, Essential was closer to Enhancing than to Critical. With our new scaling, Essential is 35 percentage points from Enhancing and 50 percentage points from Critical. It makes sense that if a Capability is necessary for mission success, it should be required for nearly all missions of that type. Similarly, a Capability should only be Enhancing if it is very rarely utilized.
It is important to note that the scale of the impacts is only important in a relative sense. Since every instance of each Element of Cost is multiplied by a Joint Capability Area multiplier (see the Logic Replicator in Appendix B), the values of the multipliers relative to each other are the only factor that matters. We can scale all of the values to a 0-1 scale (or any other scale) without changing the prioritized Element of Cost list that the Requirements and Capabilities Analysis System produces. We drew on the concepts in [8] to devise this scale, and experimented in the Logic Replicator to verify that changing the weights by a common factor did not alter the results. On a 0-1 scale, the values become:
Original Weights: [15, 9, 5] [1.0, .600, .333] New Weights: [9, 4, 0.5] [1.0, .444, .056]
Essential is 40 percentage points from Critical and 26.7 percentage points from Enhancing (when converted to a 0-100 percentage point scale). Under our new scale, Essential is 55.6 percentage points from Critical and 38.8 percentage points from Enhancing (when converted to a 0-100 percentage point scale). So changing to the new weights expands the difference between Critical and Essential by 15.6 / 40 = 39.0%, and expands the difference between Essential and Enhancing by 12.1 / 26.7 = 45.3%. It can be seen on the 0-1 scale that both the Essential and Enhancing values are shifted right, so the Critical level shifts farther from both. The largest absolute difference between how the two scales are evaluated is in the difference between Enhancing and Critical: 66.7 percentage points under the old scale vs. 94.5 percentage points under our new scale, for a difference of 27.8 percentage points between the two weighting systems. The new scale expands the difference between Enhancing and Critical by 27.8 / 66.7 = 41.7%.
These changes to the weights for Joint Capability Areas make sense in that they reflect how USASOC defined the Critical, Essential, and Enhancing levels. The relative differences in percentage points between the levels reflect what the verbiage defining the levels suggests should be reasonable differences between the levels, when we use the new weights. However, using the new system of determining weights (by assessing the
VI. RESULTS
In this section, we will present the results of our condition number analysis of the system, the results of forcing a better distribution on the responses for Joint Capability Areas, and the results of changing the impact level weights to the values we recommend. Let’s start with a simple change to the impact level weights we propose, [9, 4, 0.5]. Using the original response data as it currently stands, we changed the impact levels to the following:
Critical was 15; becomes 9 Essential was 9; becomes 4 Enhancing was 5; becomes 0.5
levels. The Logic Replicator results confirmed this anticipated affect. The complete sensitivity results are detailed in Appendix D.
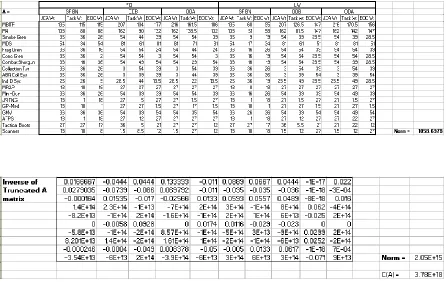
We then need to address Issue 1) with the system, the skewed and inconsistent distribution of the data. Before applying the improved scale, we must evaluate the results of the condition number analysis testing the distribution of the response data. The A matrix that results from our method of transforming the original database information is so near singular that it is non-invertible. Figure 5 below shows the A matrix. Also included in Figure 5, we calculated the inverse of a truncated version of A, meaning we did not include some of the rows and columns of the original matrix. We calculated this truncated inverse in order to find a lower bound for the condition number of A. Since A was non-invertible in its full form, we were not able to calculate the actual condition number because the norm of A’s
inverse does not exist. Therefore, we truncated it the matrix to the minimum extent possible that would enable it to be invertible so that we could find the norm of the (truncated) inverted matrix. Then the norm of the truncated version, A’-1, must be >= the norm of the full A-1. So a lower bound for the condition number of A is given by ||A|| * || A’-1||. This lower bound is calculated to be:
C(A) = ||A|| * || A’-1||
Figure 5- The A matrix and inverse of its truncated version
The huge lower bound on the condition number (3.78 * 10^18) indicates that the actual condition number C(A) is also huge. This indicates that the vector b, which represents the values in the Requirements and Capabilities Analysis System report, could vary greatly with small changes in A. Log(C), the number of digits of precision that may be lost when solving a system of equations using this matrix, was found to be 18.58 for the lower bound. This is a very large number of digits, so the imprecision of solving a system of equations using the A
matrix would be tremendous. In our case, however, we are not using the matrix to solve a system of equations. Rather, the matrix represents the coefficients used to generate a vector with a “score” for each Element of Cost. These scores are products along each row of the
not propagated the way it would be when solving a system of equations. Rather, the
imprecision is more directly transferred to the solution b. Since we are not using the matrix to solve a system of equations, the log(C) measurement of precision is therefore not directly applicable, though the well-established principle of increasing imprecision with rising condition number does hold. We will further explore the exact nature of the correlation later in this paper.
To address the issue of the system’s poorly distributed impact ratings, we needed to
alter it so that not as many Joint Capability Areas were rated as Critical. This change would be equivalent to enforcing a policy on USASOC units requiring them to limit the number of Critical responses they could allocate. After changing the response data for Joint Capabilities Areas so that it is more centrally distributed, we can then test the sensitivity to changes by altering each weight level value by 20%, as we did earlier. We made the data better distributed by altering the impact levels for individual Joint Capability Areas for unit-echelons so that no more than 40% of the responses were overall were at any one level.
Visual inspection of the Requirements and Capabilities Analysis System database indicates that A is nearly singular because of the preponderance of the value 15,
commands that created the data would be required to do to meet a forced distribution. We modeled the new A matrix and its inverse, and computed the new condition number C’. See Figure 6 below.
Figure 6- The modified A matrix with its inverse and condition number.
matrix, was calculated to be 4.67. This is a dramatic decrease from log(C) = 18.58, and shows an extremely reduced error.
We then compared the resulting changes between the original and better distributed data. The better distributed data is represented in the Weight Generator New tab of
For most Elements of Cost, the altered weights result in smaller changes in the prioritized list using the data with a forced distribution. On the average, the changes were calculated to be decreased by 20% when using the improved data scheme. Distributing the data better results in better stability, and less dependence on the subjective user input. This corroborates the result we expected from the condition number analysis. Forcing a better distribution on the data led to a lower condition number, and we expect it to make the results of the
Requirements and Capabilities system less sensitive to errors in the inputs. This result was corroborated by the Logic Replicator sensitivity analysis using the two data schemes. When we compared the changes in the final prioritized list of Elements of Cost resulting from altering the weights by 20%, one at a time, as shown in Figure 10 above, the data with the improved distribution yielded results that changed 20% less than the original data’s results. This calculation can be seen in the Sensitivity tab of Appendix D. This result confirms what we expected from the Condition Number analysis: improving the distribution of the data, thereby improving the stability of the matrix and lowering its condition number, makes the resulting b vector less sensitive to variation (and therefore errors) in the A matrix of inputs. The result also confirms that this improvement in the matrix’s stability is not on the
magnitude predicted when using the matrix to solve a system of equations. Log(C(A)) is an estimate of the number of digits of precision lost to error when solving a system of equations using A. In this case, we want to know the difference between the logarithmic function for the original data matrix and the improved data matrix. We have a lower bound for the original matrix’s condition number, using the norms determined earlier. Call this C0. We
C0 and C are both calculated in the Condition Number Analysis tab of Appendix D. As seen
there, C0 = 3.78*10^18, and C = 46716. Then the improvement in stability is:
log(C0) – log (C)
= log(3.78 * 10^18) – log(11502) = 18.58 – 4.67
= 13.91
Clearly a 20% decrease in changes resulting from altering the response weights does not correspond to an estimated 14 or 15 digits of precision improvement, so the improvement to the matrix’s stability when used for our purposes is not on the order of log(C), as it would be
for solving a system of equations.
The rate of increase in imprecision caused by an ill-conditioned matrix is not as high as it would be when solving a system of equations, but the correlation remains true. We tested this by creating an experiment in the Logic Replicator which can be found in
responses in a pattern to create the high-condition number data schemes), and found a significant difference between the two groups. The “low” condition numbers ranged from 753 to 769,018, and the “high” condition numbers ranged from 1.87 * 10^17 to 1.55 * 10^19.
Figure 8 below shows a graph of the results.
Figure 8- Average % Change in Results and a Function of Condition Number
Although within each of the two groups, no correlation is discernible between rising
condition number and level of sensitivity of the data, there is a significant difference between the two groups. The expected value of the average change in results for the low condition number data is 5.99, whereas the expected value of the average change in results for the high condition number data is 8.31. This provides evidence that the increased stability resulting
Percent Change in Results as a Function of C
3 4 5 6 7 8 9 10
from improving the Requirements and Capabilities Analysis system data is not an anomaly. In fact, we included the actual data in the experiment. In the graph above, the original system data point appears in blue, and the improved system data point appears in green. We performed a confidence interval test to verify that, as it appears, there is a statistical
difference between the two groups. The expected values and standard deviations for the low and high condition number groups are listed below in Table 8.
Table 8- Table of Expected % Changes in Response and Standard Deviations.
E(% change) Standard Deviation
Low C 5.982 0.578
High C 8.300 0.552
A simple confidence interval test is illustrative of the difference between the two groups. An approximate 95% confidence interval for each group is:
E(% change) +- 2*σ
The two 95% confidence intervals are then:
Since the confidence intervals do not overlap, we conclude that at the α ≈ 0.05 level, we reject the null hypothesis that there is independence between condition number group and % change in results. We conclude that there is a correlation between the higher condition number group and a higher expected % change in results.
In addition to the instability and increased sensitivity to errors indicated above, we are also concerned that the matrix is ill-conditioned because of the practical considerations we mentioned earlier. If there are too many identical Critical responses, there is no
differentiation between Elements of Cost due to the unit input, which defeats the intent of the weights. In addition, if some commands have almost all their responses as Critical, the Elements of Cost that support those commands’ capabilities will be rated preferentially over
VII. DISCUSSION OF RESULTS
The Condition Number for the A matrix we derived from the Requirements and Capabilities Analysis system indicates that the system as it currently stands is sensitive to relatively small changes in the inputs. This means that the system is sensitive to the values chosen for the Critical, Essential, and Enhancing weight levels, and also that it is more sensitive than it should be to which level is chosen for each individual entry. As the values chosen for the levels are currently arbitrary value judgments, this sensitivity is not desired. In the case of this system, the A matrix we derived represents the inputs into the database for the Requirements and Capabilities Analysis system. Because the matrix is not used directly to solve any system of equations, the normal approximation of log(C) representing the number of digits of precision lost greatly overestimates the loss of precision. However, the sensitivity experiment we conducted confirmed that there is a statistically significant difference between the original scheme, which has a very high condition number, and the improved scheme with a lower condition number.
In addition to undesirable sensitivity to inputs, symptomized by a high condition number, the preponderance of the Critical ranking leads to other issues with the
In addition, since another use of the Requirements and Capabilities Analysis system is for USASOC to internally allocate its budget, USASOC needs to require that all
subordinate commands respond to the surveys using the same criteria. The commands that rate most of the Joint Capability Areas as Critical are essentially responding on a different scale from the commands who rated more of their capabilities as Essential, the middle rating. Commands may be intentionally gaming the system to benefit the capabilities and Elements of Cost pertaining to them, or they may simply be evaluating the capabilities on a different scale or in a different manner. Regardless, for the results of the Requirements and
Capabilities Analysis system to be useful and accurate, this difference must be addressed. The distributions of responses for each command must be more similar, indicating that they are assessing the capabilities on the same scale. At the least, the number of Critical ratings each command can use must be limited. If a unit wants to rate more capabilities than average as Enhancing, they will disadvantage themselves in the system, which may be allowable.
The other issue with the system that needs to be addressed is the arbitrary weights assigned to the impact levels. The weights of [15, 9, 5] assigned to the Critical, Essential, and Enhancing impact levels were not made based on analysis. When we assessed the definitions of the impact levels, as given to me by USASOC, and as used for the surveys of the USASOC commands, we determined that the values should be adjusted. First, the
Critical: Used by over 90% of units at this echelon conducting this core mission. Essential: Used by over 40% of units at this echelon conducting this core mission. Enhancing: Used by over 5% of units at this echelon conducting this core mission.
The resulting weights should then be:
Critical: 9 Essential: 4 Enhancing: 0.5
This metric is better applicable to all the items being evaluated (Joint Capability Areas, Tasks, and Elements of Cost). In addition, this metric provides a clear definition of the levels that is uniformly applicable and verifiable across all component units of USASOC.
USASOC has informed me that the Joint Capability Areas used by each unit for each mission are available, although the information is classified. So the data is not available for this study, but would be available for USASOC to use to implement the metric.
Another advantage of this method of determining the impact weights is that it could be used to assign weights on a continuous spectrum. If USASOC wished to record the utilization of Joint Capability Areas on each mission, it could automatically calculate weights for each capability. To be quasi-continuous, the weights could simply be (percent of
increase computing time for the system time or otherwise compromise the current method of prioritizing the Elements of Cost or Joint Capability Areas.
In order to avoid adding extra work, USASOC may wish to keep the three levels as Critical, Essential, and Enhancing. If this is the case, the percentages we recommend (90%, 40%, and 5% respectively) preserve the intent of the original wording. Originally, Critical meant that the Joint Capability Area had to be present for mission success. Essential meant that success did not depend on the capability, but that it provided increased probability of success or additional options. Enhancing meant that the capability provided enhanced efficiency or quality of life, but would not effect mission success. With these definitions, Essential was closer to Enhancing than to Critical. With our new scaling, Essential is 35 percentage points from Enhancing and 50 percentage points from Critical. It makes sense that if a Capability is necessary for mission success, it should be required for nearly all missions of that type. Similarly, a Capability should only be Enhancing if it is very rarely utilized.
As discussed earlier, the scale of the impacts is only important in a relative sense. We can scale all of the values to a 0-1 scale without changing the prioritized Element of Cost list that the Requirements and Capabilities Analysis System produces. On a 0-1 scale, the values become:
This shows more clearly the difference in how the levels would apply to the Elements of Cost for the Requirements and Capabilities Analysis system’s final report. Under the old scale,
Essential is 40 percentage points from Critical and 26.7 percentage points from Enhancing (when converted to a 0-100 percentage point scale). Under our new scale, Essential is 55.6 percentage points from Critical and 38.8 percentage points from Enhancing (when converted to a 0-100 percentage point scale). So changing to the new weights expands the difference between Critical and Essential by 15.6 / 40 = 39%, and expands the difference between Essential and Enhancing by 12.1 / 26.7 = 45.3%. It can be seen on the 0-1 scale that both the Essential and Enhancing values are shifted right, so the Critical level shifts farther from both. The largest absolute difference between how the two scales are evaluated is in the difference between Enhancing and Critical: 66.7 percentage points under the old scale vs. 94.5 percentage points under our new scale, for a difference of 27.8 percentage points between the two weighting systems. The new scale expands the difference between Enhancing and Critical by 27.8 / 66.7 = 41.7%.
These changes to the weights for Joint Capability Areas make sense in that they reflect how USASOC defined the Critical, Essential, and Enhancing levels. The relative differences in percentage points between the levels reflect what the verbiage defining the levels suggests should be reasonable differences between the levels, when we use the new weights.
uniformity of responses of some USASOC units. Since the new scale is based on past mission data, not on subjective responses, the distribution of the responses will change. The responses should show a better central tendency when tied to the mission data. Data for how often each Joint Capability Area has been used on past missions is available to USASOC, but is not releasable for this investigation due to classification issues. However, if the responses are still skewed toward the Critical response when tied to mission data, the problem will at least be mitigated. All commands will be responding according to the same guidelines and scale, so no command will garner an advantage by over-estimating the impact of capabilities, Tasks, or Elements of Cost. In addition, the scale which we suggest (90% = Critical, 40% = Essential, 5% = Enhancing) could be modified to produce a more centralized response distribution once the trends in the mission data for capability utilization are clear.
If USASOC implements the changes we will recommend based on the above results, they will make the system more stable, and less sensitive to the least reliable factors in the system: the user-subjective weights. This decreased sensitivity in the system can be measured using condition number analysis of the A matrix we derived from the system. Changing and Requirements and Capabilities Analysis system so that the A matrix we derived would be more stable, with a lower condition number, would benefit the system by making it less sensitive to these least reliable inputs. We have already identified that there are problems with the way units responded to the surveys for weights. They responded using different scales, so that some rated almost all capabilities for all core missions as Critical, while others responded with most capabilities being Essential, and a more central
VIII. CONCLUSIONS & RECOMMENDATIONS
The results of our analysis indicate that there are two issues with the Requirements and Capabilities Analysis system that should be resolved. First, the impact weights assigned to each impact level are arbitrary, and do not match the meaning of the levels as defined by USASOC as well as they could. Second, the distribution of impact levels varies greatly between subordinate USASOC commands, with some units responding according to a very right-skewed distribution. These commands responded that almost all Joint Capability Areas for every unit-echelon was Critical. When the capabilities and Elements of Cost used by these units are evaluated by the Requirements and Capabilities Analysis system alongside those of commands who responded with a more central distribution, the right-skewed units’ capabilities and Elements of Cost will be rated higher than they should be. The units need to assess their capabilities and Elements of Cost using the same criteria, and be evaluated on the same scale. In addition, when these units’ responses are assessed alone, the impact levels
will not contribute to their ranking because the levels are almost all identical.
It is important to note that the condition number analysis performed on the Logic Replicator cannot be performed directly on the Requirements and Capabilities Analysis system. We constructed the Logic Replicator with the requisite number of Elements of Cost to yield a square matrix when the A matrix was built. This allowed us to find the norm and condition number of A. The Requirements and Capabilities Analysis system’s data is not
sensitivity of the prioritized list of Elements of Cost created by the system in the same manner done here, by making small changes to the weights and measuring the resulting changes in the output.
We have a primary recommendation that would rectify both of the issues with the system. It would correct the arbitrary nature of the impact weights assigned to each level, and ensure a better distribution of impact levels while guaranteeing that all units assess their Joint Capability Areas using the same criteria. The impact levels for all commands would therefore be determined according to the same scale, removing the bias that is currently possible in the system. This recommendation requires a more systemic change and more work for USASOC to implement than some other options would, however, so we will
include other alternatives as well below. The recommendations below are alternatives, given in the order by which we would recommend them. The first solution is the most elegant, but would require more work than the others.
Recommendation 1):
In order to rectify the issues with the current system, our primary recommendation is to adopt a new system of determining the weights for the Joint Capability Areas for each USASOC unit-echelon and core mission type. The weight for each would be:
So if 90% of Special Forces Battalion missions required the capability Maneuver to Engage, the weight would be 9. This solution would distribute the responses much better, allowing the Requirements and Capabilities Analysis system to use Joint Capability Area weights to differentiate between capabilities and Elements of Cost better. We cannot state exactly to what degree the implementation of this solution would improve the distribution of responses because the data for how frequently each Joint Capability Area is utilized on missions, while available to USASOC, is not available for the purposes of this study due to classification issues. However, the number of Joint Capability Area responses would increase dramatically from 3 to a number determined by rounding. If the weights are rounded to the nearest 10%, then the possible weights would be the integers 1 through 10. As we remarked when transitioning the weights to a 0-1 scale, there is no reason the weights must be integers, so there could be any number of possible responses, determined by the rounding of the capability percentages of utilization on missions. This great increase in the number of different values included in the database would lead to a much more stable system and an A
can be viewed in Appendix D, in the Condition Number Experimental2 Tab. Something similar to this would result from making the weights a continuous-style scale, where each weight is based on the utilization of the Joint Capability Area for each unit-echelon.
Implementing this solution would also ensure that all responses from all units are on precisely the same scale, evaluated to the same criteria. This would eliminate the issue of bias toward capabilities of units whose responses were overwhelmingly Critical. It would also ensure that all units’ weight levels effect the outcome of the system’s analysis, since it would eliminate the ability of units to rank too many of their Joint Capability Areas with the same response (i.e. Critical).
Recommendation 2).
If it would be too disruptive to implement Recommendation 1), the second is a good alternative. We would recommend that USASOC keep the three impact levels of Critical, Essential, and Enhancing, but assess each Joint Capability Area in a manner similar to in Recommendation 1). First determine the frequency with which each capability is utilized by each unit-echelon, then apply the percentages to determine if the response should be Critical, Essential, or Enhancing. The percentages should match the recommended weights we determined earlier:
Enhancing (weight = 0.5): unit-echelon uses the capability on 5% or higher of missions.
Unfortunately, the data for what each response would be is not available for this study due to classification issues, although it is available to USASOC for implementation. Without this data, it is impossible to verify that implementing this solution would reform the response distributions appropriately. It would at least, however, ensure that all commands are
assessing the Joint Capability Areas using the same criteria, so it should eliminate the
differences in response distributions between commands. It is possible that it would result in all units having too many responses at the same level, but there should no longer be
Recommendation 3):
If it is found to be too onerous to make the impact levels dependent on the frequency of the Joint Capability Areas being used on missions, the first two recommendations will not serve. If this should be the case, we still must address the two issues with the response data. If we can’t tie the responses to mission data, we recommend directly adjusting it. The
weights that we recommended earlier [9, 4, 0.5] are still superior to the current weights because they better match the intent on the impact levels. The distances between the new level weights would much better reflect the differences that can be derived from USASOC’s
definitions of the levels. Using the new levels then, we still have to address the distribution of the responses.
If the responses cannot be tied to mission data, USASOC must force its subordinate commands to respond with more central and wider distributions. The results of our condition number analysis indicate that enforcing an upper limit of 40% on the number of responses at any one level for a unit would greatly improve the system. The results would be less
sensitive to subjective inputs, the responses would have the intended impact on ranking the Elements of Cost and Joint Capability Areas, and all units would be forced to respond on the same scale. There are numerous ways of enacting this requirement, including the most direct: simply requiring that no more than 40% of responses for each unit are at any level.
Another option is to assign points to each response, increasing with the increasing impact level. Each unit would than have a limited number of points to allocate on all
IX. AREAS FOR FURTHER STUDY
While we have examined the method for determining Joint Capability Area weights, and made recommendations to improve it, this study did not examine in detail the correct valuation of weights for Tasks or Elements of Cost. These two weights are important in determining the final relative weights for Elements of Cost, but are difficult to examine in this forum at this time for a few reasons. First, both USASOC and SOCOM are still trying to implement their systems, and do not have data available for what level of importance
(Critical, Essential, or Enhancing) each task and Element of Cost will have. There are
thousands of Elements of Cost, and data on what values they will be assigned may be slow to emerge. In addition, while the Joint Capability Area information is unclassified, the Tasks and Elements of Cost in some instances are classified, and not usable in this academic environment. For USASOC’s purposes, however, they should better examine the implementation of these weights. We are advising USASOC that they apply the
recommendations we listed above, as whichever is implemented for Joint Capability Areas would serve well for Tasks and Elements of Cost. The definitions for Critical, Essential, and Enhancing are the same for all three elements, so the new weights we recommend would improve the system for all elements. In addition, the importance of the distribution of responses holds for all three elements, and should be corrected via our recommendations if they are right-skewed or biased between commands.
Another area for further study is the tool that SOCOM is using to determine the cost of each Element of Cost. The prices come from the Special Operations Research,
the different Elements of Cost, whether they are training, materiel, etc., and the methods and assumptions SORDAC uses could affect the solutions found by SOCOM’s optimizer. A