NUNTASUNTI, SUCHART. The Effects of Visual-Based Information Logistics in Construction. (Under the direction of Leonhard E. Bernold.)
by
SUCHART NUNTASUNTI
A dissertation submitted to the Graduate Faculty of North Carolina State University
in partial fulfillment of the requirements for the Degree of
Doctor of Philosophy
Civil Engineering
Raleigh 2003
APPROVED BY:
BIOGRAPHY
ACKNOWLEDGEMENTS
This research is sponsored by the National Science Foundation (NSF) under Grant No. CMS 0080073.
I would like to express gratitude and appreciation to my advisor, Dr. Leonhard E. Bernold, for his guidance, encouragement and mentoring. To my committee members: Dr. William J. Rasdorf, Dr. Robert E. Young, and Dr. Duncan M. Holthausen, I extend my appreciation for their valuable input into my research. Permissions from Spectrum Home Inc. and R.N. Rouse & Co., Inc. to collect invaluable data are gratefully acknowledged. Thanks to Mr. Allen from NC State Information Technology/Computing Services for his guidance in setting up wireless network. To Chanchai, Lijuan and all my friends in the Construction Automation and Robotics Laboratory (CARL), I thank you for your help and support.
TABLE OF CONTENTS
Page
LIST OF TABLES ………..………….……… viii
LIST OF FIGURES ……… ix
1. INTRODUCTION ……….…...…. 1
1.1.Performance Review of the Construction Industry ………. 1
1.2.Low Performance Caused by Asynchronous Information ………….. 3
1.3.Problem Statement and Need ………..… 6
1.4.Research Objectives ……… 8
1.5.Organization of the Thesis ……….……. 9
2. LITERATURE REVIEW ……….…………. 10
2.1.Construction Process Review ………..….. 10
2.1.1. Resources as Process inputs ……… 11
2.1.2. Recognition of Information as a Resource ……….. 13
2.1.3. Activity Planning versus Process Planning ………. 14
2.2.Communication in Construction Project ………..……. 16
2.3.Information Logistics ……….………… 19
2.4.Waste Concepts Based-on Lean Thinking ……….…….….. 23
2.5.1. MRP II, ERP, and CERP ……….…… 27
2.5.2. Network, the Internet and TCP/IP Protocols ………….………. 31
2.5.3. Wi-Fi ………..……. 35
2.6.IT Implementation in Construction ……….….…. 37
2.7.Summary of Problems and Issues ………..…… 39
3. INTEGRATED WIRELESS SITE (IWS) ………..…. 41
3.1.Information Logistics for Construction ………..….. 41
3.2.Integrated Wireless Site (IWS) ………...….. 45
3.3.Conceptual Framework and Uses ………. 48
3.4.IWS as a Tool for Adding Team’s Value ……….……….…... 52
3.4.1. Extended Construction Waste Concepts Based on Lean Thinking ………. 53
3.4.2. Creating New Value ………..…. 58
3.5.Collaborative and Share: A Win-Win Situation ……….….. 60
4. DEVELOPMENT OF VISUAL-BASED IWS SYSTEM (V-IWS) ………. 64
4.1.Effectiveness of Visualization ……… 64
4.2.Sources of Visual Based Information ………...…. 65
4.2.1. Public Database and Outsourcing ………..…. 65
4.2.2. Still Digital Photo and Video Clip ………..… 68
4.2.3. Disadvantages of Using Video and Digital Still Camera ….….. 73
4.3.V-IWS System Design ……….. 73
4.3.1. System Components ……….. 74
5. SYSTEM IMPLEMENTATION ……….…… 80
5.1.USTL Project Overview ………..…. 80
5.2.System Installation ………...… 81
5.3.The Effects of Construction Site Environment on the System ….…… 85
5.3.1. Field Signal Measurement ……….…… 86
5.3.2. Wireless Field Intensity ……….…… 89
5.4.Interference According to Location of the Devices ………. 97
6. ON-SITE DATA COLLECTION AND ANALYSIS ……….…. 99
6.1.Effects of the V-IWS on Information Flow ……….….… 100
6.1.1. Observation of CFSC Team Meetings ………... 101
6.1.2. Analysis of Information Flow Based on Minutes ………... 102
6.1.3. Effects of the V-IWS on Face-to-Face Onsite Meeting ……….. 106
6.2.Effects of the V-IWS on Material Delivery Process ……….. 109
6.2.1. Background of the Greenhouse Activities at USTL Project …… 110
6.2.2. Data Collection ………..…. 111
6.2.3. Process Analysis ……….…… 112
6.2.4. Effects of V-IWS on Process Improvement ………..……. 114
6.3.Effects of the V-IWS on CFSC team’s satisfactions ……….. 117
6.3.1. Data Collection ……… 117
6.3.2. General Characteristics of the Respondents ……… 118
6.3.3. System Value Rating ………..……… 118
6.4.Costs-Benefit Analysis of the V-IWS ………..…. 121
6.4.2. System Benefits ………. 123
6.4.3. Cost Benefit Comparisons ………. 126
7. CONCLUSION AND FUTURE WORK ………. 130
7.1. Summary ………. 130
7.2. Conclusion ……….. 132
7.3. Recommendation for Future Research ……….………….. 140
LIST OF REFERENCES ……….………..….. 142
APPENDIX A FCC Regulation on Wireless Communication ………... 151
APPENDIX B NCSU Policy on Wireless Communication ………... 159
APPENDIX C Sample of ASP Code ………. 164
APPENDIX D Sample of Signal Strength and Quality Data ………. 170
APPENDIX E Information Flow Analysis Form ……….. 173
LIST OF TABLES
Page
Table 1.1 Foremen’s main source of delay ……….…… 4
Table 2.1 Approved 802.11x standards ………..…… 35
Table 2.2 WLAN costs/benefits study ……… 36
Table 6.1 Information code description ………...….….. 102
LIST OF FIGURES
Page
Figure 2.1 Transformation concept of production ……… 11
Figure 2.2 Input/output process model ……….……… 12
Figure 2.3 Materials and associated information flow in construction project ………..……….…. 14
Figure 2.4 Information flow diagram ……….. 17
Figure 2.5 Communication flow in a construction alliance ……… 18
Figure 2.6 Physical logistics network ………. 20
Figure 2.7 Logistics life cycle ……… 22
Figure 2.8 Conceptual CERP architecture ………. 29
Figure 2.9 IP address classes ………. 33
Figure 2.10 # 1 investment priorities for corporate executives, project managers and information technologists ……….. 38
Figure 3.1 ILC flow model ………..……….. 42
Figure 3.2 Information flow in horizontal and vertical directions …………. 44
Figure 3.3 Information flow structure of IWS ………..…………. 46
Figure 3.4 Extended functional breakdown of construction ……….. 47
Figure 3.5 Conceptual diagram of IWS ………. 49
Figure 3.6 The video camera used in RBPR system ………. 51
Figure 3.7 Physical waste ……….. 54
Figure 3.8 Non value-added activities ………... 55
Figure 3.9 Components of waste in construction ……….. 56
Figure 3.10 Cause-and-effect of non value-added activity and physical waste ……… 57
Figure 3.11 Visual as-built for the home owner ……….. 59
Figure 3.13 3 X 4 value payoff matrix ……….. 62
Figure 4.1 Available visual information of Knightdale construction site ….. 67
Figure 4.2 Balloon testing ………... 68
Figure 4.3 Visual as-built for lot 19 ……….... 69
Figure 4.4 Videotaping used in process improvement study ……….. 70
Figure 4.5 Components of the V-IWS ………. 76
Figure 5.1 V-IWS installations ……… 82
Figure 5.2 Samples of picture from the network cameras ………... 84
Figure 5.3 Floor plan of the USTL building ………... 87
Figure 5.4 Measurement of signal strength and link quality inside the building ……….. 88
Figure 5.5 (a) Signal strength from RP-1 ………..…….. 90
Figure 5.5 (b) Link quality from RP-1 ………. 91
Figure 5.6 Field intensity from RP-1 ………...… 92
Figure 5.7 (a) Signal strength from RP-2 ………...…. 94
Figure 5.7 (b) Link quality from RP-2 ………...……. 95
Figure 5.8 Field intensity from RP-2 ………..…… 96
Figure 5.9 Network camera on the roof of Garner Hall building ……… 97
Figure 6.1 Percent of information transferred in the USTL’s meetings ……. 104
Figure 6.2 Online message board ……… 108
Figure 6.3 The greenhouse material delivery ………. 111
Figure 6.4 Timeline of the greenhouse material delivery …………..………. 113
Figure 6.5 Collateral waste caused by the truck waiting outside ……….…... 114
Figure 6.6 Online material planning tool ……… 116
Figure 6.7 Value rating based on system’s features ……… 119
1. INTRODUCTION
1.1 Performance Review of the Construction Industry
The construction industry is one of the largest non-farm sectors in the U.S. economy. According to U.S. Census Bureau, in 1997 the construction industry performs more than $845 billion of work or almost 11% of GDP and employs more than 5.6 million employees. Due to its size, the performance of construction industry is important for the growth of the entire U.S. economy. However, statistics show that the industry has been suffered from low performance for more than three decades. This low performance includes low productivity, high accident rates, late completion, and poor quality. Since 1964, the labor productivity of construction industry has been stagnated compared to that of average all non-farm industries (Teicholz, 2000). In addition, according to Occupational Safety & Health Administration, construction industry had 1,121 fatal injuries in 2002, the highest number of any major industry (OSHA, 2003).
contractor for developing open communication and only by including the subcontractors in communications and decision processes that a higher level of trust can be achieved. The concrete subcontractor needs to know if there is any change in dimension or elevation of the concrete slab before he prepares the formwork and rebar. The architect may think that he can make a change and not affect the subcontractor because the slab has not been cast. However, making such a change causes the subcontractor to rework formwork and rebar. Typically, a construction project needs one entity to act as a leader to conduct and coordinate other entities to work smoothly together. This entity can be the owner, the architect, or the general contractor depends on the phase of the construction project. During the design phase the leader may be the architect while during construction phase the general contractor is usually the one who coordinate the team. Regardless of who is the leader, having the right information to the right person at the right time is proven to be vital to the project’s success.
phenomenon also prevents “cross-functional issues” being solved at lower level and causes problems to escalate to the top of the silo (Castka, 2002). In construction industry, silo culture does not exist only within organization but also among different organization such as general contractors, designers and subcontractors. A recent research project revealed that subcontractors often complain about the quality of information received from general contractors such as missing, late and inaccurate design drawings (Dainty, Briscoe and Millett, 2001). It is seen that the silo culture has created a barrier for critical information to flow smoothly among project participants.
1.2 Low Performance Caused by Asynchronous Information
The lack of effective communication is also a major obstacle to project success. The Construction Industry Institute (CII) conducted a survey research to identify the critical communications variables that effected project’s success. The survey included 35 owner and contractor firms and 3 government agencies. A total of 582 returned questionnaires revealed that 41% of the variation in perceptions of project success could be attributed to variation in communication effectiveness (Thomas, Tucker, and Kelly, 1998). This indicates a direct relationship between communication effectiveness and project success. The survey strongly suggested that improved project communications would lead to higher project performances.
Table 1.1 Foremen’s main source of delay (Source: Elliot 2000)
Source of Delay Cited Percent of Foremen Citing
Unanswered Questions 42.6
Other Trades 37.7
Incomplete or Conflicting Plans/Specifications 31.0
Scheduling, Coordination, and Communication 28.7
Changes to the Work 27.8
Material Delays 25.4
Weather 14.4 Manpower 10.5
result of the survey is shown in Table 1.1. Incomplete or conflicting plans/specifications and scheduling, coordination and communication were also cited as source of delay by majority of the foremen. In addition, the research also showed that foremen were partially excluded from the flow of information within the communication process. The research suggested that the process could be improved by increasing foremen’s involvement and enabling foremen to access the information they needed in order to coordinate the work.
In late 1996, a large mechanical contractor worked on a pilot project which employed approximately 50 plumbers, pipe-fitters, and sheet metal workers. The study measured the PPC (Percent Plan Complete: number of completed assignments divided by the total number of assignments) of weekly work plans during the week of 10/7/96 through the week of 1/20/97. Of the 249 incomplete assignments, the top 3 reasons why they were not completed on time were as follow: 1) 71 cases were because of late or defective materials, 2) 42 cases were because of the prerequisite work was not completed, and 3) 37 cases were because of changes in priorities (Ballard, 1997). It appears that all these 3 reasons relate to lack of coordination between suppliers and other trade involved in the processes.
major source of delay, cause a great deal of waste and severely affect project performances.
1.3 Problem Statement and Need
The U.S. Economic Census 1997 showed that there were more than 6 hundred thousand establishments in construction business performed work such as general contractor, subcontractor, designer, etc. not included material suppliers (U.S. Census Bureau, 2002). The majority of these establishments were small and medium business. For instance, according to “Structure of the Residential Construction Industry” by Gopal Ahluwalia and Jo Chapman, the 1997 Census of Construction showed that 73,500 residential home builders built less than 25 homes but accounted for 39% of all the homes built. These builders had an average of only 4 employees on the payroll. Builders who built less than 100 units accounted for another 21% and had an average of 8 employees on the payroll (NAHB Research Center, 2001).
other. This organization can be called “cross-functional supply chain” (CFSC) team. London and Kenley (2001) pointed out that due to the temporary nature of this organization, any managerial concepts applied to a project in construction environment was problematic.
The call for modern management concepts in construction is not new. In the late 1970s, a business roundtable task force found that there was deficiencies in almost all aspects of the construction, ranging from planning and design through the site operation. Its reports were widely distributed. One of the reports addressed the issue of modern management method awareness as quote: (Oglesby, Parker and Howell, 1989).
“The construction industry has been criticized, to a large extent justifiably, for its slow acceptance and use of modern management methods to plan and execute projects. Many people both inside and outside the industry view this as a primary cause of serious delays in schedules and large cost overruns that have plagued the industry in recent years. Yet there is no lack of modern cost-effective management systems that can provide project managers with all the controls they need.”
1.4 Research Objectives
The goal of this research is to investigate the effectiveness of visual-based information logistics model on construction process’ performances. The more specific research objectives include:
1) Study and evaluate key communication channels used today in construction as well as the state-of-the-art technologies that could underpin a synchronous information logistics model.
2) Analyze the information flow between the main team members of a mid-size building construction project.
3) Develop and test a prototype web-based communication system to support real-time and interactive information sharing among all project participants, both technical and non-technical.
1.5 Organization of the Thesis
2. LITERATURE REVIEW
This chapter discusses the fundamental concept of construction process as well as the flow of information. Information is recognized as one of the process input. The lean thinking and information logistics are investigated in order to provide fundamental concepts for waste reduction. State-of-the-art technologies in communication and networking are described as the fundamental means to enable information logistics model in jobsite environment.
2.1 Construction Process Review
generation concept.” He also noted that all three concepts were necessary and should be utilized simultaneously. Based on his research, all three concepts of production can also be applied into construction (Koskela, 2000).
2.1.1 Resources as Process Inputs
According to Kosekela (2000), construction process was seen as a transformation of a set of resources or input into a modified form or output. The transformation process, then, could be decomposed into sub-processes, which also be considered a transformation processes.
Figure 2.1 Transformation concept of production (Based on Koskela, 2000)
The concept of transformation is shown in figure 2.1. A process of building a residential home, for example, composes of foundation, framing, roofing, and etc. The foundation sub-process is decomposed into excavation, reinforcing, forming, concrete
Process A
(Transformation Process)
Sub-Process A1 (Transformation Process)
Sub-Process A2 (Transformation Process) A set of resources
such as material, labor, etc. (Input)
casting, and so on. Each transformation process and sub-process in construction is affects by outside conditions; some can be controlled, but some is considered uncontrollable.
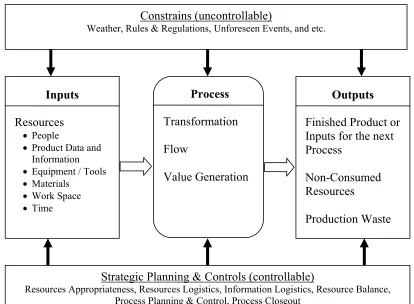
Figure 2.2 Input/output process model (Based on Salim, 1993)
Salim (1993) has proposed the Input/Output process model as shown in figure 2.2. The model is composed of five parts: inputs, process, outputs, uncontrollable conditions, and controllable factors. Many different types of resources are required as “ingredients” in order to start and sustain a construction process. The performance of processes and
Constrains (uncontrollable)
Weather, Rules & Regulations, Unforeseen Events, and etc.
Strategic Planning & Controls (controllable)
Resources Appropriateness, Resources Logistics, Information Logistics, Resource Balance, Process Planning & Control, Process Closeout
Inputs
Resources • People
• Product Data and Information
• Equipment / Tools
• Materials
• Work Space
• Time
Process
Transformation Flow
Value Generation
Outputs
Finished Product or Inputs for the next Process
Non-Consumed Resources
quality of the outputs depend largely on the state of the inputs. Labors, materials, equipments, drawings, specifications, instructions, and utilities are examples of resources that need to be at the “point of consumption” at the right time and with the right quality.
2.1.2 Recognition of Information as a Resource
According to input/output process model shown in figure 2.2, information is recognized as one of process inputs. Information, as defined by Merriam-Webster Dictionary, is knowledge obtained from investigation, study, or instruction. It is different from data in the way that data have to be processed into a meaningful form before it can be turned into information (Senn, 1990). In construction, specification, instruction, as well as schedule are all considered vital information. Furthermore, each resource including material, labor or equipment all has pieces of information associated with them. Materials, for instance, have their quality, quantity, handling instruction, delivery date, and loading area assigned to them.
information, somehow, need to be flowed to him at an appropriate time so he can manage to have the material flown to the process at the right place and the right time.
Figure 2.3 Materials and associated information flow in construction project
2.1.3 Activity Planning versus Process Planning
The objectives of planning are to complete a prescribed amount of work within the required time limit, within the budgeted cost, and to the specified standard of quality (Zhang, 2001). Construction planning can be done in both activity level and process level. According to Zhang, the term “activity” in construction is any portion of a project,
Site
Office
Suppliers (Point of Origin,
Expediting
Delivery Activity
Bill of Materials (BOM)
Purchasing
Information
Physical Flow
Storage
Use
Final Stage (Part of product,
Reuse or Disposal) Delivery to Point of Consumption (POC)
which consumes time or resources and has a definable beginning and ending. The activity, then, can be broken down into process, work task, and motion/move. For instance, basement activity can be broken down to reinforced steel process, formwork process, placing concrete process, and etc. The reinforced steel process composes of several tasks such as cut, bend, and place. Most of construction project has been planned and scheduled at activity level, i.e. foundation, first floor beam, column, second floor beam, etc. Each activity, then, will be assigned tentative duration, relationship, resources, etc. Managers use activity planning to prepare a network model, scheduling, and resource allocation. This approach, however, does not focus on process of how to complete the activity but concentrate on the completion of the activity. In other words, activity planning concentrates largely on targets. In target-based planning, managers set the targets that are time, budget, quality, etc. and try to ensure that those targets are met. The management may not make any adjustment to improve performance as long as the work progresses according to the plan and within allowable mistakes. In addition, target-based planning cannot monitor and control waste or spot problems during the process as long as the activity meet the targets i.e. finished on time, within the budget, and pass the inspection. The quality defects usually are spotted after the activity finished in which discards or reworks are unavoidable.
the problem before it occurs. Compared to activity planning, process planning is not used widely in the construction industry (Zhang, 2001). Most of the time, planning of a process has been done by superintendent at the job site on week-to-week or, sometimes, day-to-day basis. However, in the dynamic environment of construction site, researches have shown that the development of process-based planning has the significant impact on productivity and performance of the project. Activity planning cannot be accurately detailed so far into the future because of the lack of information about actual durations and deliveries (Ballard, 1997). On the other hand, process planning ensures that the crew working on the job will be able to work with all the resources available.
2.2 Communication in Construction Project
ways to communicate with each other requires every body to be available at the same time and it is both timely and costly. Besides, the information communicated by face-to-face meeting is delayed, sometimes weeks or months.
Figure 2.4 Information flow diagram (Based on Oglesby, Parker and Howell, 1989) Owner’s Representative
(PM, A/E)
Contractor’s Management Team
Crew Supervisor (foreman)
Crew at work face (including foreman)
Formal feedback for cost, pr
ogress, method studies, etc.
Informal feedback on accomp
lishments, problems, etc.
Formal information flow (usually written) Formal information flow may occur
Traditionally, information in a construction project can be flown in two directions: 1) between superior and subordinate, and 2) among CFSC team. The information that flow between superior and subordinate is called “vertical flow.” Figure 2.4 shows an example of information flow diagrammed in construction project based on Oglesby, Parker and Howell (1989). Downward flows involve such item as plans, instructions, orders, and etc. both formal (usually written) and informal (usually verbal). Upward flows show feedback of problems, progress, data collection, and etc. It is important to note that communications of any kind involved a very complex process can be strongly influenced and possibly biased by those who generate and transmit information. From the diagram, information flown from contractor to crew at work face is considered to be in vertical direction while the flow between owner’s representative and contractor can be seen as either vertical or horizontal direction.
Figure 2.5 Communication flow in a construction alliance (Cheng et. al., 2001) Company A
Company C Company D
Although the information flow diagram based on Oglesby shows how information flows from the owner to the contractor and down to the crew at the work face. It does not show how information flows among the CFSC team. Cheng et al. (2001) studied the communication network within multiple parties involved in construction project. The communication flow based on Cheng is shown in figure 2.5. This model suggests that each party in the CFSC team has the right to communicate with all other parties. The relationship between each member is typically contractual and the flow of information among member is considered horizontal.
2.3 Information Logistics
and finished products that flow between the facilities as shown in figure 2.6 (Bramel and Simchi-Levi, 1997). Due to the fact that physical logistics deals with moving “physical” things from point-of-origin to point-of-consumption, therefore the attributes of things (e.g. weight, volume, shape, etc.) and distance between nodes of transportation are the major concerns in design and manage the logistics system. The great economic constraints involved in physical logistics are time and cost. The revolution in physical logistics began with the emerging of railroad, motor vehicles, and aviation. However, increasing in physical logistics efficiency needs to accompany with efficiency flow of related information.
Figure 2.6 Physical logistics network (Based on Bramel and Simchi-Levi, 1997) Manufacturing Plants
and Suppliers
Distribution Centers
Warehouse
Information logistics deals with the non-physical components of logistics defined by CLM. It has become more and more important in military operation. According to the article “Survey Defence Technology” published by The Economist in 1995, during the Gulf war the allies suffered from various types of information shortage. Three-quarters of the American vehicles destroyed or damaged were hit by their own side. Mellyn and Groeve (2000) defined the information logistics revolution as “the ability to exchange and process ever-increasing volumes of information between economic actors at ever-decreasing cost to achieve just-in-time procurement manufacturing and distribution.” They also suggested that optimizing physical logistics was impossible beyond a certain point before better information logistics were applied to the problem. In fact, business was increasingly building linkages between their own internal information system, typically ERP systems, and those of their suppliers and customers. In construction, Soibelman and Caldas (2000) defined information logistics for construction design team collaboration as “the maintenance, tracking, monitor and enactment of information flows within design organizational process. The aim was to support inter-organizational information system in order to assure that the accurate and relevant information would be on the right place at the appropriate time and with the required quality.”
among companies is the organization, planning, and realization of the total flow of goods, data, and control along the entire life cycle of products. The life cycle begins with environment and consists of three phrases: design and manufacturing, use, and disposal, then it returned to environment as shown in figure 2.7.
Figure 2.7 Logistics life cycle (Based on Schonsleben, 2000)
The study in logistics, which was once understood as storing and transportation of goods, is changed to focus on an integral perspective on company coordinated business process. Storing and transportation are still necessary but now these processes are seen as disturbing factors or “waste” that should be reduced as much as possible (Schonsleben, 2000). In addition, logistics of goods or physical resources alone is no longer sufficient. Information logistics is an imperative part of integral logistics for the company in order to remain competitive.
Environm
ent
Disposal
Design and Manufacturing
2.4 Waste Concepts Based-on Lean Thinking
There are several terms that closely relate to the term “lean thinking.” Just-in-Time (JIT), Toyota Production System (TPS), Kanban System, and Pull System are all related and, sometime, confuse with lean thinking. Even though the term “lean” was coined by the research team working on international auto production, the idea was developed by Toyota’s engineer, Taiichi Ohno (Howell, 1999). Mr. Ohno began to develop a system so-called “Toyota Production System” after Japan lost in the World War II. The most important objective of the system was to increase production efficiency by consistently and thoroughly eliminating waste (Ohno, 1988). The TPS has become a huge success and the system has been adopted by other companies worldwide. However the system is based on trial-and-error process and the company’s culture; therefore make it difficult for outside people to understand. This was emphasized by the foreword of Monden’s Toyota Production System book by Mr. Ohno himself (Monden, 1998).
of Toyota, it has a strong feature of emphasizing practical effects, and actual practice and implementation over theoretical analysis. As a result, it was our observation that even in Japan it was difficult for the people of outside companies to understand our system; still less was it possible for the foreign people to understand it. …”
…Taiicho Ohno Former Vice President, Toyota Motor Corporation
Based on the concept of Toyota Production System and JIT philosophy, the term “lean thinking” was established. The word “lean” was used because it provided a way to do more with less that mean used less resources to create more customer’s value. There are two words that critical in the concept of lean: “waste” and “value.” Ohno defied waste or “muda” in Japanese word as all elements of production that only increase cost without adding value. Production waste can be divided into 7 categories as follow (Ohno, 1988): 1) Over production, 2) Waiting, 3) Transportation, 4) Too much machining (over processing), 5) Inventory, 6) Moving and 7) Making defective parts and products. Ohno categorized his muda based on physical production environment. Womack and Jones (1996) suggested that there may be more muda and they have added the design of goods and services which do not meet users’ needs as the eighth muda. Value, on the other hand, is hard to define. Womack and Jones stated that value could only be defined by the ultimate customer and it was meaningful when expressed in term of a specific product (a good or a service) which met the customer’s needs at a specific price at a specific time
rater than just physical output. Anything that does not add value and satisfy customer is considered waste. Excess inventory, unnecessary transportation, too many meetings, or even bidding process can be considered wasteful and should be eliminated. Meetings, for instance, involve costs beyond the costs of travel and loss productivity. Unnecessary meetings consume most of the managers’ time and cause a lot of stress. According to the MCI conferencing paper (1998) “Meetings in America,” 37 percent of employee time is spent in meetings. Busy professionals attend over 60 meetings each month. The study also reveals that the majority of attendees are concerned about other work responsibilities that pile up at their office and feel stressful to travel, especially when they have to stay away from family.
however, the builder bonus is considered an incentive that encourages superintendents to finish the project on time.
2.5 Information Technologies
As mention earlier in section 1.3, the construction industry is fragmented and it is difficult to apply managerial concepts such as supply chain, logistics, and lean thinking without the use of technology. This section reviews information technologies that can be used to improve information flow in construction project.
2.5.1 MRP II, ERP, and CERP
1981, there are approximately 8,000 manufacturing companies in the United State that are using some form of MRP.
ERP (Enterprise Resource Planning) shares the same fundamentals with MRP II but is broader in scope to include financial, supply chain, and supporting business units across company boundaries (Wallace and Kremzar, 2001). While MRP II focuses on manufacturing production, ERP enhances management of all business operation across the enterprise. In a simple term, ERP is a computer program that provides a general working platform for all departments of an enterprise with their management functions being integrated into the program (Shi and Halpin, 2003). The world’s largest ERP providers include SAP, Oracle, and People Soft, while the most popular system installed worldwide is SAP R/3 (Jacobs and Whybark, 2000). Many researchers in the area of ERP believe that ERP is the driving technology of BPR or business process re-engineering (Al-Mashari, 2003). Traditional ERP is intended to be used within organizations. According to Mellyn and Groeve (2000), however, many businesses today are trying to link their ERP system and share information with their customer and suppliers along the supply chain as well.
is stored in the central database and is available to all eligible users in the system (Shi and Halpin, 2003). Sharing the same database eliminates the need of regenerating or reentering the same information which helps maintain data consistency, and reduces human errors. ERP supports one time entry of information where it is created, then the information is save into the database and available to all participants. According to the study by ML Payton Consultants, the ERP market could reach $52 billion by 2002. The implementation of the ERP system normally takes 1-2 years in average (Ahmed and et al., 2003). Despite its huge market, ERP systems still have several disadvantages. The systems are expensive and difficult to implement. According to a survey of 15 implementations, the systems were costs from $2 million to $130 million (Ross, 1999). Nevertheless, several implementation failures are reported. Statistics show that the majority of ERP implementations could not be completed in scheduled duration and within budget (Shi and Halpin, 2003).
Figure 2.8 Conceptual CERP architecture (Shi and Halpin, 2002)
Central Database & Applications User
Interfaces
Intelligent management server Schedule
tasks
System security
Conflict resolving
System administration
Traditional ERP systems such as SAP are not primarily developed for construction (Shi and Halpin, 2003). Shi and Halpin (2003) suggest the Conceptual Construction Enterprise Resource Planning (CERP) based on three-tiered client/server architecture as shown in figure 2.8. The primary function of the first tier is to interface with the various users across a construction enterprise such as purchasing and operations. The second tier is the management server which provides system administration and acts as a bridge between the users and the central database and applications. The third tier is comprised of the applications and the central database which contains cost data, project data, equipment data, and etc. The applications are organized into corporate-level, project-level, and back-office applications.
generation of ERP will have to incorporate the Internet in its applications such as web-based procurement system.
2.5.2 Network, the Internet and TCP/IP Protocols
Due to the critical role of computer network as a means to transfer information and communication, during 1960s, the Department of Defense along with researcher at universities and large technology companies like Xerox formed a working group called Advanced Research Projects Agency (ARPA). The objective of this team was to develop a way of passing data among widely separated nodes in case the country was attacked by nuclear weapons. The outcome of this team was ARPANET (Patil et al., 2003). At the beginning, ARPANET was limited to government, universities, and some research organizations. Until 1989, ARPANET was opened to public and became the Internet (Duntemann, 2003).
separated depends on what class it belongs to. Figure 2.11 shows how an IP address is separated (Duntemann, 2003).
Figure 2.9 IP Address classes (Duntemann, 2003)
IPv4 categorizes IP addresses into 3 classes. IP addresses will be assigned according to the size of possible hosts. In addition, some certain ranges of IP are reserved as “local IP addresses” for example 192.168.0.0 to 192.168.255.255 in Class C. The local IP addresses are non-routable that means they are known only within a LAN. There are three regional Internet registries responsible for the assignment of IP addresses: ARIN (American Registry for Internet Numbers) responsible for North America, South America, the Caribbean, and sub-Saharan Africa; APNIC (Asia Pacific Network Information Centre) responsible for Asia Pacific region; and RIPE (Reseaux IP Europeens) responsible for Europe and beyond (Patil et al., 2003).
1-126 0-255 0-255 0-255
128-191 0-255 0-255 0-255
192-223 0-255 0-255 0-255
Class A
Class B
Class C
126 Possible Networks 16,777,214 Possible Hosts (2 are reserved)
16,384 Possible Networks 65,534 Possible Hosts (2 are reserved)
IPv4 can supply more than 4 billion IP addresses. In the past, most of the IP addresses were allocated to American universities and organizations. For example, Stanford University was given more than 17 million addresses, while India, which had more than 1 billion in population, had 2 million addresses (Erlanger, 2003). With today advancement in technology, not only computer servers or hosts that require addresses but also many kinds of device such as PDAs, cell phones, automobiles, and home appliances need IP addresses in order to connect to the Internet. Experts estimate that sometime within the next decade, IPv4 will run out of the addresses. Today researchers are working on the next generation of Internet Protocol called IPv6. Since IPv6 is 128 bits, it will increase the supply of IP addresses from 4 billion to over 35 trillion (Erlanger, 2003).
2.5.3 Wi-Fi
Wi-Fi (Wireless Fidelity) is a radio-based networks technology that connects computers or wireless devices compatible with Institute of Electrical and Electronic Engineers (IEEE) 802.11x standards. There are four 802.11x standards have been approved by IEEE as shown in Table 2.1 (http://www.wlana.org). Other standards such as 802.11e, 802.11f, 802.11h and 802.11i are still in development. The current status of the standards can be found at the website of The Institute of Electrical and Electronics Engineers, Inc., (http://www.ieee.org) and The Wireless LAN Association (http://www.wlana.org).
Table 2.1 Approved 802.11x standards (http://www.wlana.org)
Standard Description Approved
IEEE 802.11 Standard for WLAN operations at data rate up to 2 Mbps in the 2.4-GHz ISM (Industrial, Scientific and Medical) band.
July 1997
IEEE 802.11a Standard for WLAN operations at data rate up to 54 Mbps in the 5-GHz Unlicensed National Information Infrastructure (UNII) band.
September 1999.
IEEE 802.11b Standard for WLAN operations at data rate up to
11 Mbps in the 2.4-GHz ISM band. September 1999.
IEEE 802.11g High-rate extension to 802.11b allowing for data
rates up to 54 Mbps in the 2.4-GHz ISM band. June 2003.
2003). Wireless LAN Association (WLANA) conducted a survey on wireless LAN return on investment. 34 organizations in 5 industries were interviewed regarding costs and benefits of wireless LAN (WLAN) implementation. The results of the survey are summarized in Table 2.2. The payback period is the period of time required for the cumulative cash flows due to increased productivity, organizational efficiency and extra revenue/profit gain to equal the initial investment. The survey also shows that organizations implementing an average of 300 client cards gained annual savings of up to $4.9 million (Armenta, 2001).
Table 2.2 WLAN costs/benefits study (Armenta, 2001)
Retail Manufacturing Healthcare Office Automation Education
Benefits per company (millions $) 5.6 2.2 .94 2.5 .5
Costs per company (millions $) 4.2 1.3 .90 1.3 .3
Payback (# of months) 9.7 7.2 11.4 6.3 7.1
jets are scheduled to be equipped with Wi-Fi networks. Nearly 4,000 planes are planned to have the service in the next 10 years (Green et al., 2003).
2.6 IT Implementation in Construction
0 5 10 15 20 25 30 35 40 45 3D Da ta Wa re ho us e E n gi ne e rin g Ap p lic at io n We b Da ta M a na ge m e nt Ot h e r CE PM IT
Figure 2.10 # 1 investment priorities for corporate executives, project managers and information technologists (CII’s survey, 1998)
In addition to increasing organizations’ performance, global competition also causes pressure on construction industry to help owners reduce the total cost of ownership (TCO) of facilities. In today’s environment, it is clear that people and technologies are equally important to help the industry achieve its goal. O’Conner and Rasdorf (1998) proposed five steps for both owners and the industry to encourage the use of technologies to reduce TCO and add value to engineering services as follow: 1) Owner should insist on deliverables that include facility data in a form they can use as part of an “as-built.” 2) Construction should start to provide good as-built data to the customer as inexpensive as possible. 3) Designers should pay close attention to the new generation of object-orient CAD systems that have open software architecture and insist
% of respon
d a
s #1 investme
n
on compatibility. 4) Software and hardware vendors should promote interoperability of their product through standards and protocols. 5) All parties should equip their offices with the highest bandwidth internet access affordable and start transition to web-based project pages with document and data available to authorized personal over the web.
2.7 Summary of Problems and Issues
There are evidences that the construction industry’s performance has fallen behind other industry (described in section 1.1). Low productivity, high accident rate, delays, and poor quality are major problems in the industry. Many researches and studies point out that inefficiency in communication and information logistics are major causes of the problems (as discussed in section 1.2). Despite its size, the industry is so fragmented. In addition, the relationship of the participants in a construction project is usually temporary. These characteristics make implementation of any managerial concepts and/or complex system into a construction project extremely difficult (details in section 1.3).
3. INTEGRATED WIRELESS SITE (IWS)
As mention in chapter 1, the inefficiency of traditional communication approach which relies heavily on telephone, letter, and on-site meeting is proven to be a major source of delay and waste in construction. In chapter 2, various concepts of construction process, logistics, and information technologies have been investigated to find a better way to improve efficiency of communication system. Understanding of these concepts serves as solid fundamentals to develop the new way to share information among CFSC team. This chapter proposes the framework of Integrated Wireless Site (IWS) which is a wireless system based on Wi-Fi technology that cover the entire job site and link various devices and equipments together. The system is purposed as an information logistics model in order to reduce waste and add value.
3.1 Information Logistics for Construction
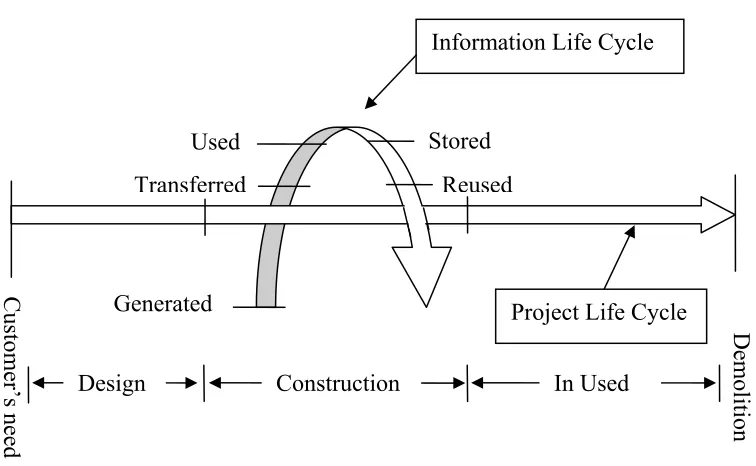
project begins when there is a need for a new facility. Then the process evolves from concept design to detail design, construction and deliver to the customer. Based on extended logistics concept, however, the life cycle of the project has been extended to include service life of the facility (used) and demolition process when the facility is no longer needed.
Figure 3.1 ILC flow model
At the same time when the project life cycle starts, the related information logistics begins. The customer’s need is identified and delivered to the design team. The designers use the information created by the customer (in this case, the owner of the facility) as a resource to create construction drawings. In addition to the owner’s need, the designers also need “expertise” and, other sources of information such as state
Customer’s need
Demolition
Generated Project Life Cycle
Information Life Cycle
Transferred
Used Stored
Reused
regulations, design standard and information from past projects. The designers use these information and other resources to create output (e.g. design drawing) which by itself is considered information that needs to be passed to the contractor. The idea of ILC is to design and implement a system that controls the flow of information, in order to ensure that the right person (or machine) has the right information at the right time. This can happen in two different ways. First, if the person knows what information he needs and when he needs it, the system should be implemented in a way that he knows where to find it and how to get it. The system, then, must allow him to “pull” such information whenever he wants. The second is considered as “push” method. When the information is created, either the person who creates the information or the system must be able to identify who should receive the message and when they should get it. The system then pushes the message or alerts the recipients.
Figure 3.2 Information flow in horizontal and vertical directions.
(Two-head arrows represent the information can flow back and forth and the method is either push or pull).
Typically, the information flow must be either horizontal or vertical. The owner and designers usually do not call the contractor’s accounting personnel directly without acknowledgment of the contractor’s project superintendent. Similarly, if the contractor’s purchasing wants to know about work quantity change due to change order, he will need to get that information from the company’s representative who is a CFSC member. This flow structure, while considered necessary, has caused delay in the flow and inconsistency of the information.
Superior
Company D’s Representative
Subordinate Company B’s
Representative
Company A’s Representative
Company C’s Representative
3.2 Integrated Wireless Site (IWS)
Same as rail road and aviation revolved physical logistics, the Internet and emerging technology like Wi-Fi have revolved the aspect of information logistics. To overcome the limitation of traditional flow discussed earlier, the concept of Integrated Wireless Site System (IWS) is presented. The objective of IWS is to provide instant access of authorized information to authorized entities. The authorized entities can be either a person and/or equipment. Due to the fact that not all CFSC members are full-time onsite, the system needs to be easily accessed from any remote locations. The Internet is a perfect way to provide such ability.
However, ability to send information to the system from person outside the team should be limited and carefully defined due to security and accuracy of information.
Figure 3.3 Information flow structure of IWS
In term of planning and control, IWS provides an opportunity to integrate planning and control functions at different level. Figure 3.4 shows function breakdown of typical construction organization. Part of this model is based on a general breakdown structure presented by Bernold et al. (1990). The planning and control functions at each
Superior
Company D’s Representative
Subordinate Company B’s
Representative
Company A’s Representative
Company C’s Representative
IWS CFSC Team
level, which are used to be separate functions, can be more integrated and/or synchronized. The managers at higher level can use lower level information such as site condition and equipment status which are accessible in real-time to effectively plan and control. The information that normally available at one level now can be effectively shared with different level both intra-organization and inter-organization.
Figure 3.4 Extended functional breakdown of construction Level General Breakdown Structure
Repetitive-ness Integrated Planning & Control
Organization Project Activity Process Work Task Motion/Move Unique Unique Semi-unique Semi-repetitive Repetitive Repetitive Business Strategy, Competitive Advantage Process Planning & Control Partnering, Supply Chain & Logistics Management Scheduling, Target Planning & Control Task Planning & Control Motion Planning & Control Formwork Reinforced steel Placing concrete
Cut Bend
Company
Project A Project B
First-floor Base-ment Found-ation Found-ation
Place Screed
Grab Put Push
3.3. Conceptual Framework and Uses
Figure 3.5 The conceptual diagram of IWS
Since equipment, material and labor are key resources on a building site, tracking their whereabouts is essential. The RFID (Radio Frequency IDentification) tag technology has successfully been used in the retail and service industries. For example, Wal-Mart and FedEx have implemented RFID tags to improve their supply-chain and logistics management. By integrated RFID technology into the system, the IWS will be
Project Manager
Sub-Superintendent
Crane Rental
able to track and identify materials, equipment, tools, and other resources automatically and immediately after they passed the gate.
The IWS can also be used as a site monitoring system. The system includes digital imaging devices such as digital cameras and video cameras that upload real-time images and video clips to the central hub. With the IWS, project participants can monitor the construction progress from another city or anywhere in the world. The images, then, is kept as a project history. Typically a camera is located so that its field of view covers some point of interest. This could also help to resolve claims and dispute. For large project built in downtown area, the uninterrupted supply of some material such as ready-mix concrete is vital. Video cameras can also be used to control the supply of ready-ready-mix concrete by provide real-time images of work face and concrete plant. The plant manager can control the quantity of concrete to be delivered according to the work face situation. In addition, video camera can be used to control material staging area to make sure that the suppliers have put materials at the right place and the same camera can serve as a security device prevent material from get stolen.
Figure 3.6 The video camera used in RBPR system (Moon, 1997)
3.4 IWS as a Tool for Adding Team’s Value
Webster dictionary (1994) provides more than ten definitions for the word “value.” For instance, 1) “a fair or proper equivalent in money, commodities, etc., esp. for something sold or exchanged; fair price or return” 2) “the worth of a thing in money or goods at a certain time; market price” or 3) “estimated or appraised worth or price; valuation.” A fundamental problem in a general theory of value is to define value so as to include all its forms. Value is specific to individuals. It depends on a person’s relative needs for security, pleasure, peer approval, aspirations, etc. (Hicks, 1994). Adam Smith, a Scottish philosopher and economist, described the meaning of the word “value” in his famous book “The Wealth of Nation” as follow (Smart, 1931):
“The word ‘Value’, it is to be observed, has two different meanings, and sometimes express the utility of some particular object, and sometimes the power of purchasing other goods which the possession of that object conveys. The one may be called ‘value in use’; the other, ‘value in exchange.’ The things, which have the greatest value in use, have frequently little or no value in exchange; and on the contrary, those, which have the greatest value in exchange, have frequently little or no value in use. ‘Nothing is more useful than water: but it will purchase scarce any thing; scarce any thing can be had in exchange for it. A diamond, on the contrary, has scare any value in use; but a very great quantity of other goods may frequently be had in exchange for it.”
“customer’s value” usually defined as performance’s satisfaction at the lowest possible cost. From these definitions, it is clear that the word value has more meaning than just monetary value. For this research, value is defined as anything that increase people’s satisfaction. This includes usefulness and self-esteem. Value is specific to individual and the willingness to acquire that value is determined by its cost.
Working in an inter-organization environment like the one in CFSC team requires new perspective of goals. Clearly, each team member is a firm’s representative and must work to make sure that his/her firm get the most value as possible. However, maximizing one firm’s value does not mean that the overall value is maximized. Research has shown that, through collaboration, an increasing in overall value can be achieved and only by sharing the gain value so each firm can get more benefit (more details is presented in section 3.5). The IWS is designed to increase overall value by encouraging collaboration among team member. The way IWS adds value to the team is to minimizing waste in the system and creating new value for the team member.
3.4.1 Extended Construction Waste Concepts Based on Lean Thinking
Some of physical waste might not have any value left (Fig. 3.7 a.) but have to be eliminated in order to complete the process.
(a) Debris (b) Unused rebar
Figure 3.7 Physical waste
Design of goods and services which do not meet users’ needs. Although these “lean thinking wastes” are identified based on manufacturing process, most of them, if not all, can also be applied into any business process including construction. Lean thinking waste focus on the activity that only consumes resource but does not added any value. These non value-added activities occur at every stage of the process. In figure 3.8 (a), the cement bags need to be moved around the site because they are not put at the right place when delivered. This unnecessary transportation does not add any value to the process or anyone; therefore, it should be eliminated as much as possible. This type of waste is usually overlooked by the manager because it is non-physical and intangible.
(a) Transportation waste (b) Waste from correction
Figure 3.8 Non value-added activities
poured, the supervisor did not get the update drawing. Therefore, the slab was poured at the wrong level and need to be reworked. The rework process usually consumes more time and resource than the original task itself. It does not add any value and also create physical waste.
Figure 3.9 Components of waste in construction
Still have some value (shorted rebar, etc.) No Value (debris, trash from cutting, packaging, etc.)
Still necessary based on current
practices Can be removed
immediately
Still have some value (shorted rebar, etc.) No Value (debris, trash from cutting, packaging, etc.)
Can be removed immediately
One waste can causes another waste
Production Wastes in Construction Project
Non Value-added Processes Physical Waste
Still necessary based on current
Both physical waste and non value-added activity can be categorized into two types: one that can be eliminated immediately without any negative effects and another that still necessary (but can be reduced) based on current practice and culture. For instance, the on-site meeting activity does not add value to the finished product but still needed in order to coordinate and maintain relationship between project participants. The components of waste in construction site is summarized and shown in figure 3.9.
(a) Over production (b) Improperly store
Figure 3.10 Cause-and-effect of non value-added activity and physical waste
management needs to think about what to do with that physical waste. It may be discarded or it may be sold. Either way, it needs to be transported out of the site. All of these are considered more non value-added activity created by the physical waste that was created by previous non value-added activity. Similarly, improper storage of material on site as shown in figure 3.10 (b) causes the material exposed to water. The damaged materials need to be separated from good ones and properly disposed. These activities are considered non value-added.
3.4.2 Creating New Value
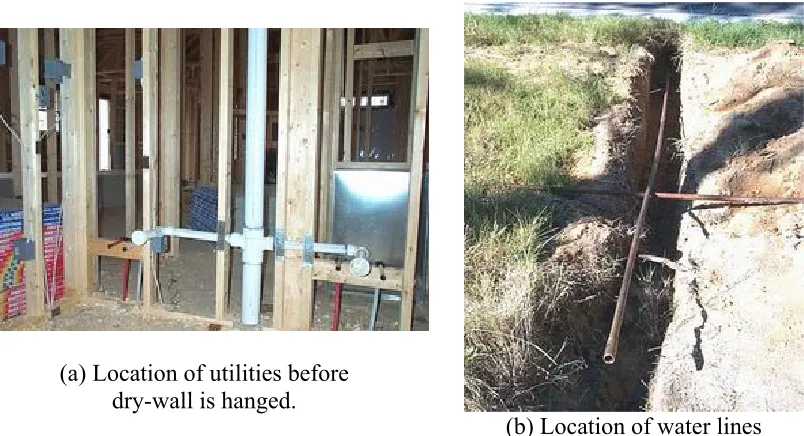
used to identify problems that may occur after the process has completed. It can also be used as a training tool for inexperienced workers to learn from past projects.
As shown in Fig. 3.11 (a) and (b), spatial data about the exact location of a new water pipe can be collected from a laser positioning system. Alternatively, digital pictures allow the new homeowner to see through the walls. If the inspection of the electrical and pluming system would include taking a series of digital pictures, an extremely useful information bank could be established. Another example of useful visual as-built is the pictorial marking of buried utilities such as water, sewer, cables, and gas. Any homeowner who has changed the landscape around his/her house could benefit from the availability of such information.
(a) Location of utilities before dry-wall is hanged.
The goal of IWS is to add value by both reducing waste in construction process and creating new value for the CFSC team member. To reach this goal, the acquisition procedures and information flows need to be integrated and synchronized. In addition, every entity involved in the process must realize the important of the problems and willing to share information in order to achieve the group objective which is increasing overall value for the team. However, value is specific to individual and all team members are different. Implementing the system may benefit one member more than another. At the same time, the system may cost each member differently. The next section discusses the important of collaborative and sharing of gain value approach to make the implementation possible.
3.5 Collaborative and Share: A Win-Win Situation
properly, ineffective time spent on re-handling and searching can be eliminated. The result of the study showed that placement-oriented delivery and staging improved crew level productivity in the placement of rebar by 30% compared to the traditional method. Key to the productivity gain in laying the bars, however, was a supplier who was willing to collaborate with the subcontractor in shipping the steel in a way that matched how the crew was progressing. One incentive that convinces the supplier to cooperate in lean delivery is to have share in the saving that the subcontractor can make. Figure 3.12 summarizes possible alternatives of the subcontractor and the supplier in payoff matrix form. If the supplier agrees to participate in lean delivery, it will cost him $5 for spend more time rearranging the rebar. If he chooses not to participate, it will cost him nothing
Share $10 Not Share Do Extra-work 7 5 17 -5 Not Participate -10 10 0 0
Figure 3.12 2 X 2 Value payoff matrix
The subcontractor, on the other hand, will gain $17 if implementing lean delivery by increasing his productivity. In order to convince the supplier, the subcontractor may agree to pay more or “share the value” with the supplier. Assume the subcontractor is willing to pay $10 more for the supplier’s extra-work. This will compensate the cost of
Subcontractor
supplier and left him $5 for profit. If the supplier, however, tried to make maximum profit from the agreement by reducing his cost which may decrease the quality of service and, therefore, reduce value to the subcontractor. In long term, the subcontractor will realize and move back to his old strategy by terminating the agreement. This will bring both the supplier and subcontractor to the “equilibrium” showed as shading area in the figure. In theory of game, if the players are in equilibrium this means there is no other way to make more profit except cooperate to each other. In this case, if the supplier and subcontractor are trying to maximize their profit, the best they can do is to remain in the traditional way and gain nothing. On the other hand, if they can have agreement and establish trust between each other, the subcontractor and supplier can make $7 and $5 respectively.
Share $10 Share $5 Not Share
Promise New Contract 100% Extra-work 7 5 12 0 17 -5 17 15
50% Extra-work -2 8 3 3 8 -2 8 18 Not Participate -10 10 -5 5 0 0 0 20
Figure 3.13 3 X 4 Value payoff matrix
Subcontractor
In real world, the situation will become much more complicated especially when other factors besides direct cost such as, who dominated the supply chain (who has power), company image, long-term relationship etc. also have to be taken into consideration. Both subcontractor and supplier may have more than two alternatives. Figure 3.13 shows an example of 3X4 value payoff matrix that the supplier has three alternatives and the subcontractor has four. However, the same concept of value sharing can still be applied.
4. DEVELOPMENT OF VISUAL-BASED IWS SYSTEM (V-IWS)
In chapter 3, the framework of IWS was presented. The IWS model was proposed as an alternative to the traditional asynchronous information logistics in construction. As indicated, the goal of IWS is to share real-time information among authorized users anywhere at anytime. In order to prove this concept, a prototype system was developed. This chapter presents the development of Visual-based IWS (V-IWS) as well as rules and regulations that have to be followed.
4.1 Effectiveness of Visualization
projects (Ormerod, M. and Aouad, G., 1997). In addition, visualization also increases productivity. A recent study showed that more media-rich communication channel, especially the one that supports visualization, would lead to higher group productivity (Attia, 2002). Visualization is also a promising tool in engineering education. A research team in the United Kingdom has studied the use of digital imagery and visualization materials to help students in the civil and building engineering curriculum improve their understanding. The initial evaluation found that students showed improvement in various areas such as increased students’ participation and motivation, decreased time required to complete exercises and improved retention of information by students (Bouchlaghem et al., 2000).
4.2 Sources of Visual-based Information
A preliminary study to investigate various sources of visual information has been conducted at Knightdale residential project in Raleigh, North Carolina. Spectrum Home Inc. is the general contractor. The project (Phase 1) comprised of 7 residential homes.
4.2.1 Public Database and Outsourcing
information. Many public sources such as libraries and government websites provide GIS data to citizens and businesses for free or for a small fee. GIS data of the Knightdale construction site was found at Wake County’s website which maintained GIS data for the entire county (http://www.wakegov.com/county/propertyandmapping/gis.htm). The GIS database provides data such as Tax/Parcel maps, Topographic maps, 1999-Digital Orthophotographs, Soils and City of Raleigh Planimetrics. Some data, for example, Tax/Parcel files are updated monthly while some may have not been updated for more than a year old. The website provides data in both downloadable files and online viewing version. The downloadable file contains files in various file formats such as DXF, MrSid, and SHP. The user must have appropriated software to view the files. Examples of downloadable data are shown in figure 4.1 (a) and (b). The users start with the county map and then go down to specific area with the list of available files to download. The online version called iMaps is shown in figure 4.1 (c). The users can go to specific area and view the image directly from their browser such as Netscape and Microsoft Internet Explorer.
(a) Clickable county map (b) Downloadable file
(c) iMaps online
4.2.2 Still Digital Photo and Video Clip
In order to get an update aerial view of the Knightdale construction site, a digital camera has been attached to a balloon as shown in figure 4.2 (a). The camera is control by a remote control to take pictures. The balloon is let go of at about 80 feet and more than 50 pictures have been taken. The picture, then, are sorted and overlaid by using a photo editor software. The result is shown in figure 4.2 (b). Even though more than 50 pictures were taken, only few pictures can be used. The balloon is hard to control because of high wind at the high attitude even though it seem to be calm on the ground. In addition, not seeing through the view finder make it’s difficult to get good composition.
(a) Field testing
(b) Pictures overlaid using computer