ABSTRACT
JINES, MICHAEL PHILLIP. Enhancing Genetic Gain in Maize with Tropical Germplasm, QTL Mapping, and Spatial Methodologies. (Under the direction of Major M. Goodman.)
Advance-cycle breeding is restricting the germplasm base for U.S. maize (Zea Mays
L.). Many breeding programs devote efforts to adapt diverse germplasm to U.S. growing conditions, but few are participating in continual enhancement. Incorporating tropical germplasm into U.S. breeding pools could broaden the maize germplasm base, while concomitantly providing favorable alleles for yield and disease resistance. Knowing the genomic regions, or quantitative trait loci (QTL), for disease resistance can enhance gain by permitting selection on marker genotypes in the absence of disease expression. In addition, accounting for spatial variability can improve the precision of experiments and aid breeders in line advancement decisions and QTL mapping.
Recombinant inbred (RI) lines were derived from a cross between NC300, a
temperate-adapted, all-tropical line, and B104, a Stiff-Stalk-synthetic line. The RI lines were topcrossed to the tester FR615.FR697 (a C103 sister line cross). Resistance QTL for
Southern Rust (rust) (Puccinia polysora) were mapped in the topcrosses, while Gray Leaf Spot (GLS) (Cercospora zeae-maydis) resistance QTL were mapped in both the RI lines and topcross populations. A major resistance gene for rust was identified on the short-arm of chromosome 10, while ten GLS QTL mapped to chromosomes 1, 2, 3, 4, 8, and 10. Similar markers on chromosomes 1 and 8 flanked three GLS and flowering time QTL pairs, and the resistance alleles were associated with increased flowering time. No flowering time regions co-localized with rust-resistance loci. The major rust-resistance gene and three GLS QTL corresponded to regions mapped in prior populations. The tropical parental allele, NC300, increased resistance at three of these four loci. Extensively haplotyping germplasm at these four consensus regions could aid in forward breeding strategies to efficiently integrate resistance gene combinations into U.S. maize breeding populations.
analytical techniques. The program constructs and optimizes several spatial models for each trait and single-environment-trial combination, and chooses a preferred model based on a specified criterion. Results from the preferred model are outputted into SAS data sets.
A long term breeding effort was initiated in 1975 to adapt and subsequently enhance tropical germplasm. Founder germplasm included seven double-cross-tropical hybrids. Based on the poor per se performance of the first and second-cycle lines, at least five cycles of S1
recurrent selection (RS) for grain yield has been practiced on two populations derived from these lines. Cycles per se and cycle-topcrosses to LH132.LH51 were grown in separate yield trials to estimate responses to selection. In both instances, grain yield increased linearly across the cycles of selection for each population, but the yield responses across the cycle-topcrosses are approximately half the average annual gains of commercial breeding activities in the U.S. Corn Belt. To determine the current range in combining ability, ninety-six S1
families were sampled from the latest cycles of each population and topcrossed to LH132.LH51. Three topcross families did not differ significantly in yield from the commercial check hybrid average. Variance components estimated from the topcross
families suggest that S1 topcross RS is more promising in maintaining relevancy, and appears
ENHANCING GENETIC GAIN IN MAIZE WITH TROPICAL GERMPLASM, QTL MAPPING, AND SPATIAL METHODOLOGIES.
by
MICHAEL PHILLIP JINES
A dissertation submitted to the Graduate Faculty of North Carolina State University
in partial fulfillment of the requirements for the degree of
Doctor of Philosophy
CROP SCIENCE
Raleigh, NC 2007
APPROVED BY:
Dr. Major M. Goodman Dr. James B. Holland
Chair of Advisory Committee
DEDICATION
BIOGRAPHY
Michael Phillip Jines was born in Bargersville, Indiana, the second child of Michael and Karen Jines. During the summer between his freshman and sophomore year in high school, he was introduced to corn breeding through a summer job at Holden’s Foundation Seed. Prior to working at Holden’s Foundation Seed, Michael was interested in civil
ACKNOWLEDGEMENTS
I would first like to thank my parents, Michael and Karen Jines, who taught me to care for other people and to work hard. I would like to also thank my sister, Michelle Hall, for supporting me for the decisions I have made throughout my life. I owe sincere gratitude to my Grandpa, Lowell G. Moore, for teaching me the values of humility, taking me morel mushroom hunting, and defining the meaning of “Hoosier”. I sincerely thank my committee members, Drs. Cavell Brownie, James Holland, Paul Murphy, and Major Goodman for their support. I extend my thanks to Dr. James Holland for inspiring me to acquire more
TABLE OF CONTENTS
Page
LIST OF TABLES... viii
LIST OF FIGURES ... xi
CHAPTER I – Literature Review ...1
Gain estimation ...1
General Methods to Enhance Gain ...4
Thesis Background...6
QTL Mapping ...7
Spatial Analyses...9
Recurrent Selection...10
References ...13
CHAPTER II – Mapping Resistance to Southern Rust in a Tropical by Temperate Maize Recombinant Inbred Topcross Population...28
Abstract ...29
Introduction...30
Material and Methods ...33
Genotyping and Linkage Map Construction...34
Statistical Analysis of Phenotypic Data...34
Results ...37
Discussion ...38
Acknowledgements...41
References...42
CHAPTER III – Dissection of Quantitative Trait Loci Associated with Gray Leaf Spot Resistance and Maturity in Maize: Both Inbreds and Topcrosses ...52
Abstract ...53
Abbreviations...54
Introduction...54
Material and Methods ...57
Genotyping and Linkage Map Construction...59
Statistical Analysis of Phenotypic Data...59
Results ...61
Discussion ...64
Acknowledgements...68
References...69
CHAPTER IV – SPATIALPRO: A SAS Program for Automating Spatial Analyses ...82
Abstract ...83
Introduction...84
General Features of SPATIALPRO...85
Model Selection ...85
Output ...90
Example ...91
Conclusions...93
References...95
CHAPTER V – Evaluation of S1 Recurrent Selection for Grain Yield Practiced on Two All-Tropical Populations of Maize ...112
Key Words ...113
Abstract ...113
Introduction...114
Material and Methods ...117
Plant Material...117
Cycle and Cycle-Topcross Studies ...118
Entry Mean Separation ...120
Regression analyses (Cycle per se and Cycle-topcross experiments...121
Variance Component Estimation (S1 topcross family experiments) ...121
Results ...123
Discussion ...126
Acknowledgements...129
References...131
APPENDICES ...152
A I. Gray Leaf Spot (GLS) ratings and days to fifty-percent-pollen shed (DTP) entry means for 143 NC300/B104 recombinant inbred (RI ) lines and topcrosses (TC) to FR615xFR697, which were evaluated in separate experiments...153
A II. Estimates of chromosome (Chrom) positions (Pos), left and right flanking markers and their corresponding positions, additive effects of the NC300 allele, percent of explained phenotypic variation (R2), and the percent of explained genotypic variation (G%) for Days to fifty-percent-pollen shed quantitative trait loci (QTL) detected by multiple interval mapping using recombinant inbred (RI) line and topcross mean flowering dates over environments...158
A IV. Summary of chromosome numbers, positions, and markers effects estimated from the across (Main effect) and within environmental analyses for markers fitted in a multiple-marker-by-environment ANOVA of Gray Leaf Spot pertaining to the recombinant inbred
(RI) line and topcross experiments. ...160 A V. Information pertaining toS1 recombination, development, and
evaluation for cycles from the TROPHYCOMP (TCOMP) and TROPHYELITE (TELITE) populations that were available upon
designing experiments. ...163 A VI. Resource differences between S1 RS A) and S1 topcross
LIST OF TABLES
Page CHAPTER I
Table 1. Common recurrent selection (RS) methods and their
corresponding additive genetic variance coefficients (coeff) and cycle
time in seasons and years (y) ...18 Table 2. The Phases of one cycle of S1 topcross (TC) recurrent selection………….... ...19
Table 3. The Phases of one cycle of full-sib (FS) topcross (TC) recurrent selection ...20 CHAPTER II
Table 1. The five most resistant and five most susceptible NC300/B104RI topcrosses to FR615xFR697, and the average resistance ratings of the commercial checks (Check mean), parental topcrosses (Parental Topcross mean), and RI topcrosses (RI Topcross mean) to Southern Rust (Rust) combined across four environments in 2003 ...46 Table 2. The combined ANOVA across four environments (Env) for Southern Rust
rating in 2003 of a population of 143 NC300/B104 maize recombinant inbred lines topcrossed with FR615xFR697, using a replication
nested-within-sets design ...47 Table 3. Spearman rank correlation coefficients among all pair-wise combinations of
within-environment, set-adjusted, least square Southern Rust resistance entry means from a population of 143 NC300/B104 maize recombinant inbred lines topcrossed with FR615xFR697 and scored in four environments in 2003...48 Table 4. Estimates of chromosome (Chrom) positions, left and right flanking markers
and their corresponding positions, additive effects of the NC300 allele, percent of explained phenotypic variation (R2), and the percent of explained genotypic variation (G%) for Southern Rust quantitative trait loci detected by multiple interval mapping using combined mean disease scores over four environments in 2003 ...49 Table 5. Summary of the multiple-marker-by-environment (env) ANOVA for Southern
Rust resistance measured on topcrosses of 143 NC300/B104 maize recombinant inbred lines with FR615xFR697...50 CHAPTER III
Table 1. Gray leaf spot (GLS) ratings and days to fifty-percent-pollen shed (DTP) entry means combined across environments for the five most resistant and five most susceptible NC300/B104 recombinant inbred (RI ) lines and topcrosses (TC) to FR615xFR697, evaluated in separate experiments...74 Table 2. The combined ANOVAs across environments (Env) for Gray Leaf Spot
ratings of A) 143 NC300/B104 maize recombinant inbred (RI) lines and B) their topcrosses with FR615.FR697, using a replication nested-within-sets
Table 3. Spearman rank correlation coefficients among all pair-wise combinations of within-environment, least square Gray Leaf Spot rating entry means from A) a population of 143 NC300/B104 maize recombinant inbred (RI) lines and B)
their topcrosses with FR615.FR697...76 Table 4. Gray Leaf Spot (GLS) and days to fifty-percent pollen shed (DTP) entry-mean heritabilities (h2) and genetic correlations between the two, estimated from the
recombinant inbred (RI) lines and topcrosses...77 Table 5. Estimates of chromosome positions (Pos), left and right flanking markers,
their corresponding positions and bin numbers, additive effects of the NC300 allele, percent of explained phenotypic variation (R2), and the percent of explained genotypic variation (G%) for Gray Leaf Spot quantitative trait loci (QTL) detected by multiple interval mapping using recombinant inbred (RI)
line and topcross mean disease ratings over environments ...78 Table 6. Estimates of chromosome positions, left and right flanking markers, their
corresponding positions and bin numbers, additive effects of the NC300 allele, percent of explained phenotypic variation (R2), and the percent of explained genotypic variation (G%) for for Days to fifty-percent-pollen shed quantitative trait loci (QTL) that co-localized with Gray leaf spot QTL and that were detected by multiple interval mapping using recombinant inbred (RI) line and topcross mean flowering dates over environments ...79 Table 7. Summary of chromosome positions for markers fitted in a multiple-marker-by-
environment (env) ANOVA of Gray leaf spot measured on 143 NC300/B104 maize recombinant inbred (RI) lines...80 CHAPTER IV
Table 1. Example specifications for various conventional models via global macro variables defined by %LET statements and their corresponding resolution in PROC
MIXED in SPATIALPRO. ...97 Table 2. User-defined global macro variables in SPATIALPRO and their
definitions ...99 Table 3. Examples of program code for PROC MIXED and the specification of
parameters with global macro variables corresponding to PROC MIXED
statements for conventional and spatial models...102 Table 4. Spearman Rank Correlation (Corr) coefficients (Coeff) between entry means from
the alternative and conventional analyses for yield (YLD), moisture (MOI), and erecet plant (EPL) SAS data sets at the Clayton, Lewiston, and
Plymouth environments (env)... 104 Table 5. Type 3 fixed effects for the entry main effect and polynomial terms (if appropriate)
for SAS data sets from the preferred models for yield (YLD), moisture (MOI), and percent erect plants (EPL) at the Clayton, Lewiston, and Plymouth environments (env). ...105 Table 6. Entry means file SAS data set from the preferred models (Analysis<trait>) for
yield (YLD), moisture (MOI), and percent erect plants (EPL) at Clayton,
SPATIALPRO and from the lattice analyses for yield, moisture,
and erect plants. ...107 CHAPTER V
Table 1. Parental tropical hybrids and their racial/varietal backgrounds...135 Table 2. Inbred lines that were intercrossed to form the TROPHYELITE synthetic. ...136 Table 3. The phases of one cycle of S1 recurrent selection...137
Table 4. Sums of Squares for yield (YLD), percent moisture (MOI), percent erect plants (EPL), ear height (EHT), and plant height (PHT) and days to
fifty-percent silk (SD) and pollen-shed (TD) averaged across environments
for A) cycles per se and B) cycle-topcrossess. ...138 Table 5. Cycle per se means across five environments (Clayton, Jackson Springs,
Lewiston, Kinston, and Plymouth, NC) for yield (YLD), percent moisture (MOI), percent erect plants (EP), ear height (EHT), plant height (PHT), and days to fifty-percent pollen shed (TD) and silking (SD) for the TROPHY composite (TCOMP) and elite (TELITE) populations and
commercial checks...139 Table 6. Cycle-topcross means across nine environments in 2005 and 2006 for yield
(YLD), percent moisture (MOI), percent erect plants (EP), ear height (EHT), plant height (PHT), and days to fifty-percent pollen shed (TD) and silking (SD) for the TROPHY composite (TCOMP) and elite (TELITE)
populations and commercial checks. ...140 Table 7. Set-adjusted entry means across eight environments for the better yielding
S1 topcross families to LH132.LH51 from the A) TROPHYCOMP C8
and B) TROPHYELITE C5 populations. ...141 Table 8. REML estimates, based on 13 environments, of the S1-topcross-family-
within-set (σT2) and the S1-topcross-family-by-environment- within-set
(σTE2) variance components for yield (YLD), percent moisture (MOI),
percent erect plants (EPL), ear height (EHT), plant height (PHT), and days to fifty-percent pollen-shed (TD) and silking (SD) for the TROPHYELITE
C5 (ELITE) and TROPHYCOMP C8 (COMP) populations...143 Table 9. Entry-mean heritabilities estimated from the S1 topcross families from the
TROPHYELITE C5 and TROPHYCOMP C8 populations for yield (YLD),
percent moisture (MOI), percent erect plants (EPL), ear (EHT) and plant
(PHT) height, and days to fifty-percent pollen-shed (TD) and silking (SD). ...144 Table 10.Estimates of direct responses to S1 topcross RS for yield (YLD), percent
moisture (MOI), percent erect plants (EPL), ear (EHT) and plant (PHT) height, and days to fifty-percent pollen-shed (TD) and silking (SD) ; and indirect responses to S1 topcross RS when directly selecting on grain yield
for the TROPHYELITE C5 (Elite) and TROPHYCOMP C8 (Comp)
populations...145 Table 11. Genotypic correlations between grain yield (YLD) and percent moisture
(MOI), percent erect plants (EPL), ear (EHT) and plant (PHT) height, and days to fifty-percent pollen-shed (TD) and silking (SD) for the
LIST OF FIGURES
Page CHAPTER I
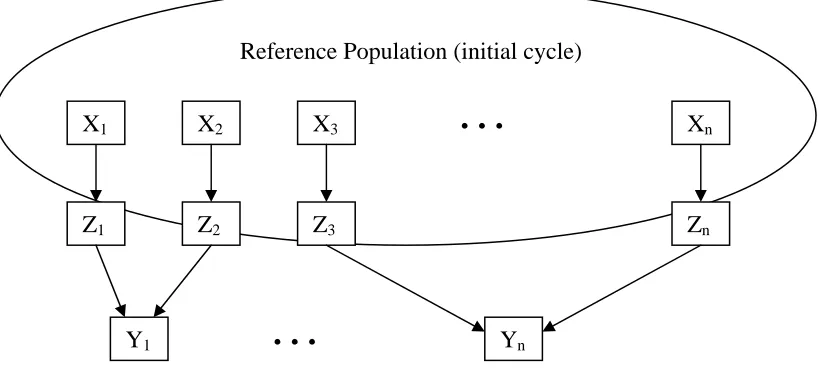
Figure 1. Illustration of selection units (Xi), recombination units (Zi), and response
units (Yi) for a generalized selection methodology. Units appear in squares
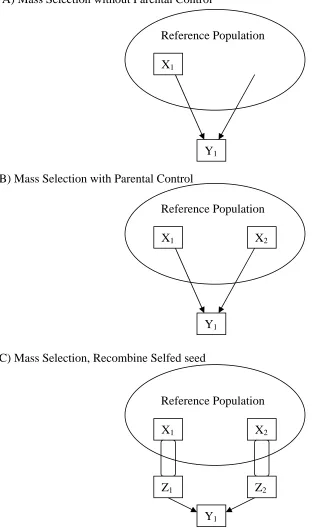
and arrows signify patterns of descent...21 Figure 2. Illustrations of selection units (Xi), recombination units (Zi), and response
units (Yi) for A) mass selection without parental control, B) mass selection
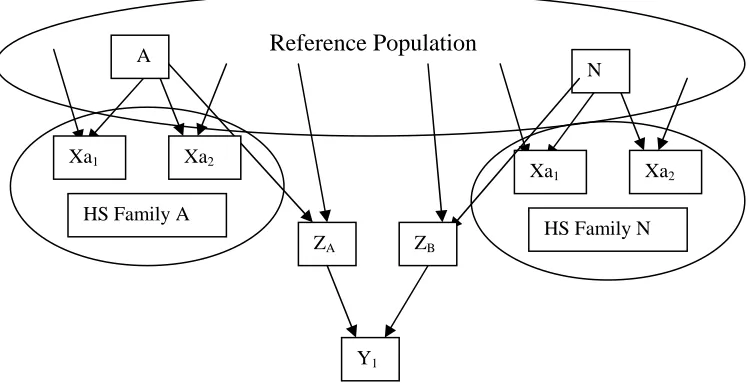
with parental control, and C) mass selection and recombine selfed seed...22 Figure 3. Illustrations of selection units (Xi), recombination units (Zi), and response
units (Yi) for A) half sib recurrent selection and B) half sib recurrent selection
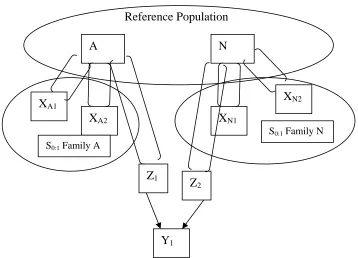
recombine selfed seed ...23 Figure 4. Illustrations of selection units (Xi), recombination units (Zi), and response
units (Yi) for A) full sib recurrent selection and B) S0:1 recurrent selection ...24
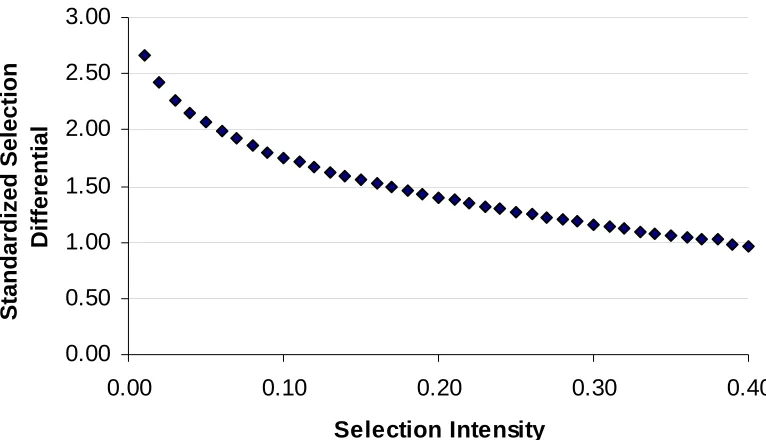
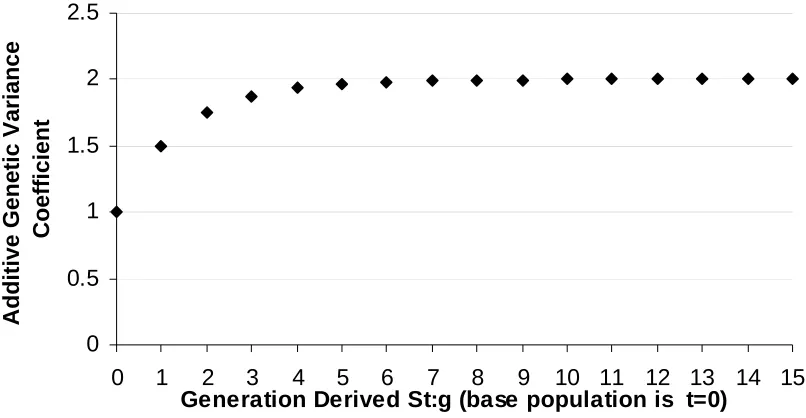
Figure 5. Standardized selection differential plotted against selection intensity ...25 Figure 6. Additive genetic variance coefficient, (1+Ft), for St:g recurrent selection
methods plotted against the generation derived, t. Ft is the inbreeding
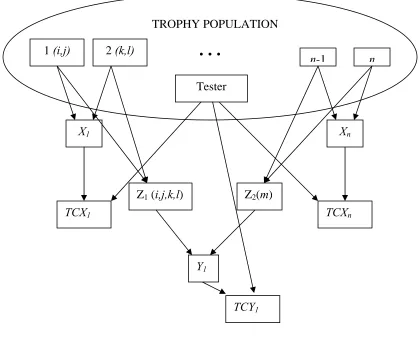
coefficient of the tthgeneration ...26 Figure 7. Illustration of selection units (TCXi), recombination units (Zi), and response
units (TCYi) for full-sib topcross (TC) recurrent selection and derivation of the
genetic covariance (Cov) ...27 CHAPTER II
Figure 1. A histogram of set-adjusted Southern rust rating entry means combined over four environments in 2003 for a population of 143 NC300/B104 maize
recombinant inbred lines topcrossed with FR615xFR697...51 CHAPTER III
Figure 1. Average Gray Leaf Spot ratings of 143 ... NC300/B104 maize recombinant inbred (RI) topcrosses plotted against the average Gray Leaf Spot ratings of the
RI lines per se (a minimum of five environments) ...81 CHAPTER IV
Figure 1. Example of a randomized complete block data set format used by
SPATIALPRO ...108 Figure 2. The relationship between experimental layout and data set construction for a
CHAPTER V
Figure 1. Cycle per se yield averages across five environments in 2006 regressed on cycle number for the TROPHYCOMP and TROPHYELITE
populations...147 Figure 2. Cycle per se percent erect plant averages across five environments in 2006
regressed on cycle number for the TROPHYCOMP and TROPHYELITE
populations...148 Figure 3. Cycle per se moisture averages across five environments in 2006
regressed on cycle number for the TROPHYCOMP and TROPHYELITE
populations...149 Figure 4. Cycle-topcross (Tester = LH132.LH51) yield averages across nine
environments in 2005 and 2006 regressed on cycle number for the
TROPHYCOMP and TROPHYELITE populations...150 Figure 5. Cycle-topcross (Tester = LH132.LH51) moisture averages across nine
environments in 2005 and 2006 regressed on cycle number for the
–CHAPTER I– Literature Review
Gain Estimation
Predicting genetic gain enables plant breeders to determine desirable breeding methods, which solidifies plant breeding as a science. Consequentially, developing desirable selection strategies to enhance gains has facilitated significant increases in crop yields (i.e. maize, Duvick et al., 2004). Annual genetic gain, or the response to selection, is the change in the population mean due to selection, and can be generally predicted as:
ΔY = [βXY(ΔX)]/t (equation 1),
where ΔY is the response to selection, βXYis the regression coefficient between selection
units, X, and response units, Y, ΔX is the change in X, or the selection differential, and t is the number of years for cycle completion (Holland et al., 2003).
Selection units, X, are the operational unit of selection and can be individuals or families. Response units are individuals in the improved population following selection, which are related to X either directly or indirectly through some recombination unit (Figure 1). The selection differential is the deviation of the average performance of selection units chosen for recombination from the population mean.
Clearly defining selection and response units and their genetic relationships is critical in accurately predicting gain (Holland et al., 2003; Nyquist, 1991). The genetic relationships are naturally parameterized through βXY, which was originally defined by Lush (1948) in the context of mass selection, as “the proportion of the phenotypic variance among individuals in a population that is due to heritable genetic effects.” Lush’s definition is referred to as narrow sense heritability, or h2, and was based on his experience as an animal breeder, where
individuals are typically the operational unit of selection. Another variation is broad sense heritability, or the proportion of the phentoypic variance due to all genetic effects, and can be
predicting gain, and for this reason Hanson (1963) suggested that plant breeders define heritability as “the fraction of the selection differential expected to be gained when selection is practiced on a defined reference unit.” This definition interprets heritability in context to estimating gain for an appropriate selection procedure, which enables accurate comparisons of different selection strategies.
Parameters of interest to plant breeders include plot and entry mean based
heritabilities, and they are defined as the proportion of the phenotypic variance among plots and family means, respectively, due to family genetic effects (Holland et al., 2003). Both can be estimators of βXYin predicting gain, but the two differ by the operational unit of selection. The plot-basis estimator is appropriate when practicing selection among plot values (i.e. in the nursery), while entry mean heritability is appropriate when selecting among family averages (i.e. in replicated yield trials). Animal breeders also perform familial selection, but instead of redefining heritability, they typically view βXYas a function of narrow sense heritability (Falconer, 1960). [The reason that works is because the familial relationships are assumed to be functions of additive genetic variance.]
The entry-mean heritability estimator often employed in plant breeding is
σF2 (equation 2), hf2 = σF2+σFE2+σ2
e re
whereσF2 is the among familyvariance component, σFE2 is the family-by-environment variance component, σ2 is the error variance, r is the number of replications, and eis the number of environments. This estimator of βXY is appropriate for gain prediction in the context of predicting the mean performance of untested members of selected families in a new set of environments (Holland et al., 2003), with the square root of hf2 being the accuracy of among family selection (Bernardo, 2002). While this clearly defines the context of the estimator of βXY for a specified selection strategy, this particular one is of little use to breeders in some cases, as it may represent a generational dead end (Holland et al., 2003).
genetic relationships requires a general estimator to readily estimate βXY, which can be defined as
βXY = COV(XY) (equation 3),
σ2Px
where COV(XY) is the genetic covariance between selection and response units, and σ2Px
is the phenotypic variance among selection units. Considering gain, the annual response to selection then becomes
ΔY = COV(XY) ΔX (equation 4),
t σ2Px
and if truncation selection is practiced, this expression reduces to
ΔY = i COV(XY) (equation 5),
t σPx
as ΔX = iσX ,where i is the standardized selection differential. If recombination involves
selection of male and female gametes from unrelated selection units, then the response may be redefined as
ΔY = im COV(XY) + if COV(XY) = 2 COV(XY)
.
( im + if) (equation 6),σPx σPx σPx 2
where im and if are the standardized selection differentials of the male and female
parents, respectively. Assuming equal selection intensities, equation 6 further reduces to 2 i COV(XY), when im = if (equation 7). σPx
Genetic covariances have been defined for many different selection strategies that plant breeders commonly encounter (Burton and Carver, 1993; Cockerham, 1983;
Holland et al., 2003; Nyquist, 1991). The recombination strategy pertaining to equation 7 is referred to as parental control, and is widely deployed in recurrent selection
methodology, as the response to selection doubles when selection is practiced on both parental gametes. In plants, this often requires practicing selection and recombination before flowering if the selection units are individuals, unless they are self pollinated or clonally propagated. Fortunately, this strategy is always feasible when the selection units are families, as untested individuals of selected families can be produced from remnant seed.
The genetic covariance pertaining to equation 7 for non-inbred selection units can be defined generally as,
COV(XY) =2θXY
σ
2A+
(2θXY)2σ
2AA (equation 8),and for St:g lines
COV(XY) =1/2(1+Ft)
σ
2A+ (Ft + Fg)D1 + 1/4(1+Ft)2σ
2AA (equation 9),when recombination involves untested individuals from selected, unrelated families, and Y is
an immediate response unit, where θXY
is the coancestry coefficient between selection and
response units, Ft and Fg are the inbreeding coefficients in the tth and gthgenerations,respectively,
σ
A2is the additive genetic variance,
D1 is the covariance between homozygousdominance deviations and additive effects, and
σ
2AAis the additive-by-additive epistaticvariance (Cockerham and Matzinger, 1985; Holland et al., 2003; Nyquist, 1991). The latter three terms are defined in the reference population, or the idealized selection population in gametic phase equilibrium, and the coancestry coefficient (θXY) is the probability that alleles between X and Y are identical by descent.
When the selection units are families replicated within and across environments, the annual response to selection in equation 7 can be written as
(equation 10),
t σF2 +σFE2 +σ2 ½
e re
to account for the phenotypic variance among family means.
General Methods to Enhance Gain
Equations 5 through 10 can be used to estimate gains for several commonly deployed recurrent selection procedures, illustrated in figures 2 through 4. In general, there are four strategies to enhance gain: increasing selection intensities, adjusting the coefficient of the additive genetic variance, increasing genetic variability, and controlling environmental effects (Bernardo, 2002; Hallauer and Miranda, 1988). Permutations of these variables in context of time can assist breeders in enhancing gains.
The selection intensity, p, is the proportion of selection units chosen for recombination, and is related to the standardized selection differential by
2 i COV(XY)
where z is the standard normal probability density function evaluated typically at the (1- p) percentile. It is apparent in equation 11 that the selection differential increases when p decreases (Figure 5), which increases genetic gain without elongating cycle time. While this strategy is tempting, the selection intensity must be carefully chosen to avoid reducing genetic variability, especially if the program is long term (Hallauer and
Miranda, 1988). Further, high selection intensities, or low values of p, administered during recurrent selection in small populations can drastically change population structure through genetic drift (Sprague and Eberhart, 1977).
Adjusting the additive genetic variance coefficient can be accomplished by parental control and increasing the coancestry coefficient. The former method increases gain without usually elongating cycle time, as previously illustrated (equation 5 versus equation 6).
Increasing the coancestry coefficient by choosing an optimal selection strategy can enhance gain, but this approach is often confounded with cycle time and assumptions about the phenotypic variance among the various selection units and non-additive genetic effects. Nonetheless, S1:2 recurrent selection has the largest additive genetic variance
coefficient amongst the common methods, but with respect to time, mass selection with parental control and with S1 recombination are the most favorable (Table 1). Mass
selection without parental control is half as efficient as practicing parental control. Recurrent selection among later selfing stages does increase the additive genetic variance coefficient (Figure 6), however, selfing beyond S1:2 lines is of little practical value, as the
change in the coefficient diminishes with each additional selfing generation. The increase in additive variation in later selfing generations is offset by longer cycle times.
yield require replicating families within and across environments to improve the accuracy of selection, to ensure that only superior selection units are being recombined.
The parameters for predicting gains are population specific, and population choice is the most critical decision for long term endeavors (Hallauer et al., 1988). Increasing genetic variability, mainly the additive genetic variance, is accomplished through population choice. This should be done in a way to avoid adverse effects on the population mean (Bernardo, 2002), unless the goal is to adapt germplasm to a new set of target environments.
Within each selection method, genetic gain increases as the non-genetic variance among selection units decreases, and this can be aided by various experimental techniques. For individual plant selection, cultural practices that make field conditions more homogenous can reduce experimental error. These methods are also performed with families, but in
general, determining the number of environments and replications needed to optimize the variance among family means, given a limited amount of resources, is widely deployed (Bernardo, 2002). Furthermore, with families, various blocking structures, or experimental designs, in addition to newer spatial analytical approaches can improve precision (Brownie et al., 1993; Brownie and Gumpertz, 1997; Federer, 1956; Federer et al., 2001; Frensham et al., 1997; Gilmour et al., 1997; Papadakis, 1937;).
Most maize breeders utilize advanced-cycle breeding to develop cultivars rather than recurrent selection strategies, but some of the more important maize inbred lines have been developed from the latter (Mikel and Dudley, 2006; Troyer, 1999). Recurrent selection procedures were developed to mitigate the limitations of cultivar development via continuous selfing, mainly the rapid fixation of alleles (Allard, 1960; Eberhart et al, 1967). The methods of gain enhancement are readily extendable to cultivar development, as all breeders practice selection within segregating populations. Furthermore, advance cycle breeding is often viewed as a form of recurrent selection, in which the selection, recombination, and response units are typically inbred lines, and the reference population is all accessible elite germplasm.
Thesis Background
include mapping resistance loci to two foliar disease pathogens of maize, developing a spatial analytical tool to aide breeders in line advancement decisions, and finally, evaluating a long term recurrent selection program practiced on two all-tropical populations of maize. A brief introduction of these topics is presented in the context of gain enhancement.
QTL Mapping
Knowing the genomic regions that are responsible for trait variation can sometimes enhance gain via marker assisted selection. Identifying these regions, or quantitative trait loci (QTL), can be accomplished by several marker-trait association approaches (Brummer et al., 1997; Haley and Knott, 1992; Hyne and Kearsey, 1995; Kao et al. 1999; Jansen et al., 2003; Kearsey and Hyne 1994; Lander and Botstein 1989; Martínez and Curnow, 1992; Rebaї and Goffinet 1993, 2000; Soller, 1976; Thornsberry et al., 2001; Wu and Li, 1994, 1996; Yu et al., 2006; Zeng 1993, 1994). Marker assisted selection (MAS), or the selection of marker genotypes at loci that explain trait variation either directly or through linkage disequilibrium, can include marker-assisted backcrossing and forward-breeding strategies with marker information. The former is a method of line conversion while the latter advances members within breeding populations on the basis of marker genotypes and conventional phenotypic selection.
Incorporating MAS into a breeding program is attractive, as it can reduce time and increase accuracy in backrossing programs (Frisch et al. 1998), aid in selection for traits that are difficult or costly to phenotype, and enhance trait means of populations (Holland, 2004). MAS has been successfully deployed in plant breeding for selecting alleles with large effects on traits with relatively simple inheritance (Chen et al., 2000; Cregan et al., 1999; Young, 1999), but is less promising for polygenic traits, in part because QTL effect and position estimates are often imprecise (Beavis, 1998; Bernardo 2001).
Routinely performing MAS requires a substantial initial investment in technical infrastructure followed by continual financing (Holland, 2004; Morris et al., 2003).
room to improve gains of selection by using marker information (Eathington et al. 1997; Lande and Thompson, 1990).
Marker-assisted backcrossing is certainly a favorable method of reducing time for line conversion when introgressing transgenes, with their market introduction being highly time-sensitive. Mapping QTL and subsequently backrossing them into elite lines is a conservative breeding procedure that generally does not produce enough new allelic
combinations to improve multiple traits at a time (Lee, 1995). Instead, forward breeding with marker information in early segregating populations could be used to enhance the mean for certain key traits.
Several forward-breeding programs using markers have been implemented (Cregan et al., 1999; Eagles et al., 2001; Zhou et al., 2003). In all instances, markers were tightly linked to a resistance gene with a major effect, and the resistance allele was introduced from outside the traditional breeding pool. The rationales for using MAS in these forward-breeding
programs include phenotyping difficulties, variable disease expression, and simple
inheritance of the target traits. The exotic donor alleles allow for introgressed haplotypes to initially occur at low frequencies in elite germplasm. This can ensure high linkage
disequilibrium between the marker and resistance alleles, which is fundamental in maintaining consistent linkage phases across multiple breeding crosses (Luby and Shaw, 2001). Linkage disequilibrium can be maintained also through phenotypic reinforcement, or the issue of linkage disequilibrium can be made inconsequential if the marker directly explains trait variation (Holland, 2004).
Forward breeding will require QTL mapping to become more applicable to multiple populations, as QTL identification and subsequent utilization needs to be conducted in the framework of an entire breeding program, rather than the framework of a single F2
population (Brummer et al., 1997; Flint-Garcia et al., 2003; Holland, 2004; Jansen et al., 2003; Rebaї and Goffinet, 2000; Yu et al., 2006). Mapping QTL in individual populations will still remain beneficial, when unique alleles from otherwise phenotypically poor parents are desired.
resistance gene for Southern Rust was identified on the short-arm of chromosome 10 (Jines et al., 2007), while ten Gray Leaf Spot QTL mapped to chromosomes 1, 2, 3, 4, 8, and 10. The major rust resistance gene and three Gray Leaf Spot QTL corresponded to regions mapped in prior populations. Extensively haplotyping germplasm at these four consensus regions could aid in forward-breeding strategies to efficiently integrate resistance gene combinations into U.S. maize breeding populations. Furthermore, the tropical parental allele, from NC300, increased resistance at three of these four loci, and linkage disequilibrium between marker and target alleles for future crosses would be expected to be maintained across most crosses with elite temperate maize (Cregan et al. 1999; Holland, 2004).
Spatial Analyses
Single-environment trials are used regularly in plant breeding to estimate entry means, which are used in further analyses across multiple environments. Multiple-environment trialsallow for estimating breeding values of experimental lines (Comstock 1977). Such trials are quite expensive, and accurate estimation of entry means within an environment for a multiple-environment trial can be critical for increasing the response to selection, given a limited amount of resources.
Various forms of spatial analyses have been suggested to improve the precision of an experiment when the heterogeneity within blocks becomes consequential, as often occurs with evaluations of large numbers of early-generation breeding lines in plant breeding programs (Cressie and Hartfield, 1996; Cullis and Gleeson, 1991; Gilmour et al., 1997; Kirk et al., 1980; Papadakis, 1937; Tamura et al., 1988; Zimmerman and Harville, 1991). Spatial analyses,such as trend analysis and trend analysis with correlated errors models, can improve precision of genotype mean estimates when such problems arise. These spatial analyses often lead to a reduction in the phenotypic variance among family means, and in doing so, increase the response to selection (Qiao et al., 2004). Additionally, these analyses can improve QTL mapping by increasing the genetic signal relative to experimental error (Moreau et al., 1999).
founded on suggestions for model construction and selection from the literature, the program constructs and optimizes several spatial models for each response variable and
single-environment-trial combination. The spatial and conventional models are compared on the basis of a defined criterion selected by the user. Based on the specified criterion, a preferred model is chosen for each response variable and single-environment-trial combination. Results from the preferred model are organized into SAS data sets, which include (for each variable) Spearman rank correlation coefficients between entry means from the alternative and conventional analyses, entry least square means, F-values for testing the entry main effect, and the error variance estimated from the preferred model.
SPATIALPRO should improve entry mean estimation across environments for situations involving limited sampling of environments. Such circumstances could include choosing entries that merit further evaluation studies (i.e. first year yield trial results), recurrent selection procedures, and QTL mapping studies. The former circumstances will better ensure that precious resources are allocated to superior selection units, while the latter should improve further analyses that assess the consistency of QTL effects across
environments (Moreau et al., 1999).
Recurrent Selection
Advance-cycle breeding is restricting the germplasm base for U.S. maize, which is largely founded upon the recycling of eight inbred lines and their derivatives (Goodman, 2000). Incorporating tropical germplasm into U.S. breeding pools could broaden the U.S. maize germplasm base by increasing genetic variability, but in 1996, U.S. hybrids contained only 0.3% tropical germplasm (Goodman, 1998).
The results from the first and second-cycles of line development suggest it is
relatively easy to develop adapted lines from double-cross tropical hybrids that perform well in topcrosses, but it is fairly difficult to develop such lines that also have favorable per se
performance (Goodman, 2000). Industry would be more apt to develop (50% tropical /50% elite) inbred lines by breeding with all-tropical lines that perform well both in topcrosses and as lines per se. Until such temperate-adapted-all-tropical lines are developed, industrial-breeding efforts with tropical germplasm will probably not be expended beyond single-gene backcrossing programs. Developing semi-tropical inbred lines, though, offers greater long-term promise for widening the U.S. germplasm base (Lewis and Goodman, 2003).
S1 recurrent selection for grain yield was initiated in two populations derived from the
initial TROPHY lines, as an alternative approach to further adapt this germplasm, while concomitantly developing lines with improved per se and topcross performance. These two populations, a composite (TROPHYCOMP) and a synthetic (TROPHYELITE), were derived from the firstand the better yielding second-cycle lines. Currently, the TROPHY composite and elite populations have undergone eight and five cycles, respectively, of S1 per se
recurrent selection.
The TROPHY derivatives (including lines developed through pedigree line recycling and those by recurrent selection) represent novel germplasm. This germplasm, is the only one founded on a diverse set of tropical races which, after initial adaptation, has been enhanced by both pedigree line recycling and S1per se recurrent selection for over 20 years. Successes
from these two different breeding strategies applied to the same material serve as a unique model for deriving inbred lines from tropical germplasm for use in U.S. commercial breeding activities.
Currently, the subsequent recycling of the initial lines has led to the release of 22 additional all-tropical lines. In comparison, no lines developed from any cycle of S1 recurrent
selectionhave been released or heavily recycled into our program. This study was conducted to quantify the progress of S1 recurrent selection for each population and determine if this is a
reasonable approach, or if it needs modification.
cycle-topcrosses are approximately half those reported for commercial breeding activities in the U.S. Corn Belt (Duvick et al., 2004). This is worrisome, as lines derived from future cycles from these populations will unlikely be competitive in hybrids. Naturally, choosing a more modern tester would improve topcross yield, but not necessarily relative yield responses.
To determine the current range in combining ability, ninety-six S1 families were
sampled from the latest cycles of each population and topcrossed to LH132.LH51. Three topcross families did not differ significantly in yield from the commercial check hybrid average. Variance components were estimated based on these topcross families, to explore recurrent selection strategies. The predicted grain yield responses to S1 topcross recurrent
selection to LH132.LH51 for the two populations are substantially more promising then S1 per se selection in terms of deriving higher yielding S1 topcross families. Specifically, the
response for TROPHYELITE population was 73% greater than the historical rates of gain for commercial breeding activities in the U.S. Corn Belt, while the response for the
TROPHYCOMP population was equivalent (Duvick et al., 2004).
Topcross recurrent selection places emphasis on the combining ability of families, and perhaps should be universally chosen in favor of per se recurrent selection when improving all-tropical populations. In part this is because resources, in terms of subsequent line development, are devoted only to families with favorable combining ability, but more importantly, it is because the topcross response of a population to a particular tester is
maximized. The latter insures that derived lines maintain relevancy, and in some instances, as with the TROPHYELITE population, the response can surpass average industrial gains.
S1 topcross recurrent selection may be difficult to execute in two years for our
program, as recombination is required during the winter nursery, and superior topcross families are not identified until after harvesting yield trials in the previous summer season (Table 2). Full-sib topcross recurrent is a practical alternative, but the additive topcross genetic coefficient is 1/4, or half the S1 topcross recurrent selection (Table 3, Figure 7). S1
topcross recurrent selection would require recombining S1 families in a winter nursery such
References
Allard, R.W. 1960. Principles of plant breeding. John Wiley & Sons, Inc., New York.
Balint-Kurti, P.J., M.D. Krakowsky, M.P. Jines, L.A. Robertson, T.L. Molnar, M.M. Goodman, and J.B. Holland. 2006. Identification of quantitative trait loci for
resistance to southern leaf blight and days to anthesis in a maize recombinant inbred line population. Phytopath. 96:1067-1071.
Beavis, W.D. 1998. QTL Analysis: power, precision, and accuracy. p. 145-162. In A.H. Paterson (ed.) Molecular dissection of complex traits. CRC Press, Boca Raton, FL.
Bernardo, R. 2001. What if we knew all the genes for a quantitative trait in hybrid crops? Crop Sci. 41:1-4.
Bernardo, R. 2002. Breeding for quantitative traits in plants. Stemma Press, MN.
Brownie, C., D.T. Bowman, and J.W. Burton. 1993. Estimating spatial variation in analysis of data from yield trials: A comparison of methods. Agron. J. 85:1244-1253.
Brummer, E.C., G.L. Graef, J.H. Orf, J.R. Wilcox, and R.C. Shoemaker. 1997. Mapping QTL for seed protein and oil content in eight soybean populations. Crop Sci. 37: 370-378.
Burton, J.W., and B.F. Carver. 1993. Selection among S1 families vs. selfed half-sib or
full-sib families in autogamous crops. Crop Sci. 33:21-28.
Chen, S., X.H. Lin, C.G. Xu, and Q. Zhang. 2000. Improvement of bacterial blight resistance ‘Minghui 63’, an elite restorer line of hybrid rice, by molecular maker-assisted selection. Crop Sci. 40:239-244.
Cockerham, C.C. 1983. Covariances of relatives from self-fertilization. Crop Sci. 23:1177-1180.
Cockerham, C.C., and D.F. Matzinger. 1985. Selection response based on selfed progenies. Crop Sci. 25:483-488.
Comstock, R.E. 1997. Quantitative genetics and the design of breeding programmes. p. 705-718. In E. Pollack, O. Kempthorne, and T.B.J. Bailey (ed.) Proceedings of
the international conference on quantitative genetics. Iowa State University Press, Ames, Iowa.
Cressie, N.A.C., and M.N. Hartfield. 1996. Conditionally specified Gaussian models for spatial statistical analysis of field trials. J. of Agric., Biol., and Environ. Statistics. 1:60-77.
Cullis, B.R., and A.C. Gleeson. 1991. Spatial analysis of field experiments-An extension to two dimensions. Biometrics 47:1449-1460.
Duvick, D.N., J.S.C. Smith, and M. Cooper. 2004. Changes in performance, parentage and genetic diversity of successful corn hybrids, from 1930 to 2000. p. 65-97. In:
C.W. Smith et al. (ed.), Corn: origin, history, technology and production. John Wiley & Sons, Inc., New York.
Eagles, H.A., H.S. Bariana, F.C. Ogbonnaya, G.J. Rebetzke, G.J. Hollamby, R.J. Henry, and P.R. Henschke. 2001. Implementation of markers in Australian wheat breeding. Aust. J. of Agric. Res. 52: 1349-1356.
Eathington, S.R., J.W. Dudley, and G.K. Rufener II. 1997. Usefulness of marker-QTL associations in early generation selection. Crop Sci. 37:1686-1693.
Eberhart, S.A., M.N. Harrison, and F. Ogada. 1967. A comprehensive breeding system. Der Züchter 37:169169-174.
Falconer, D.S. 1960. Introduction to quantitative genetics.(1st ed.). Ronald Press, NY.
Frensham, A., B. Cullis, and A. Verbyla. 1997. Genotype by environment variance heterogeneity in a two-stage analysis. Biometrics 53:1373–1383.
Federer, W.T. 1956. Augmented (or hoonuiaku) designs. Hawaii. Plant. Rec. 2:191–208.
Federer, W.T., M. Reynolds, and J. Crossa. 2001.Combining results from augmented designs over sites. Agron. J. 93:389-395.
Flint-Garcia, S.A., J.M. Thornsberry, and E.S. Buckler IV. 2003. Structure of linkage disequilibrium in plants. Annu. Rev. Plant Biol. 54:357-374.
Frisch, M., M. Bohn, and A.E. Melchinger. 1998. Comparison of selection strategies for marker-assisted backcrossing of a gene. Crop Sci. 39:1295-1301.
Gilmour, A.R., B.R. Cullis, and A.P. Verbyla. 1997. Accounting for natural and extraneous variation in the analysis of field experiments. J. of Agric., Biol., and Environ. Statistics 2: 269-273.
Goodman, M.M., J. Moreno, F. Castillo, R.N. Holley, and M.L. Carson. 2000. Using tropical maize germplasm for temperate breeding. Maydica 45:221-234.
Haley, C.S., and S.A. Knott, 1992. A simple regression method for mapping quantitative trait loci in line crosses using flanking markers. Heredity 69:315-324.
Hallauer, A.R., and J.B. Miranda. 1988. Quantitative genetics in maize breeding. Iowa State Univ. Press, Ames, Iowa.
Hallauer, A.R., W.A. Russel, and K.R. Lamkey. 1988. Corn breeding. p. 463-564. In
G.F. Sprague and J.W. Dudley (ed.) Corn and corn improvement. 3rd ed. Am. Soc. Agron., Crop Sci. Soc. Am., Soil Sci. Soc. Am., Madison WI.
Hanson, W.D. 1963. Heritability. p. 125-139. In: W.D. Hanson and H.F. Robinson (ed.), Statistical genetics and plant breeding. Publ. 982. Natl. Acad. Sci.-Natl. Res. Counc., Washington, DC.
Holland, J.B. 2004. Implementation of molecular markers for quantitative traits in
breeding programs: challenges and opportunities. Proc. Of the 4th International Crop Science Congress, Brisbane, Australia.
Holland, J.B., W. E. Nyquist, and C.T. Cervantes-Martinez. 2003. Estimating and interpreting heritability for plant breeding: An update. Plant Breed. Rev. 22:9-112.
Holley, R.N., and M.M. Goodman. 1988. Yield potential of tropical hybrid corn derivatives. Crop Sci. 28:213-217.
Hyne, V., and M.J. Kearsey. 1995. QTL analysis: further uses of ‘marker regression’. Theor. Appl. Genet. 91: 471-476.
Jansen, R.C., J. Jannink, and W.D. Beavis. 2003. Mapping quatitative trait loci in plant breeding populations: Use of parental haplotype sharing. Crop Sci. 43:829-834.
Jines, M.P., P.J. Balint-Kurti, L.A. Robertson-Hoyt, T. Molnar, J.B. Holland, and M.M. Goodman. 2007. Mapping resistance to Southern rust in a tropical by temperate maize recombinant inbred topcross population. Theor. Appl. Genet. 114:659-667.
Kao, C-H., Z-B. Zeng, and R.D. Teasdale. 1999. Multiple interval mapping for quantitative trait loci. Genetics 152:1203-1216.
Kearsey, M.J., and V. Hyne. 1994. QTL analysis: a simple ‘marker regression’ approach. Theor. Appl. Genet. 698-702.
horticultural field trials. J. Am. Soc. Hortic. Sci. 105:189-193.
Lande, R., and R. Thompson. 1990. Efficiency of marker-assisted selection in the improvement of quantitative traits. Genetics 124:743-756.
Lander, E.S., and D. Botstein. 1989. Mapping Mendelian factors underlying quantitative traits using RFLP linkage map. Genetics 121:185-199.
Lee, M. 1995. DNA markers and plant breeding programs. Adv. Agron. 55:265-344.
Lewis, R.S., and M.M. Goodman. 2003. Incorporation of tropical maize germplasm into inbred lines derived from temperate x temperate-adapted tropical line crosses: Agronomic and molecular assessment. Theor. Appl. Genet. 107:798-805.
Luby, J.J., and D.V. Shaw. 2001. Does marker-assisted selection make dollars and sense in a fruit breeding program? Hort. Sci. 36:872-879.
Lush, J.L. 1948. The Genetics of populations. Unpublished notes. Iowa State University.
Martínez, O., and R.N. Curnow. 1992. Estimating the locations and the sizes of the
effects of quantitative trait loci using flanking markers. Theor. Appl. Genet. 85: 480-488.
Mikel, M.A., and J.W. Dudley, 2006 Evolution of North American dent corn from public to proprietary germplasm. Crop Sci. 46:1193-1205.
Morris, M., K. Dreher, J.M. Ribaut, M. Khairallah. 2003. Money matter (II): costs of maize inbred line conversion schemes at CIMMYT using conventioanl and marker-asssisted selection. Molecular Breeding 11:235-247.
Moreau, L., H. Monod, A. Charcoset, and A. Galais. 1999. Marker-assisted selection with spatial analysis of unreplicated field trials. Theor. Appl. Genet. 98:234-242.
Nyquist, W.E. 1991. Estimation of heritability and prediction of selection response in plant populations. Crit. Rev. Plant Sci. 10:235-322.
Qiao, C.G. , K.E. Basford, I.H. DeLacy, and M. Cooper. 2004. Advantage of single-trial models for response to selection in wheat breeding multi-environment trials. Theor. Appl. Genet. 108:1256-1264.
Rebaї, A., and B. Goffinet. 2000. More about quantitative trait locus mapping with diallel designs. Genetical Research 75:243-247.
G.A. Payne, C.M. Maragos, T.L. Molnar, and J.B. Holland. 2006. QTL mapping for fusarium ear rot and fumonisin contamination resistance in two maize populations. Crop Sci. 46:1734-1743.
Soller, M., T. Brody, and A. Genizi. 1976. On the power of experimental design for the detection of linkage between marker loci and quantitative loci in crosses between inbred lines. Theor. Appl. Genet. 47:35-39.
Sprague, G.F., and S.A. Eberhart. 1977. Corn breeding. In corn and corn improvement.
G.F. Sprague (ed.) p. 305-362. Am. Soc. Agron., Madison, WI.
Tamura, R.N., L.A. Nelson, and G.C. Naderman. 1988. An investigation of the validity and usefulness of trend analysis for field plot data. Agron. J. 80:712-718.
Thornsberry, J.M., M.M. Goodman, J. Doebley, S. Kresovich, D. Nielsen, and E. S. Buckler IV. 2001. Dwarf8 polymorphisms associate with variation in flowering
time. Nature Genetics 28:286-289.
Troyer, A.F. 1999. Background of U.S. hybrid corn. Crop Sci. 39:601-626.
Uhr D.V., and M.M. Goodman. 1995. Temperate maize inbreds from tropical germplasm. I. Testcross yield trials. Crop Sci. 35:779-784.
Wu, W.R., and W.M. Li. 1994. A new approach for mapping quantitative trait loci using complete genetic marker linkage maps. Theor. Appl. Genet. 89:535-539.
Young, N.D. 1999. A cautiously optimistic vision for marker-assisted breeding. Molecular Breeding 5:505-510.
Yu, J., G. Pressoir, W.H. Briggs, I.V. Bi, M. Yamasaki, J.F. Doebley, M.D. McMullen, B.S. Gaut, J.B. Holland, S. Kresovich, and E.S. Buckler. 2006. A unified mixed-model method for association mapping accounting for multiple levels of relatedness. Nature Genetics 38:203-208.
Zeng, Z-B. 1993. Theoretical basis for separation of multiple linked gene effects in mapping of quantitative trait loci. Proc. Natl. Acad. Sci. USA 90:10972-10976.
Zeng, Z-B. 1994. Precision mapping of quantitative trait loci. Genetics 136:1457-1468.
Zhou, W.C., F.L. Kolb, G.H. Bai, L.L. Domier, L.K. Boze, and N.J. Smith. 2003.
Validation of a major QTL for scab resistance with SSR markers and use of marker-assisted selection in wheat. Plant Breeding 122:40-46.
Table 1. Common recurrent selection (RS) methods and their corresponding additive genetic variance coefficients (coeff) and cycle time in seasons and years (y).
Method coeff Seasonsa Yearsb coeff/Years
Mass Selection(No PCc) 1/2 1 1 1/2
Mass Selection (PC) 1 1 1 1
Mass Selection/recombine 1 2 1 1
S1 seed
Half Sib RS 1/4 3 2 1/8
Half Sib/S1 RS 1/2 3 2 1/4
Full Sib RS 1/2 3 2 1/4
S0:1RS 1 3 2 1/2
S1:2RS 3/2 4 2 3/4
Std:geRS (1+Ftf) g+2 y (1+Ft)/y
a Assuming selection units are tested in one season b Assuming two seasons per year
c Parental control
d The tth generation, the base population is t=0. e The gth generation.
Table 2. The Phases of one cycle of S1 topcross (TC) recurrent selection.
Nursery Phase Generation (Seed Harvested) Purpose
Summer1 1 CiS1 Generate S1 families from Ci cycle
Winter1 2 CiS1TC TC S1 families to tester
Summer2 3 n/a Test S1 family TC in replicated trials
Table 3. The Phases of one cycle of full-sib (FS) topcross (TC) recurrent selection.
Nursery Phase Generation (Seed Harvested) Purpose
Summer1 1 FS FAMILIES Recombine selected FS families
Winter1 2 TC FS FAMILIES Topcross families
Summer2 3 not/applicable Test TC families in replicated trials
Figure 1. Illustration of selection units (Xi), recombination units (Zi), and response units (Yi) for a generalized selection methodology. Units appear in squares and arrows signify patterns of descent.
X1 X2 X3
Z1 Z3
Reference Population (initial cycle)
…
XnZ2 Zn
A) Mass Selection without Parental Control
B) Mass Selection with Parental Control
C) Mass Selection, Recombine Selfed seed
Figure 2. Illustrations of selection units (Xi), recombination units (Zi), and response units (Yi) for A) mass selection without parental control, B) mass selection with parental control, and C) mass selection and recombine selfed seed. Units appear in squares, arrows signify crosses, and parentheses represent selfing. Figures families are encircled individuals are in squares.
X1 X2
Y1
Reference Population
X1 X2
Y1
Reference Population
Z1 Z2
X1
Y1
A) Half Sib (HS) Recurrent Selection
B) Half Sib (HS)/S1 Recurrent Selection
Figure 3. Illustrations of selection units (Xi), recombination units (Zi), and response units (Yi) for A) half sib recurrent selection and B) half sib recurrent selection recombine selfed seed. Units appear in squares, arrows signify crosses, and parentheses represent selfing. Half sib families are encircled.
Xa1
A
ZA
Xa2
HS Family A
Xa1
N
Xa2
HS Family N ZB
Y1
Reference Population
Xa1
A
ZA
Xa2
HS Family A
Xa1
N
Xa2
HS Family N ZB
Y1
A) Full Sib Recurrent Selection
B) S0:1 Recurrent Selection
Figure 4. Illustrations of selection units (Xi), recombination units (Zi), and response units (Yi) for A) full sib recurrent selection and B) S0:1 recurrent selection. Units appear in squares,
arrows signify crosses, and parentheses represent selfing. Families are encircled. XA1 XA2
FS Family A
XA1 XA2
FS Family B
Z1 Z2
Y1
Reference Population
XA1
XA2
S0:1 Family A
XN1
XN2
Z1
Z2
Y1
Reference Population
A N
Figure 5. Standardized selection differential plotted against selection intensity.
0.00 0.50 1.00 1.50 2.00 2.50 3.00
0.00 0.10 0.20 0.30 0.40
Selection Intensity
Standardized Selection
Figure 6. Additive genetic variance coefficient, (1+Ft), for St:g recurrent selection methods
plotted against the generation derived, t. Ft is the inbreeding coefficient of the tth generation.
0 0.5 1 1.5 2 2.5
0 1 2 3 4 5 6 7 8 9 10 11 12 13 14 15
Generation Derived St:g (base population is t=0)
Additive Genetic Variance
Cov(TCX1,TCY1) =
Cov[(μ* + 1/4(αi*+ αj*+ αk*+ αl*)), (μ* + 1/8(αi*+ αj*+ αk*+ αl*) + 1/2 αm*)] = 1/32[E(αi*2) + E(αj*2) + E(αk*2) + E(αl*2)] = 4/32σ2A(T) = 1/8σ2A(T),
and if parental control is practiced, Cov(TCX1,TCY1) = 1/4σ2
A(T),
where μ* is the average of all topcross individuals, αi-m* are the additive topcross effects of alleles from individuals of the TROPHY population, and σ2A(T) is the additive topcross genetic variance in reference to all topcross individuals from the TROPHY population.
Figure 7. Illustration of selection units (TCXi), recombination units (Zi), and response units (TCYi) for full-sib topcross (TC) recurrent selection and derivation of the genetic covariance (Cov). Individuals from the TROPHY population, tester, selection, recombination, and response units appear in squares. Arrows signify crosses, and letters within parentheses represent alleles.
1 (i,j)
n-1 n
Tester
X1 Xn
TCX1 TCXn
Z1 (i,j,k,l) Z2(m)
2 (k,l)
TROPHY POPULATION
…
–CHAPTER II–
Mapping Resistance To Southern Rust in a Tropical By Temperate Maize Recombinant Inbred Topcross Population
by
Michael P. Jines, Peter Balint-Kurti, Leilani A. Robertson-Hoyt, Terrence Molnar, James B. Holland, and M. M. Goodman.
Reprinted from
Mapping Resistance to Southern Rust in a Tropical By Temperate Maize Recombinant Inbred Topcross Population
M.P. Jines, P. Balint-Kurti, L.A. Robertson-Hoyt, T. Molnar, J.B. Holland, and M.M. Goodman
M. P. Jines, L.A. Robertson-Hoyt and M. M. Goodman: North Carolina State University, Dept. of Crop Science, Raleigh, NC 27695-7620. P. Balint-Kurti, and J. B. Holland: U.S. Department of Agriculture-Agricultural Research Service (USDA-ARS) Plant Science Research Unit, North Carolina State University, Raleigh, NC 27695-(7616 and 7620, respectively). T. Molnar: Pioneer Génétique, Pacé, France.
Corresponding author: M.P. Jines: E-mail: [email protected], Tel +1-919-515-7039, Fax 1-919-515-7959.
Abstract
Southern rust, caused by Puccinia polysora Underw, is a foliar disease that can severely
reduce grain yield in maize (Zea mays L.). Major resistance genes exist, but their
effectiveness can be limited in areas where P. polysora is multi-racial. General resistance
mapped for both traits. The entry mean heritability estimate for Southern rust resistance was 0.93. A multiple interval mapping (MIM) model, including four QTL, accounted for 88% of the variation among average disease ratings. A major QTL located on the short arm of chromosome 10, explained 83% of the phenotypic variation, with the NC300 allele carrying the resistance. Significant (P<0.001), but relatively minor, topcross-by-environment
interaction occurred for Southern rust, and resulted from the interaction of the major QTL with the environment. Maturity and Southern rust rating were slightly correlated, but QTL for the two traits did not co-localize. Resistance was simply inherited in this population and the major QTL is likely a dominant resistant gene that is independent of plant maturity.
Introduction
Southern rust, caused by Puccinia polysora Underw., has been a major problem for
corn production in Africa (Agarwal et al. 2001) and Asia (Chen et al. 2004). In the southern United States, significant Southern rust infections have occurred approximately one year in five. When epiphytotics have occurred they were often serious, causing yield losses of up to 45% (Raid et al.1988; Rodriguez-Ardon 1980). The periodic nature of Southern rust
epiphytotics has made breeding for resistance challenging, and the severity of the disease when it does occur can be attributed, in part, to the limited resistance of the U.S. maize crop ( Futrell 1975; Futrell et al.1975).
Several races of P. polysora, distinguished by the reactions they incite on different
maize lines, have been reported. Three races, EA1, EA2 and EA3 were found in East Africa (Ryland and Storey 1955; Storey and Ryland 1954; Storey and Howland 1961). Six further races ( PP. 3, PP. 4, PP. 5, PP. 6, PP. 7 and PP.8) were identified from North and Central American isolates and were shown to be distinct from the East African races (Robert 1962). A tenth P. Polysora race (PP. 9) was discovered by Ullstrup (1965).
At least three unique, major, race-specific Southern rust resistance genes have been discovered. Major genes, Rpp1 and Rpp2 were identified by Storey and Howland (1957) and
confer resistance to P. polysora races EA1 and EA2, respectively. These genes were shown
to be loosely linked to each other (Storey and Howland 1959), but their genomic locations
polysora race PP. 9 was identified from Boesman Yellow Flint (Ullstrup 1965). It was shown
to be closely linked to the Rp1 gene for resistance to common maize rust (causal agent
Puccinia sorghi Schw.) on the short arm of chromosome 10. Another major gene that also
confers resistance to race PP. 9 was identified (Futrell 1975; Hooker et al. 1975), but its linkage and allelic relationships with Rpp9 were not established.
Major genes for resistance to Southern rust on the short arm of chromosome 10 have been reported in at least 4 different subsequent studies, using different sets of maize
germplasm (Scott et al. 1984; Holland et al. 1998; Liu et al. 2003; Chen et al. 2004). The major genes reported in these studies were closely linked to Rpp9 in each case, but linkage or
allelic relationships and racial specificity of these genes were not determined. This
knowledge is of importance as major resistance (race-specific) genes commonly fail in the tropics, where multiple races of P. polysora exist (Carlos and Ferreira 2002). The loss of
valuable maize and fungal stocks from the closing of both Hooker and Ullstrup programs in combination with the tight linkages of dominant resistance genes on chromosome 10 has made obtaining such information very difficult.
General resistance could be achieved by combiningquantitative and race-specific resistances. This would be desirable if the resistance alleles maintained resistance across environments while not increasing plant maturity. Quantitative trait loci (QTL) forSouthern rust resistance have been mapped on chromosomes 3 and 4 ( Holland et al., 1998), 3, 4 and 9 (Jiang et al. 1999) and 9 ( Brunelli et al. 2002), but none co-localized across studies(Wisser et al. 2006). Most of these experiments, unfortunately, did not use complete genome
coverage in mapping resistance QTL, and some QTL may have not been detected. In addition, the effectiveness of the resistance provided by these QTL to hybrids was not addressed.
In these Southern-rust-resistance mapping studies, the interaction between resistance genes and the environment was not extensively investigated because the
phenotypic distributions of populations were often assumed to result from simple modes of inheritance. Only Holland et al. (1998) evaluated Southern rust resistance in multiple environments, and they reported significant, but relatively minor, genotype-by-environment interaction. However, they did not investigate QTL-by-environment interaction.
the consistency of QTL effects over environments (Bubeck et al.1993). Such knowledge can further assist in choosing candidate QTL for marker assisted selection by preventing
erroneous decisions resulting from often overestimating the percent of phenotypic variation explained by QTL (Bubeck et al, 1993; Beavis et al. 1998).
Southern rust, and other foliar diseases of maize, such as gray leaf spot and anthracnose (caused by Cercospora zeae-maydis Tehon and E. Y. Daniels and
Colletotrichum graminicola (Ces.) G. W. Wils, respectively), are generally late season
diseases in North Carolina, with most disease development occurring post-anthesis (White 1999). Although significant correlation between Southern rust and maturity has not been reported, there is concern that disease ratings could be correlated with maturity, as demonstrated in studies that mapped resistance to other diseases and maturity QTL in the same populations (Bubeck et al.1993; Carson et al. 2004; Clements et al. 2000; Jiang et al. 1999; Jung et al. 1994). These studies collectively demonstrated that disease resistance and flowering time were slightly correlated, that QTL for each trait would sometimes map to similar genomic regions, and that such regions usually increased both disease resistance and maturity.
The infrequent occurrence of Southern rust in the United States has resulted in
inconsistent selection environments, which has led to difficulties in selecting and maintaining Southern rust resistance in U.S. maize breeding lines. In the absence of selection pressure, stochastic processes govern gene frequencies in breeding populations (Wright 1952). Such processes can often result in losing alleles, especially those with minor effects on resistance, from populations, as has occurred with common rust resistance genes (Davis et al. 1990). In this case, it might be more effective to use marker-assisted selection for loci linked to major and partial-restistance QTL, despite the questionable durability of major race-specific resistance alleles.
The first objective of this study was to localize and estimate the effects of minor and major sources of Southern rust resistance loci using DNA markers with thorough genome coverage in a tropical by temperate RI topcross population for potential use in developing resistant hybrid varieties via marker assisted selection. The second objective was to