ABSTRACT
KAUFMANN, KARL ALEXANDER. Equidistance Errors in a Reduced Cue Environment. (Under the direction of Donald H. Mershon.)
The equidistance tendency (ET) is the tendency of an observer to misperceive the depth interval between objects in a scene as being smaller than it actually is, particularly in the absence of strong depth cues and as the lateral separation
between the objects decreases (Gogel, 1965). The present experiment was an attempt to create a display that would evoke a change in the influence of the ET as the lateral separation of display objects was varied. The display configuration used replicated (with updated equipment) that of a previous study (Hill and Mershon, 1985) which had reliably produced the desired effect. However, one property of the new
Equidistance Errors In A Reduced Cue Environment
by
Karl Alexander Kaufmann
A thesis submitted to the Graduate Faculty of North Carolina State University
in partial fulfillment of the requirements for the degree of
Master of Science
Psychology
Raleigh, North Carolina 2009
APPROVED BY
______________________ ______________________
Dr. Thomas Hess Dr. James Kalat
______________________ ______________________
Dr. Christopher Mayhorn Dr. Donald H. Mershon
BIOGRAPHY
TABLE OF CONTENTS
LIST OF TABLES...iv
LIST OF FIGURES ...v
Equidistance Errors in a Reduced Cue Environment...1
Method... 11
Participants...11
Apparatus...11
Procedure...14
Results... 17
Discussion... 25
References... 32
APPENDICES... 33
Appendix A... 34
LIST OF TABLES
Table 1 Pilot experiment one: Mean perceived distance to the
monocular rectangle………...8
Table 2 Pilot experiment two: Mean perceived distance to the monocular triangle………..……...10
Table 3 Planned sequence of separations………...16
Table 4 Mean monocular triangle distance by separation, gender, and rectangle source (m)………..19
Table 5 Mean rectangle distance, binocular triangle distance, and range (m) by rectangle source………....20
Table 6 Monocular triangle position as percent of range between binocular triangle and rectangle………...21
Table 7 Mean range between binocular triangle and rectangle (m)………..22
Table 8 Mean rectangle perceived distances………..23
Table 9 Mean binocular triangle perceived distances………....24
LIST OF FIGURES
Figure 1. Frontal view of the display used by Hill and Mershon (1985)
(separation at maximum)………...3 Figure 2. Results from Hill and Mershon (1985)………...4 Figure 3. First pilot experimental display. Area surrounding the white
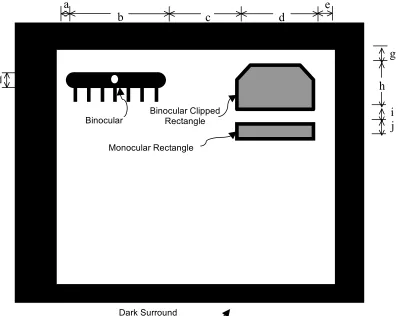
rectangle and enclosed objects was completely dark to limits of visual field. White rectangle was 285 x 228 min (w x h). Other dimensions were: a = 36 min; b = 70 min; c = 45 min; d = 89 min; e = 44 min; f = 20 min; g = 5 min; h = 59 min; i = 2, 40, 80,
or 120 min; j = 30 min………...6
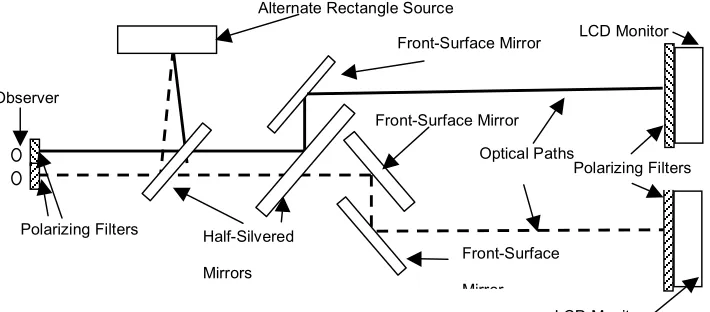
Figure 4. Schematic of visual display system. The paths from monitors show the mirrors reflecting each image. The actual images from each monitor are superimposed via a half-silvered mirror, and visible to only the corresponding eye due to crossed-polarizing filters at both the monitors and the observer position. Total optical path to each monitor was 4 m, and to the alternate physical rectangle source was 3 m.………...……….12 Figure 5. Comparison of results of present experiment to youngest group in
Equidistance Errors in a Reduced Cue Environment
Depth perception is a particularly important aspect of the visual experience, because perceptions of the size and velocity of objects are dependent on accurate perceptions of distance (Gogel, 1973). Under Gogel’s (1990) theory of phenomenal geometry, perceptions of the size, shape, orientation, and motion of visual targets are all derived from the primary perceptual variables of perceived egocentric distance, perceived direction, and perceived self-motion. According to phenomenal geometry, the perceived size of a target is determined by its angular size and the perceived distance to the object (Gogel, 1998). Similarly, the perceived velocity of a target is a function of its angular velocity and perceived distance. Errors in
perceived distance and subsequent errors in perceived velocity and perceived size can lead to problems in everyday tasks. For example, driving safely is especially dependent on accurate perceptions of distance and velocity, and errors can have dire consequences.
can lead to misperceptions of distance, especially when cues are lacking, is the Equidistance Tendency. According to Gogel (1965):
“The equidistance tendency is the tendency for objects or parts of objects, in the absence of effective distance cues, to appear visually at the same distance as each other with the strength of this tendency being inversely related to the directional separation of the objects or parts” (p. 245).
Thus, when cues are insufficient to establish distances to individual objects, the visual system creates the perception that they are all at the same distance from the viewer. Objects in the scene must be located somewhere; the tendency is one way for the visual system to resolve depth ambiguity.
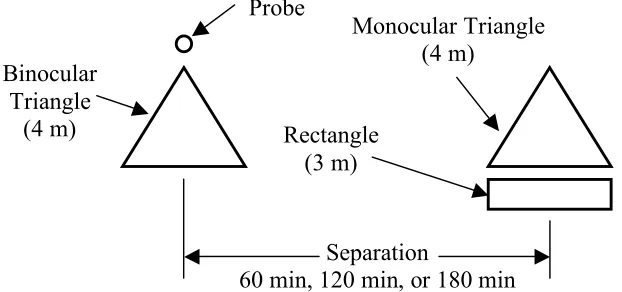
Beyond a lack of cues and the separation between the objects in a scene, age was also shown to play a role in the strength of the ET by Hill and Mershon (1985). In this experiment, they presented observers in each of three age groups (18 to 22 years old, 35 to 45 years old, and 60 years old and over) with a display consisting of a monocularly observed triangle at a physical distance of 4 m, a binocularly
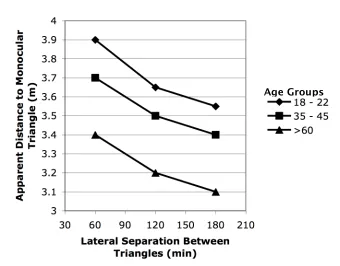
Absent the ET effect between the rectangle and the monocular triangle, all of the visual information present would support the perception that the triangles were both at the same distance from the observer. Both were the same angular size and shape, both were at the same optical distance from the observer, and both were of equal luminance. Adding the rectangle to the display introduced the potential for an ET error, leading participants to perceive the monocular triangle as nearer than the binocular triangle. As separation between the triangles increased, participants reported that the perceived distance to the monocular triangle was reduced toward 3 m (see figure 2). The overall magnitude of this effect increased across the three age
groups from youngest to oldest, with no interaction between age and separation. The original proposal for the present experiment was to reexamine the relationship between age and ET strength found by Hill and Mershon (1985) and
Probe
Binocular Triangle
(4 m)
Monocular Triangle (4 m)
Rectangle (3 m)
Separation
60 min, 120 min, or 180 min
extend the results by using participants in more finely divided age groups and to attempt to link ET strength to the perceived difficulty of driving tasks that depend on accurate distance perception. This experiment was also to use more modern and larger LCD monitors, rather than the small CRT monitors that were used in the original experiment. These larger monitors were expected to make it possible to extend the range of lateral separations that could be used for the display, further extending the results beyond the original experiment. The foremost concern in developing a usable display was that it create the expected variation in ET
Figure 2. Results from Hill and Mershon (1985)
Age Groups
strength with variations in object separation. During the assembly of the apparatus for the experiment, it was found that in contrast to CRT monitors, the LCD monitors available were not capable of displaying a true black. An LCD monitor is backlit and uses polarizing filters to dim the display instead of simply not illuminating areas of blank screen. When displaying what appears to be black under typical room lighting conditions, there is always a small amount of light that is emitted from the darkest areas of the monitor. In normal use, this light is dim enough not to be seen, but under the darkened conditions of a vision laboratory, it remains faintly visible against the otherwise dark surround.
For the first experiment, it was decided to try to use this property to create a substitute display (see figure 3). A large white rectangle was formed by the whole extent of the monitors, which were located at a physical distance of 4 m from the observer. A second smaller gray rectangle with two “clipped” corners was placed in the upper right portion of the white rectangle. Both of these rectangles were
presented stereoscopically, with the large white rectangle at 4 m and the gray clipped rectangle at 3 m from the observer. A second gray rectangle was placed directly below the clipped rectangle. This rectangle was monocular and at a physical distance of 4 m.
was measured with a round white binocular probe in the upper left corner of the white surface. The probe was displayed against a black pill-shaped area that appeared as an opening in the white surface. The perceived distance of the probe was changed stereoscopically by varying the horizontal position of the probe on
a e
g
h i j
Binocular
Probe
Binocular Clipped Rectangle Monocular Rectangle
Rectangle
b c d
Dark Surround
f
each of the monitors. Participants controlled the probe’s position in depth by using a joystick. The probe’s stereoscopic distance could range from 2.75 m (.25 m nearer to the participants than the binocular clipped rectangle) to 4.25 m (.25 m farther from the participants than the white surface). Participants indicated the perceived distance of the monocular rectangle by placing the probe at the same perceived distance as the monocular rectangle. The black vertical lines extending below the opening for the probe were added to help promote binocular fusion of this portion of the display.
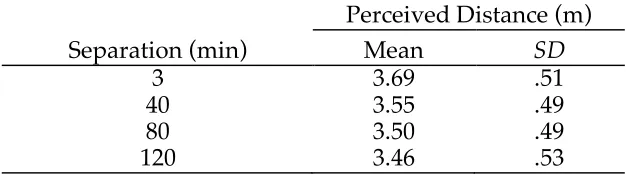
An ANOVA of perceived distance to the monocular rectangle at each of the four vertical separations (table 1) found no significant differences between them. Instead, the large white surface seemed to have an unexpected anchoring effect on the monocular rectangle, acting to stabilize its perceived distance between the two other objects. The white surface provided strong cues for locating it at 4 m. The clipped rectangle was subject to a binocular disparity cue that located it at 3 m, well ahead of the surface. Acting against these cues was the ET effect between the surface and the clipped rectangle (which would have decreased their separation). The
clipped rectangle (increasing the perceived distance between the white surface and the rectangle).
Table 1
Pilot experiment one: Mean perceived distance to the monocular rectangle
Perceived Distance (m)
Separation (min) Mean SD
3 3.69 .51
40 3.55 .49
80 3.50 .49
120 3.46 .53
The unexpected stability in perceived distance to the monocular rectangle may have been due to the monocular and clipped rectangles both being located on the white surface. Because of this, the ET effects on both rectangles from the surface would have been at strong, because neither object ever had any lateral separation from the surface. The magnitude of the variation in ET effect between the rectangles as their separation was changed may have been small enough to be inconsequential relative to the cue relationships and the ET effect of the surface. Since the display did not evoke the necessary ET effect to complete the original experiment investigating the relationship between ET and age, efforts shifted to attempting to develop a different and more suitable display.
the same shapes in the same display configuration as in the original study. As expected, the LCD monitors did emit a small amount of light and were faintly visible in the observation alleyway, even when displaying plain black screens. However, with the high degree of contrast between the white shapes and the darkened monitors, it was thought that the faint light emitted might not be obtrusive enough to have a significant effect on the observers’ experience.
There was one other difference in the display from the original experiment. In the original experiment, the rectangle was created by a physical light source located 1 m closer to the observers than the monitors displaying the triangles and probe. This consisted of a cutout in an opaque mask over a diffuse light source. In the second pilot experiment, all objects were presented on the LCD monitors, with the depth interval between the rectangle and triangles created through disparity.
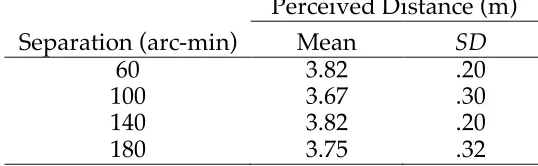
The results were similar to those of the first pilot. Perceived distance to the monocular object (the right-hand triangle) did not vary significantly with lateral separation between the two triangles (see table 2). Two possibilities seemed most likely as explanations for the difference in results between this experiment and the original, since there were only two remaining differences between the two displays. First, there may have been some additional cues available from the rectangle in the 1985 experiment (due to its physical presence at a different optical distance).
Perhaps such a subtle difference influenced the effect of the ET on the perceived distance to the original monocular triangle.
Table 2
Pilot experiment two: Mean perceived distance to the monocular triangle
Perceived Distance (m)
Separation (arc-min) Mean SD
60 3.82 .20
100 3.67 .30
140 3.82 .20
180 3.75 .32
Second, the faint illumination from the LCD monitors, while unobtrusive, might still be sufficient to act as an additional object in the display, much as the clearly visible white surface in the first pilot experiment appeared to do.
There were two objectives for the present experiment. First, it was a third attempt to create an effective display in which the strength of the ET effect would vary with the separation of the display objects. The second objective was to attempt to explain why the previous display did not evoke the expected ET effect by
eliminating one of the two differences between the second display and the original experiment’s display.
Once again, the Hill and Mershon (1985) style display consisting of a pair of triangles (one binocular and the other monocular), a nearer rectangle beneath the monocular triangle, and a probe above the binocular triangle was used. Since the observation alleyway was already configured with the LCD monitors, it was
decided to investigate whether the use of a physical rectangle would account for the difference in results between the second pilot experiment and the original
rectangle on the monitors. This allowed a direct comparison of the perceived
distance to the monocular triangle under both conditions. This rectangle was located 1 m nearer to the observers than the monitors. Thus, the physical rectangle had not only the disparity depth cues that were available with the rectangle on the monitors in the first two experiments, but also the cues from the small difference in optical distance.
Method
Participants
The participants were 32 undergraduate students (16 men and 16 women) from the introductory psychology participant pool who were recruited through an online recruiting system. All received research credit toward completing a course requirement for their participation in the experiment. Three participants also received monetary compensation ranging from $10 to $25 based on their performance on one set of the experimental observations. All completed the informed consent form in appendix A.
All participants had Snellen acuity of 20/30 or better (corrected by glasses or contact lenses if correction was normally used). Participants were also screened for stereoacuity of 2.4 min-arc or better using a Keystone Telebinocular system.
Apparatus
full display was 4.75 deg wide by 3.8 deg high. The visual path distance from the observer’s eye position to the monitors was 4.0 m. Crossed-polarizing filters were placed over each monitor and at the observation booth’s eyeholes, so that the left monitor display was only visible to the left eye and the right monitor was only visible to the right eye. Apparent distance to the display elements was manipulated by horizontally moving images on the monitors to create differing amounts of crossed or uncrossed disparity. Participants were seated in a darkened observation booth and viewed the display at eye level. Chin and forehead rests were used to stabilize viewing position at the eyeholes. The observation booth was equipped with a shutter that was used to block the eyeholes between trials. Participants controlled the distance of the probe with a hand-held keypad. The keypad was also used to signal the experimenter when the participant had completed each observation.
Figure 4. Schematic of visual display system. The paths from monitors show the mirrors reflecting each image. The actual images from each monitor are superimposed via a half-silvered mirror, and visible to only the corresponding eye due to crossed-polarizing filters at both the monitors and the observer position. Total optical path to each monitor was 4 m, and to the alternate physical rectangle source was 3 m.
Polarizing Filters Polarizing Filters Front-Surface Mirror Front-Surface Mirror Half-Silvered Mirrors Optical Paths (4 m) Alternate Rectangle Source
Front-Surface Mirror
LCD Monitor LCD Monitor
The display elements presented were as close to those used in the original Hill and Mershon (1985) display as possible (see Figure 1). As in the original, each triangle was an equilateral triangle 60 min-arc wide. One difference was that four levels of separation between the triangles were used (60, 100, 140, and 180 min-arc, measured between the upper tips of each), whereas Hill and Mershon (1985) used only three (60, 120, and 180 min-arc). The monocular triangle and rectangle
appeared in the same position for each trial, while the binocular triangle and probe were displaced horizontally to create the desired separations. The triangles, probe, and rectangle were all presented as solid white objects against the darkest
background that the LCD monitors were capable of displaying. The backlighting of the monitors created the expected faint dark gray rectangular background for the display elements that was visible against the full darkness of the visual alley.
The rectangle was created in two different ways. For half the trials, the rectangle appeared on the monitors with the other shapes. For the other half of the trials, the rectangle was produced by the alternate rectangle source shown in Figure 4. This consisted of a diffused light source masked and reflected into the
participant’s line of sight by a half-silvered mirror to produce a rectangle of the same size and in the same position as the rectangle that appeared on the monitor. The light source was filtered to match the color and brightness of the rectangle on the monitor.
photometer fitted with a Tektronix J6523 one-degree narrow-angle luminance probe. The luminance of the binocular triangle was .58 cd/m2
, the monitor rectangle was .27 cd/m2, the alternate rectangle was .38 cd/m2, and the darkened monitor
background was .14 cd/m2
. The probe’s luminance could not be measured, because it was less than 1 degree in size. The luminance of the background of the alleyway surrounding the displays was too low to be measured.
Procedure
Participants first completed the informed-consent paperwork and were
briefed on the general process of the experiment. Following the briefing, participants completed the screening tests, and a measurement of the closest distance they could focus. Their inter-pupilary separation was also measured. This distance was
necessary to calculate the lateral positions of the display objects to create the correct amount of disparity and to determine the apparent distance of the probe. The participants were then seated in the observation booth with the shutter to the display area closed. The participants were given a verbal description of the display in which the shapes that would be visible and their lateral positions were described. They were also instructed on the use of the keypad for adjusting the probe distance and signaling the end of each trial, and the use of the chin rest. The complete
instructions are in appendix B.
stereoscopic distance of 4.25 m for each trial. The first adjustment for each block was to set the probe distance to match the distance to the binocular triangle.
The mean binocular triangle distance measurement was also used as the criterion for the cash awards, with the participant having the closest mean distance to 4.0 m across all binocular triangle trials receiving $25. The participant with the second closest mean distance received $15, and the participant with the third closest mean distance received $10.
The second adjustment was to set the distance of the probe to indicate the apparent distance to the rectangle. Finally, the monocular triangle was added to the display and two trials in which participants set the distance of the probe to match the distance to the monocular triangle were completed. The observation position shutter was closed between trials, and the probe was reset to 4.25 m. Each trial began with 30 s of observation before participants were allowed to begin adjusting the probe. Owens and Wist (1974) and Lodge and Wist (1968) found that the
The order of the two rectangle sources was balanced across participants, so that half of the participants made their observations with the light box rectangle present during the first set of four separations and the monitor rectangle during the second set. The other half of the participants made their observations with the monitor rectangle present during the first set of separations and the light box rectangle present during the second set.
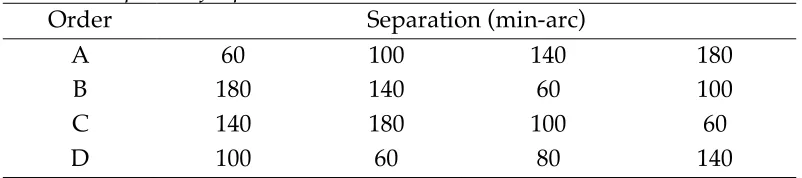
Participants completed four of the sets of observations in which they viewed each separation once. It was planned to balance the order in which the separation levels appeared through a Latin Square, so that each separation level occurred once in each position in the sequence of each set for each participant. Four orders were planned to accomplish this (see Table 3 for the separation orders). The orders were balanced across participants and genders, so that four men and four women
received each of the four orders. In total, each participant completed 32 observations (four at each of four separation levels with each of the two rectangle sources).
Table 3
Planned sequence of separations.
Order Separation (min-arc)
A 60 100 140 180
B 180 140 60 100
C 140 180 100 60
After all observations were completed, participants were debriefed and research credit was awarded. The cash awards were mailed to the winners after all participants had been run.
Results
One final screening criterion for participants was used during the
observations. To be included in the analysis, participants were required to set the probe in the range 3.9 to 4.1 m on the binocular triangle trials. This corresponds to three button presses on the controller for an observer with a typical IPD. Each single press moved the probe horizontally one pixel on each monitor, the minimum
practical with the present system. Because the probe images moved an equal horizontal distance with each button press, the apparent distance the probe appeared to move with each button press varied slightly depending on IPD
(observers with wider than typical IPDs would experience a slightly larger change in distance than those with smaller IPDs). If a participant could not consistently
achieve this level of accuracy throughout the experiment, it was taken as an
The main measure of interest was the apparent position of the monocular triangle as a function of its horizontal separation from the binocular triangle. Two measures were used in the analyses of the data. First, monocular triangle distance was measured as the stereoscopic distance from the participant to the probe, when the probe’s apparent distance was reported as being the same as the monocular triangle. Monocular triangle distance was also considered as a proportion of the apparent separation between the binocular triangle and rectangle. Beyond the expected equidistance effects between the rectangle and the monocular triangle, it was also thought that there might be an ET effect between the binocular triangle and rectangle that could vary with their lateral separation from each other which would change the apparent distance between the two objects. To account for this
possibility, a range value representing the apparent depth between the binocular triangle and rectangle was computed for each separation as the difference between the stereoscopic probe settings for the binocular triangle and the rectangle. The apparent position of the monocular triangle could then be described as a proportion of the distance between the binocular triangle and the rectangle, with 0 percent of range representing the case in which the monocular triangle appeared at the same distance as the binocular triangle, and 100 percent of range when the monocular triangle appeared at the same distance as the rectangle (no matter what the apparent distance of the rectangle might be).
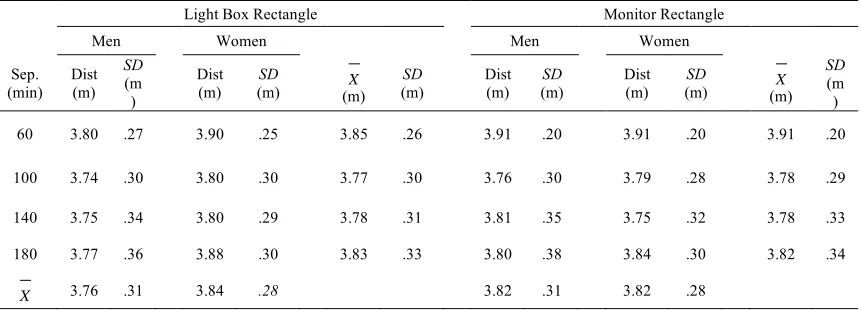
performed were to determine whether it was reasonable to collapse the data across gender and rectangle source. The distance values were compared with a 4
(separation) x 2 (gender) x 2 (rectangle source) between subjects ANOVA which found no significant differences or interactions. Gender was collapsed and the
remaining distance-based analyses are based on the whole sample of 32 participants.
Table 4
Mean monocular triangle distance by separation, gender, and rectangle source (m)
Light Box Rectangle Monitor Rectangle
Men Women Men Women
Sep. (min) Dist (m)
SD
(m )
Dist (m) (m) SD
!
X
(m)
SD
(m) Dist (m) (m) SD Dist (m) (m) SD
! X (m) SD (m )
60 3.80 .27 3.90 .25 3.85 .26 3.91 .20 3.91 .20 3.91 .20
100 3.74 .30 3.80 .30 3.77 .30 3.76 .30 3.79 .28 3.78 .29
140 3.75 .34 3.80 .29 3.78 .31 3.81 .35 3.75 .32 3.78 .33
180 3.77 .36 3.88 .30 3.83 .33 3.80 .38 3.84 .30 3.82 .34
!
X 3.76 .31 3.84 .28 3.82 .31 3.82 .28
After collapsing across gender and rectangle source, the relationship between monocular triangle distance and separation was tested with an ANOVA. Distance did not significantly vary with separation, F(3, 124) = .95, p = .42, N = 32.
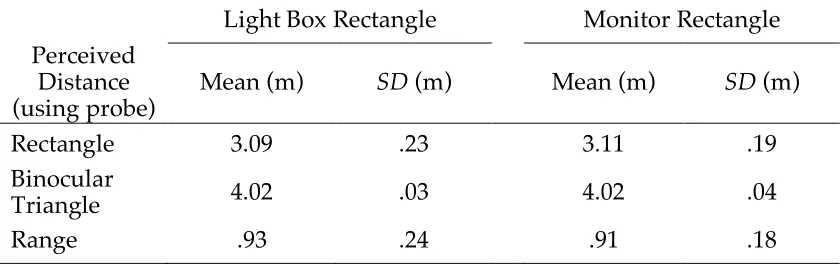
Table 5
Mean rectangle distance, binocular triangle distance, and range (m) by rectangle source
Light Box Rectangle Monitor Rectangle
Perceived Distance
(using probe) Mean (m) SD (m) Mean (m) SD (m)
Rectangle 3.09 .23 3.11 .19
Binocular
Triangle 4.02 .03 4.02 .04
Range .93 .24 .91 .18
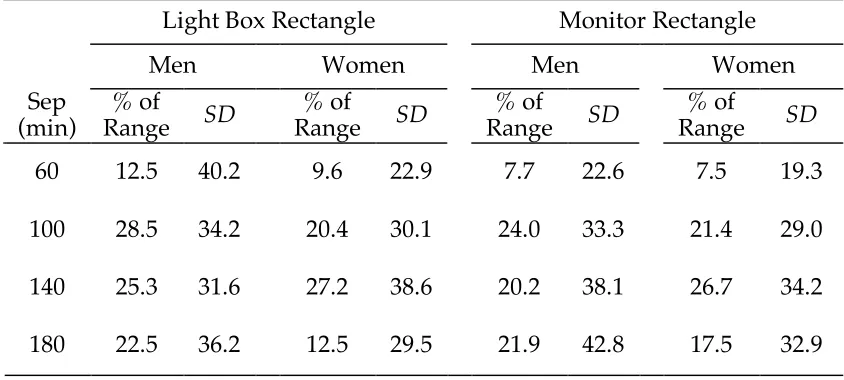
Percent of range as the measure of apparent monocular triangle position showed a slightly different result (see table 6). A 4 (separation) x 2 (gender) x 2 (rectangle source) ANOVA found a significant difference in percent of range with separation [F(3, 240) = 2.95, p = .03) , but no significant differences related to gender or rectangle source, and no interactions. A post hoc test with Tukey’s HSD found that mean percent of range at both 100 min-arc separation (23.6%) and 140 min-arc
Since there were no significant differences in monocular triangle distance associated with separation, the difference in percent of range between binocular triangle and rectangle must be attributable to something other than apparent monoc
ular triangle position. A 4 (separation) x 2 (gender) x 2 (rectangle source) ANOVA on range between binocular triangle and rectangle was performed. Significant effects from both gender [F(1, 240) = 10.2, p = .002] and separation
Table 6
Monocular triangle position as percent of range between binocular triangle and rectangle
Light Box Rectangle Monitor Rectangle
Men Women Men Women
Sep
(min) Range % of SD Range % of SD Range % of SD Range % of SD
60 12.5 40.2 9.6 22.9 7.7 22.6 7.5 19.3
100 28.5 34.2 20.4 30.1 24.0 33.3 21.4 29.0 140 25.3 31.6 27.2 38.6 20.2 38.1 26.7 34.2
180 22.5 36.2 12.5 29.5 21.9 42.8 17.5 32.9
women (.96 m, SD = .13 m) was significantly greater than that for men (.88 m, SD = .26 m) (see table 7).
Apparent rectangle position also showed significant differences due to separation [F(3, 240) = 4.04, p = .008] and gender [F(1, 240) = 9.53, p = .002] in a 4 (separation) x 2 (gender) x 2 (rectangle source) ANOVA. Tukey’s HSD showed that mean rectangle distance at 60 min-arc separation (3.04 m) was significantly less than distance at 180 min-arc separation (3.16 m). Mean distance for men (3.14 m, SD = .26 m) was significantly greater than the mean distance for women (3.06 m, SD = .13 m) (see table 8).
Table 7
Mean range between binocular triangle and rectangle (m) Separation (min-arc)
60 100 140 180
Dist
(m) (m) SD Dist (m) (m) SD Dist (m) (m) SD Dist (m) (m) SD
All
Participants 1.00 .20 .92 .20 .88 .22 .89 .22
Women 1.03 .13 .95 .12 .93 .11 .95 .15
Men .96 .25 .89 .25 .83 .26 .84 .26
Monitor
Rectangle .97 .18 .92 .14 .87 .19 .89 .20
Light Box
Binocular triangle distance was also found to vary with separation [F(3, 240) = 74.1, p < .001], but not with gender or rectangle source. There were no interactions among the factors. Tukey’s HSD showed that the mean binocular triangle distances at 60 min-arc (4.04 m) and 180 min-arc (4.05 m) were not significantly different from each other, both were greater than the mean distances at 100 min-arc (3.99 m) and 140 min-arc (4.00 m), which were also not significantly different from each other (see table 9). While the differences were significant, the magnitude of the differences in distances was considerably smaller than that of the differences in rectangle distance.
Table 8
Mean rectangle perceived distances
Separation (min-arc)
60 100 140 180
Dist
(m) (m) SD Dist (m) (m) SD Dist (m) (m) SD Dist (m) (m) SD All
Participants 3.04 .18 3.07 .19 3.13 .21 3.16 .24
Women 3.02 .13 3.05 .12 3.08 .11 3.10 .15
Men 3.07 .22 3.10 .24 3.17 .28 3.22 .29
Monitor
Rectangle 3.07 .17 3.07 .14 3.13 .19 3.16 .23 Light Box
Rectangle 3.02 .20 3.08 .23 3.12 .24 3.16 .25
separations. On one set of data forms the last two separations were transposed. Instead of the 60 min-arc separation occurring eight times as the first, second, third, or fourth observation, it never occurred as the third separation seen by the
participants. The 100 min-separation never occurred as the fourth observation by participants. Also, one participant was run using the wrong sequence of
observations, which further unbalanced the order of presentation. The final number of appearances of each separation level in each position in the sequence of
observations is as shown in table 10.
An ANOVA was performed to see if there was evidence that the apparent distance to the display objects at each separation varied depending on whether it
Table 9
Mean binocular triangle perceived distances
Separation (min-arc)
60 100 140 180
Dist
(m) (m) SD Dist (m) (m) SD Dist (m) (m) SD Dist (m) (m) SD All
Participants 4.04 .03 3.99 .02 4.00 .03 4.05 .03 Women 4.05 .02 3.99 .03 4.01 .02 4.05 .03 Men 4.04 .03 3.99 .02 4.00 .03 4.04 .03 Monitor
Rectangle 4.04 .03 3.99 .03 4.00 .03 4.04 .03 Light Box
was the first, second, third, or fourth observation. The apparent distance of the display objects did not vary significantly between observations, so it appears
unlikely that the differences that were found in the other analyses are attributable to order effects.
Table 10
Number of occurrences of separations in each sequence position
Position Separation
(min) 1 2 3 4
60 8 10 0 14
100 12 9 11 0
140 8 8 9 7
180 9 8 7 8
Discussion
The expected relationship between lateral proximity and equidistance error was not found, nor were the results of Hill and Mershon (1985) replicated. Figure 5 provides a comparison to the most age-similar Hill and Mershon (1985) results. While the perceived distance to the monocular triangle at 60 min of separation was quite similar in both experiments, in the present experiment perceived distance remained the same as separation increased.
and Mershon (1985). In this experiment, all three display objects constantly
appeared against the background of the LCD screen, which was essentially a fourth object in the display. In order to untangle the results, its effect must also be taken into account.
In general, the apparent distances of objects in a scene are determined by the interacting influences of multiple depth cues and innate tendencies in the visual system that can often act in opposition to the cues. Depth cues may converge on the same apparent distance for a particular object, or the cues may conflict, with
different cues suggesting different distances for the same object. In resolving Figure 5. Comparison of results of present experiment to
conflicting cues, the visual system seems to weight cues operating between more adjacent objects more heavily than cues between more separated objects, as explained by the adjacency principle (Gogel, 1954).
For the experiment three display, the perceived distances of the visible objects were functions of the strengths of the various distance cues between the objects and the influence of the equidistance tendency. The major cue available for most of the objects was binocular disparity, with the strength of other cues deliberately
minimized. For the monocular triangle, even disparity was unavailable. According to the adjacency principle, the strength of the cue relationships between the three
display objects would have been dependant on their proximity. Thus, the cue relationships between the display objects should have been at their strongest when the triangles were at the closest separation and the cue relationship between the binocular triangle and the other display objects should have been weakest when the triangles were most separated.
Apart from the cue relationships between the display objects, the strength of the equidistance tendency by itself also increases not just with proximity, but also when distance cues are weak or absent (Gogel, 1965). It was expected that the strength of the ET effects between the monocular triangle, binocular triangle, and rectangle relative to the strength of the depth cues in this display would be sufficient to measurably influence the apparent distance of the monocular triangle. Instead, the presence of the monitor surfaces appearing behind the display objects, and thus immediately adjacent to the other three objects at all times, may have served to anchor the monocular triangle’s distance so strongly that the separation between the monocular triangle and the binocular triangle was irrelevant.
What was also surprising was that the apparent distance of the rectangle, despite possessing a good binocular disparity cue, varied with separation. Its distance seems to have been the result of balancing the influences of the cue
At 60 min-arc separation, when the lowest corners of the two triangles were nearly touching, the cue relationship between binocular triangle and rectangle was at its strongest, and the apparent distances of the binocular objects were closest to their calculated stereoscopic distances. While the proximity of the binocular objects should also increase the strength of the equidistance tendency, the tendency is attenuated by the strong cues in the display. Its influence, though reduced, could account for the binocular and rectangle distances being slightly in excess of 4 and 3 m respectively. Both objects appeared against the faint screen background. The interposition cue would lead participants to perceive that background as farther than the objects with complete contours visible before it, though with no
information for the visual system to derive a magnitude of separation between them. Based on cues alone, the binocular triangle would appear at about 4 m and the
rectangle would appear at approximately 3 m, with another surface behind them. The equidistance tendency’s influence would then act to reduce whatever apparent depth interval there would be between the surface and the objects, here resulting in an apparent distance to the rectangle greater than 3 m and to the binocular triangle greater than 4 m.
Though the distance of the monocular triangle did not vary significantly with separation, when expressed as percent of the range between the binocular triangle and rectangle, the monocular triangle was perceived as significantly closer to the rectangle at 100 and 140 min-arc separations than at 60 and 180 min-arc separations. This was not due to the variations in perceived distance to the monocular triangle. Instead, the distance between the binocular objects varied, which in turn affected the range between the binocular triangle and rectangle.
The lack of variation in apparent distance of the monocular triangle as separation changed is similar to the results of the two small-scale pilot experiments that preceded the present experiment. The first was outlined in the original
proposal, using a display that used the entire area of the monitors as a white binocular surface with the other shapes interposed in front of it (see fig 3). The second pilot experiment used the same display as the present experiment, but did not include trials with the physical rectangle. Again apparent distance to the monocular triangle did not vary significantly with separation (see table 2).
Since the only remaining difference between the present display and the original Hill and Mershon (1985) is the faint background from the monitor
the monocular object. The next step in confirming that this is the case would be to return to CRT monitors, in order to eliminate the presence of the monitor surfaces behind the primary objects.
A more interesting question is just how visible the surface behind the objects needs to be, in order to have the strength of influence observed here. In preparing this experiment, it was thought that the surface would be sufficiently dim with great enough contrast between it and the other objects to have a negligible effect on their apparent positions. That does not seem to be the case at all. This would also require returning to CRT monitors, but rather than varying separation between the
References
Gogel, W. C. (1954). Perception of the relative distance position of objects as a function of other objects in the field. Journal Of Experimental Psychology, 47, 335-342.
Gogel, W. C. (1965). Equidistance tendency and its consequences. Psychological Bulletin, 64, 153-163.
Gogel, W. C. (1973). The organization of perceived space: Perceptual interactions. Psychologische Forshung, 36, 195-221.
Gogel, W. C. (1990). A theory of phenomenal geometry and its applications. Perception and Psychophysics, 48, 105 - 123.
Gogel, W. C. (1998). An analysis of perceptions from change in optical size. Perception and Psychophysics, 60, 805 - 820.
Hill, G. W., & Mershon, D. H. (1985, September). Age-related changes in distance
judgements. Paper presented at the 29th annual meeting of the Human Factors Society, Baltimore, MD.
Lodge, H., & Wist, E. R. (1968). Growth of the equidistance tendency over time. Perception & Psychophysics, 3, 97-103.
Appendix A
North Carolina State University INFORMED CONSENT FORM for RESEARCH
Visual Perception
Principal Investigator: Karl Kaufmann Faculty Sponsor: Dr. Don Mershon
We are asking you to participate in a research study. The purpose of this study is to improve our understanding of certain aspects of human visual perception
INFORMATION
If you agree to participate in this study, you will be tested for acuity and depth perception with a machine similar to that used for driver’s license exams and renewals you will also complete two short questionnaires. You will then be asked to observe a visual display and move certain objects you see with a joystick. The entire experiment should take one hour or less.
RISKS
Some people may find the observation booth for the visual display to be small, and it will be darkened during your observations. If being in a small and/or darkened space causes you anxiety, you may not wish to participate in this particular study. Otherwise, there are no risks associated with participation.
BENEFITS
There are no immediate personal benefits to participating. The research you are contributing to will help us to understand the effects of certain aspects of visual perception on important tasks that rely on our ability to accurately perceive our surroundings.
CONFIDENTIALITY
The information in the study records will be kept strictly confidential. Data will be stored securely in the control of the research team at all times. No reference will be made in oral or written reports which could link you to the study.
COMPENSATION
For participating in this study you will receive two credits toward the research requirement of PSY 200. If you withdraw while spending less than 30 minutes participating you will receive one credit. You can also fulfill the research requirement of PSY 200 by writing a short research paper instead of participating in experiments. See your instructor for details. In addition, your performance on at least 8 of the experimental trials will be used to compute an accuracy score for your performance. The participant with the highest accuracy score will receive $25, the participant with the second highest score will receive $15, and the participant with the third highest score will receive $10.
CONTACT
PARTICIPATION
Your participation in this study is voluntary; you may decline to participate without penalty. If you decide to participate, you may withdraw from the study at any time without penalty and without loss of benefits to which you are otherwise entitled. If you withdraw from the study before data collection is completed, your data will be returned to you or destroyed at your request.
CONSENT
“I have read and understand the above information. I have received a copy of this form. I agree to participate in this study with the understanding that I may withdraw at any time.”
Subject's signature_______________________________________ Date _________________
Appendix B Participant Instructions Welcome/Briefing
This experiment deals with depth perception. There are two main parts, a short set of general eye tests like you might get during a typical eye exam and then the actual
experimental observations. There will be a total of 32 experimental observations. We’ll be doing the first part here and the second part in the observation booth just behind me. I expect the whole experiment to take about one hour.
Screening
The first thing we’ll do is use this machine to check a specific type of depth perception. It’s the same type of vision tester that you may have used when you got your driver’s license.
*** Use Keystone stereoacuity card patter ***
If unable to achieve 36.06 sec-arc stereoacuity: I’m sorry, but it doesn’t look like we will be able to collect data from you today. The depth judgments that this experiment requires are quite demanding and rely on a specific type of depth cue. To be certain that the data we collect is reliable, we need to be sure that our participants are able to use this cue to perceive very small distance differences, and based on this test I’m not sure that you’d be able to do that today.
If concerned about not passing: This isn’t necessarily cause for concern. I’m not an eye doctor and can’t diagnose any vision problems. If you are concerned about your vision, the best thing you can do is see an eye doctor for a complete eye exam.
If 36.06 sec-arc stereoacuity, continue with screening
The next thing will do is measure how far apart your eyes are. I need this measurement to set up the equipment for the experiment.
*** Set box for left eye ***
Rest your forehead against the pad and look into the box. You should see the
so that the line runs across the middle of your pupil. Be sure to keep your head still from now on.
I’m going to change a setting, and you should again see a reflection of your eye with a vertical line, though it may no longer be centered. This time, tell me which way I need to move the line to center it, but don’t move your head.
*** Set box for right eye and adjust ***
Now I’m going to reset the box to the original setting. Don’t move your head. *** Reset to left eye ***
Is the line still centered?
*** If not repeat process and emphasize need to keep head still *** I’m going to change the setting one more time. Again, keep your head still.
*** Set for both eyes *** Is the line still centered?
*** If not repeat process and emphasize need to keep head still *** Thanks, you can sit back now.
The next measurement we need is how closely you can focus. This block has a section of an old-fashioned telephone book on it. I’d like you to rest the feet of the stick on your cheeks and slide the block until it is as close as you can get it and still be able to clearly see the writing on the block. Thank you.
The last test before we start the experiment is a standard eye chart. Please stand in the area marked with tape. Do you wear glasses or contacts?
Using both eyes, would you please read line 6?
*** Continue until two letters are missed ***
If unable to achieve 20/40: I’m sorry, but it doesn’t look like we will be able to collect data from you today. We need our participants to reach 20/40 on our chart.
If 20/40 or better: That’s the last of the measurements I need to make before beginning the experiment (lead to booth).
In Booth
Please have a seat. You’ll be looking through this window while you’re making your observations. There is a chin rest and a pad for you to rest your forehead on. You can adjust the height of the chin rest. I’ll be in another part of the lab while you’re making your
observations, this is an intercom so that we can talk to each other. You don’t need to push any buttons for me to hear you, just speak in a normal tone of voice.
What you’ll see through the window are several white shapes. There will always be a triangle at the left side of the display with a circle directly above the top point. To the right of the triangle and circle you’ll either see a horizontal rectangle or the rectangle along with a second triangle.
You can move the circle over the left hand triangle using these buttons. The one at the bottom will move the circle closer to you, and the one above it will move the circle farther away from you. If you hold a button down, the circle will move continuously. You can also make small movements of the circle by pressing and releasing, or tapping, the button.
distance as carefully as you can. The time to complete the observation doesn’t matter; all that we are concerned with is the accuracy of the distance that you set the circle. You’ll also probably find that some adjustments are easier than others. That’s OK and expected. Just take your time and set the distance of the circle as carefully as you can. When you have the circle where you want it, just press the button in the upper right corner once to signal me that you’ve finished adjusting the circle.
So, the process for each observation you make will go like this: I’ll open a shutter on the window so you can see the display. I’ll ask you to just look at the display for about 30 seconds, then tell you to set the distance of the circle to match the distance to one of the shapes. Please don’t start moving the circle until I tell you to do so. Once you have the circle set where you want it, press the button in the upper right corner once to signal that you’re done with that observation. I’ll close the shutter, set up the next display, and open the shutter again. Altogether you’ll be doing 32 observations. Don’t forget that all we are interested is the accuracy of each observation, take your time and position the circle as carefully as you can. Do you have any questions?
I’ll be turning out the light and closing the door behind me as I leave. If for any reason you should need to get out of the booth before I can open the door for you, there is a glow in the dark sticker on the middle of the door knob, just reach for that to open the door. I’ll give you a call on the intercom as soon as I’m at the desk to set everything up for you. First Observation
Here is the first display, please don’t move the circle yet. Could you describe what shapes you see?
*** Should see left triangle, probe, and rectangle ***
If unable to fuse, or other display appearance problem, close shutter for a moment and give another chance at seeing display correctly. If unable to correctly see display, excuse with inadequate stereoacuity wording.
If correctly seen: Please tell me which shape appears farthest away from you? *** Should be probe ***
If not probe, close shutter for a moment and try again. If unable to correctly perceive depth interval, excuse with inadequate stereoacuity wording.
If correctly seen, confirm that the rectangle appears closest and the triangle appears in the middle.
If 30 sec has not elapsed: Please just keep looking at the shapes for a moment. If 30 sec has elapsed: Now, please move the circle so that it is at the same distance from you as the triangle beneath it. Remember, if you hold the button on the controller, the circle will move continuously. If you tap the button, it will move only a small distance. When the distances are the same, press the button in the upper right corner.
*** Adjustment finished *** Close shutter.
If within range 3.9 – 4.1 m: reset display with rectangle only button. Open shutter and start time for 30 secs.
Please don’t move the circle until I tell you. This time I’ll be asking you to make the distance to the circle to match the distance to the rectangle.
After 30 sec: You can move the circle now.
*** Adjustment finished ***
Close shutter. Set display for next trial with monocular triangle. Open shutter and start time for 30 secs.
Please don’t move the circle until I tell you. This time I’ll be asking you to make the distance to the circle to match the distance to the right hand triangle directly above the rectangle.
After 30 sec: You can move the circle now.
*** Adjustment finished ***
Please don’t move the circle until I tell you. This time I’ll be asking you to make the distance to the circle to match the distance to the triangle.
After 30 sec: You can move the circle now.
*** Adjustment finished *** Close shutter.
If outside range 3.9 – 4.1 m (± 3 clicks for IPD = 5.5 mm): excuse using wording from inadequate stereoacuity.
If within range 3.9 – 4.1 m: reset display with rectangle only button. Open shutter and start time for 30 secs.
Please don’t move the circle until I tell you. This time I’ll be asking you to make the distance to the circle to match the distance to the rectangle.
After 30 sec: You can move the circle now.
*** Adjustment finished ***
Close shutter. Set display for next trial with monocular triangle. Open shutter and start time for 30 secs.
Please don’t move the circle until I tell you. This time I’ll be asking you to make the distance to the circle to match the distance to the right hand triangle directly above the rectangle.
After 30 sec: You can move the circle now.
*** Adjustment finished ***
Please don’t move the circle until I tell you. This time I’ll be asking you to make the distance to the circle to match the distance to the right hand triangle directly above the rectangle.
After 30 sec: You can move the circle now.
*** Adjustment finished *** Repeat process for all trials.
When complete: That was the last adjustment. I’ll be right around to open the booth for you.
Debrief
Thanks very much for your participation in this experiment. What we are investigating are certain situations in which people are susceptible to errors in depth perception. A lot of the trials may have looked the same to you, but we actually made changes in the depth cues that were available to you from trial to trial. By comparing the distances you set the circle to, we hope to be able to see how those changes in cues affected your perception of the distances between the objects.
As soon as I can after finishing all the participants, I’ll notify the three with the highest accuracy scores and make arrangements for paying them. I’ll also let all of the other participants know that the prizes have been awarded.