University of Windsor University of Windsor
Scholarship at UWindsor
Scholarship at UWindsor
Electronic Theses and Dissertations Theses, Dissertations, and Major Papers
6-1-1978
Information content and task performance: A study of older
Information content and task performance: A study of older
workers.
workers.
Hatem Mahdy Ali
University of Windsor
Follow this and additional works at: https://scholar.uwindsor.ca/etd
Recommended Citation Recommended Citation
Ali, Hatem Mahdy, "Information content and task performance: A study of older workers." (1978). Electronic Theses and Dissertations. 6720.
https://scholar.uwindsor.ca/etd/6720
This online database contains the full-text of PhD dissertations and Masters’ theses of University of Windsor students from 1954 forward. These documents are made available for personal study and research purposes only, in accordance with the Canadian Copyright Act and the Creative Commons license—CC BY-NC-ND (Attribution, Non-Commercial, No Derivative Works). Under this license, works must always be attributed to the copyright holder (original author), cannot be used for any commercial purposes, and may not be altered. Any other use would require the permission of the copyright holder. Students may inquire about withdrawing their dissertation and/or thesis from this database. For additional inquiries, please contact the repository administrator via email
INFORMATION CONTENT AND TASK PERFORMANCE:
A STUDY OF OLDER WORKERS
by
HATEM MAHDY ALI
A Thesis
Submitted to the Faculty of Graduate Studies
through the Department of Industrial Engineering
in Partial Fulfillment for the
Degree of Master of Applied Science
At The University of Windsor
Faculty of Graduate Studies
University of Windsor
UMI Number: EC 54706
INFORMATION TO USERS
The quality of this reproduction is dependent upon the quality of the copy submitted. Broken or indistinct print, colored or poor quality illustrations and photographs, print bleed-through, substandard margins, and improper alignment can adversely affect reproduction.
In the unlikely event that the author did not send a complete manuscript and there are missing pages, these will be noted. Also, if unauthorized copyright material had to be removed, a note will indicate the deletion.
UMI Microform E C 5 4 7 0 6 Copyright 2010 by ProQuest LLC
All rights reserved. This microform edition is protected against unauthorized copying under Title 17, United States Code.
ProQuest LLC
789 East Eisenhower Parkway P.O. Box 1346
Ann Arbor, Ml 48106-1346
Hatem Mahdy All 1978
I wish to dedicate this work to my family
ii
ABSTRACT
A study was conducted to investigate the variation in speed of
performance and decision making ability with age. Twenty volunteers from
local industry formed the subject group. Ten of these ranged in age from
52 to 63 years. The control group ranged in age from 18 to 29 years.
The task performed involved decision making, hand movement and positioning
elements. Three levels of information load (2, 3 and 4 bits), four
distances of move (7", 10", 13" and 16"), and four levels of radial
clearance (0.008", 0.063", 0.25" and 0.75") were taken as independent
variables. The dependent variable, performance time, was composed of
the decision and movement time components (DT and MT). In addition,
heart rate was also monitored.
It was found that age was a significant determinant of performance
time (p < 0.05). The components of performance time, I.e., decision and
movement times were both significantly higher for the older subjects as
compared to the younger ones (p < 0.05) reflecting the fact that there is
some natural slowing of psychomotor function with age in such combined
manual and decision tasks. The information load and the distance of move
were significant determinants of decision time and also of movement time
(p < 0.05). The clearance was a significant determinant of movement time
(p < 0.05). The difference between the older subjects and the younger
subjects in decision time increased with an increase in the information
load. An analysis of the performance errors for the self paced task
indicated that the slowing among the older subjects was not observed at
the expense of accuracy. The study provided no evidence that age has an
effect on heart rate variability under different levels of information
ACKNOWLEDGEMENTS
I wish to express my deep appreciation and gratitude to
Dr. D. S. Kochhar for his continuous and patient guidance as well as
generous aid and constructive criticism through the completion of this
work.
The many suggestions made by Professor N. Shklov of the Department
of Mathematics, Professor G. Diewert of the Faculty of Human Kinetics
and Dr. R. Lashkari of the Industrial Engineering Department, were of
great value in developing and modifying this project.
My thanks also go to my friend Ingrid for her great assistance and
encouragement. I deeply appreciate her sharing.
I am particularly grateful to the staff of the Central Research
Shop and the Electronic Design Center at the University of Windsor for
their participation in the design and maintenance of the experimental
equipment.
In conclusion,I wish to thank Mrs. Valerie Stein for conscientiously
typing the manuscript.
iv
TABLE OF CONTENTS
Page
ABSTRACT ill
ACKNOWLEDGEMENTS iv
LIST OF TABLES viii
LIST OF FIGURES x
CHAPTER 1. INTRODUCTION 1
CHAPTER 2. LITERATURE SURVEY 5
2.1 Introduction 5
2.2 Information Content and Task Performance 5
2.3 Age Differences in Reaction Time 8
2.3.1 Simple Reaction Time 8
2.3.2 Discrimination and Choice Reaction Time 9
2.A Age Differences in Reaction and Movement Time 11
2.5 Effect of Age on Speed and Accuracy of Movement 13
2.6 Task Performance and Heart Rate 1A
2.7 Conclusion 15
CHAPTER 3. THE STUDY 17
3.1 Objective of the Present Study 17
3.2 Method 18
3.2.1 Subjects 18
3.2.2 Apparatus 22
3.2.3 Experimental Runs 31
CHAPTER A. EXPERIMENTAL DESIGN 33
A.l Experimental Models 33
A.1.1 Decision Time Models 35
Page
4.1.3 Performance Errors Models 46
4.1.4 Heart Rate Model 47
4.2 Experimental Procedure 48
CHAPTER 5. DATA ANALYSIS 49
5.1 Decision Time 51
5.1.1 The First Model 51
5.1.1.1 Test on Homogeneity of Interactions
with Subjects 54
5.1.1.2 Analysis of the Main Effects 55
5.1.1.3 Analysis of the Interactions 57
5.1.2 The Second Model 70
5.2 Movement Time 73
5.2.1 The First Model 73
5.2.1.1 Test on Homogeneity of Interactions
with Subjects 75
5.2.1.2 Analysis of the Main Effects 76
5.2.1.3 Analysis of the Interactions 79
5.2.2 The Second Model 93
5.2a Performance Time 101
5.3 Performance Errors 103
5.3.1 Test on Homogeneity of Interactions with Subjects 106
5.3.2 Analysis of the Main Effects 108
5.4 Heart Rate 111
5.4.1 Test on the Homogeneity of Interactions with
Subjects 115
CHAPTER 6. .RESULTS AND DISCUSSION 119
6.1 Decision Time 119
6.1.1' First Model 119
6.1.2 Second Model 121
..-t
Page
6.2 Movement Time 122
6.2.1 First Model 122
6.2.2 Second Model ■ 123
6.3 Performance Errors 126
6.4 Heart Rate 128
CHAPTER 7. CONCLUSIONS 130
REFERENCES 133
APPENDIX A:
A. 1 Instruction to Subjects A-l
A.2 Duration of the experimental runs and the rest periods A-l
APPENDIX B:
Sample of Part of the Results of the Test for Normality B-l
APPENDIX C :
C.l Sample of Part of the Results for the Means of Performance,
Decision and Movement Time C-l
C.2 Means of Percentage of Heart Rate Increase C-18
C.3 Percentage of Performance Errors C-21
APPENDIX D :
Computer Programmes and Results D-l
APPENDIX E:
Test on Homogeneity of Interactions with Subjects Using
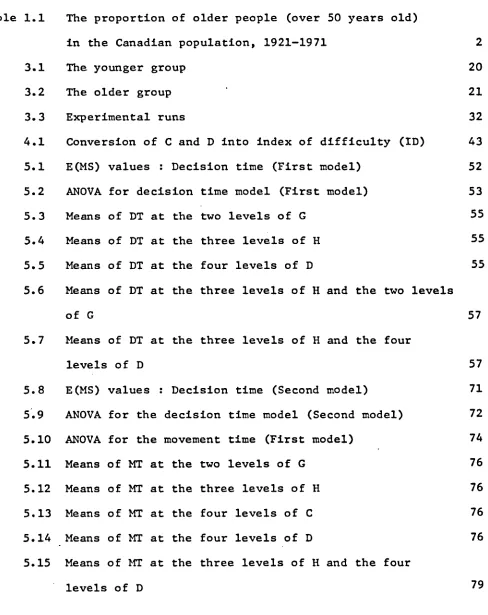
LIST OF TABLES
Page
Table 1.1 The proportion of older people (over 50 years old)
in the Canadian population, 1921-1971 2
3.1 The younger group 20
3.2 The older group 21
3.3 Experimental runs 32
4.1 Conversion of C and D into index of difficulty (ID) 43
5.1 E(MS) values : Decision time (First model) 52
5.2 ANOVA for decision time model (First model) 53
5.3 Means of DT at the two levels of G 55
5.4 Means of DT at the three levels of H 55
5.5 Means of DT at the four levels of D 55
5.6 Means of DT at the three levels of H and the two levels
of G 57
5.7 Means of DT at the three levels of H and the four
levels of D 57
5.8 E(MS) values : Decision time (Second model) 71
5.9 ANOVA for the decision time model (Second model) 72
5.10 ANOVA for the movement time (First model) 74
5.11 Means of MT at the two levels of G 76
5.12 Means of MT at the three levels of H 76
5.13 Means of MT at the four levels of C 76
5.14 Means of MT at the four levels of D 76
5.15 Means of MT at the three levels of H and the four
levels of D 79
vili
Page
Table 5.16 Means of MT at the Four Levels of C and the Four
Levels of D 79
5.17 ANOVA for Movement Time (Second Model) 94
5.18 Means of Movement Time at the Different Levels of ID 96
5.19 Test on Means of MT at the 16 Levels of ID 97
5.19a ANOVA for Performance Time Model 102
5.20 E(MS) for the Percentage of Errors Model 104
5.21 ANOVA for the Percentage of Errors 105
5.22 ANOVA for Percentage of Errors Model with Pooled
Interaction with Subjects 107
5.23 Mean Percentage of Performance Errors at the Three
Levels of H 108
5.24 E(MS) for Heart Rate Model 113
5.25 ANOVA for Percentage Increase in Heart Rate. 114
5.26 Means of % Increase in Heart Rate for Both Groups at
the Three Levels of H 116
5.27 Means of % Increase in Heart Rate for Both Groups at
LIST OF FIGURES
Page
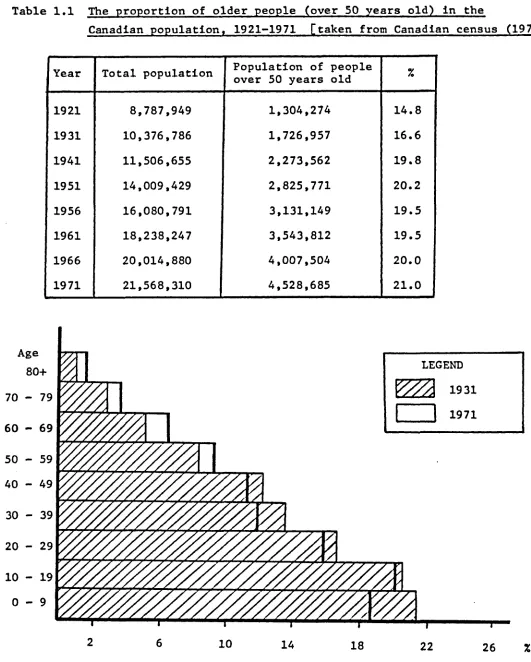
Figure 1.1 Percentage distribution of population by age groups,
Canada, 1931 and 1971 2
3.1 Equipment set-up 26
3.2 Signal response unit (S-R) 27
3.3 Time measuring, recording and tape reader units 28
3.4 Signal response unit 29
3.5 Pin system 30
4.1 Experimental Conditions 37
4.2.a Response holes for the second level of information
load (H3) 38
4.2.b Response holes for the first level of information
load (H2) 38
4.3 The different levels of distances (D) 39
4.4.a S-R unit for the 4 holes task 40
4.4.b S-R unit for the 8 holes task 40
4.4.c S-R unit for the 16 holes task 40
5.1 Effect of information load on decision time 58
5.2 Effect of information load on decision time at
different levels of distances 59
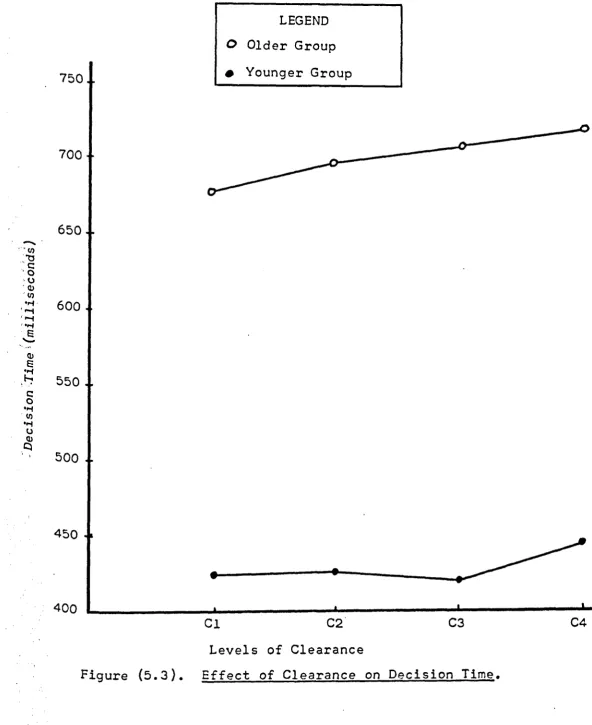
5.3 Effect of clearance on decision time 61
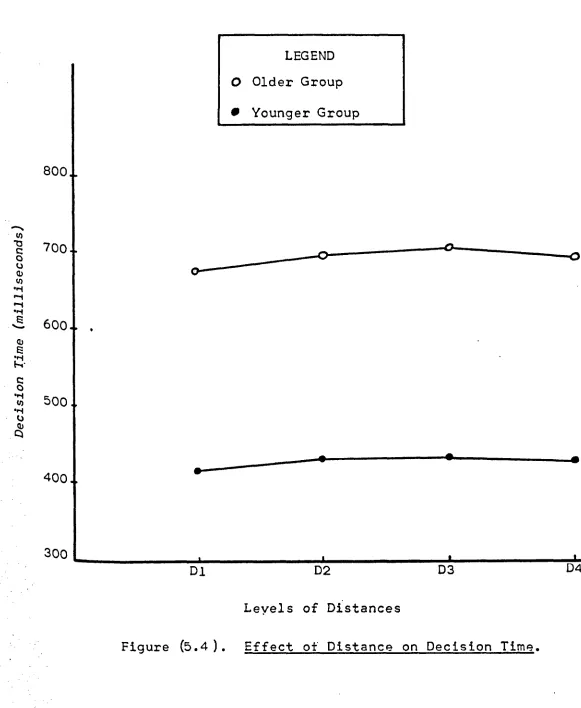
5.4 Effect of distance on decision time 62
5.5 Effect of distance on movement time at different
levels of information load 80
5.6 Effect of distance on movement time at different
levels of clearance 81
x
Page
Figure 5.7 Effect of information load on movement time 82
5.8 Effect of clearance on movement time 83
5.9 Effect of distances on movement time 84
5.10 Effect of index of difficulty on movement time
(all subjects) 99
5.11 Effect of index of difficulty on movement time for
both groups 100
5.12 Effect of information load on performance errors 110
5.13 Effect of information load on heart rate 117
CHAPTER I
INTRODUCTION
The proportion of older people In the Canadian population has increased
over the past decade (Table 1.1). Data from the Canadian census (1971)
Indicates that the proportion of older people [over 50 years old] was
about 21% of the total population in 1971 and the estimated population for
1975 shows an increase to about 23.5%. The change in age composition is due
not as much to any marked extension of the span of life but to a far greater
survival rate during infancy and childhood (Figure 1.1).
Data from Statistics Canada (1978) indicate that workers over 50
years old comprise 19% of the work force in Canada. In industry, older
workers provide many advantages in quality of performance, in steadiness,
in reduced absenteeism, in responsibility and in reduced costly labour
turnover (Heron and Chown 1960; Murrel, et.al, 1957). There are, however,
problems of employment associated with age which begin to make themselves
apparent as early as the late forties. These problems leave no doubt
that industry should take greater account of the need to fit jobs to
older workers and this can be achieved in one of two ways:
1. Reallocation of the worker to another job.
2. Re-design of the job.
The first method (reallocating the worker to another job) appears at
first sight to be an attractive and easy solution; however, it often
involves more expenditure than is generally admitted due to the long
period of 'training and adaptation which is frequently required. At the
same time the transferred worker's output is often lower than normal for a
1
2
Table 1.1 The proportion of older people (over 50 years old) In the
Canadian population, 1921-1971 [taken from Canadian census (1971)1
Year Total population Population of people
over 50 years old %
1921 8,787,949 1,304,274 14.8
1931 10,376,786 1,726,957 16.6
1941 11,506,655 2,273,562 19.8
1951 14,009,429 2,825,771 20.2
1956 16,080,791 3,131,149 19.5
1961 18,238,247 3,543,812 19.5
1966 20,014,880 4,007,504 20.0
1971 21,568,310 4,528,685 21.0
Age
80+ LEGEND
Y//A
W3179 70
1971 60 - 69
50 - 59
40 - 49
39
20 - 29
10
2
6
10
14 18 22 263
considerable length of time and the worker's skills are being under utilized
in a less demanding job. Reallocation also involves considerable upheaval
for the worker himself (Marbach, 1968) since family and other social ties
have often been developed by that age.
The second method is to redesign the job so that the older worker will
be capable of meeting its demands. Job redesign will result in the
reduction of labour turnover among older workers, accidents due to fatigue
and absence due to illness (Griew, 1964). In order to undertake such job
redesign.it is essential to know the effects of ageing on working capacity
and performance, motivational levels,and economic needs of the worker
himself. Experimental and explorative studies are therefore needed to
investigate work performance and motivation and their relationships to age.
Some laboratory studies have been reported concerning several aspects
of ageing industrial workers. Astrand (1960) has shown that ageing reduces
the capacity to perform manual activities for prolonged periods of time.
Bink (1962) has shown that the average capacity for manual work at age 55
is 25% lower than that at 19 years of age. The laboratory results of
Murrell and Griew (1957) reflect the industrial finding that older workers
tend not to be working on the most complex and/or skilled jobs. In a
study of the change in speed of performance with age performed by
Welford (1962), it was shown that older people tend to drop out of work
that makes severe demands for speed and fine visual discrimination.
He inferred that light work requiring a fast rate of operation is less
suitable for people over 50 years of age than is moderately heavy work.
With increased industrialization and improvement of production
equipment and production systems, there is a general increase in light
tasks (e.g. modern electronic control systems) and a decrease in heavy
tasks (e.g. manual material handling). It should be borne in mind that
the human operator of these modern systems has become progressively less
concerned with continuous manual monitoring and more and more concerned
with the interpretation of a large variety of signals for action. These
signals may originate from different sources simultaneously or in rapid
succession and he is always required to exercise his decision making
abilities.
Many studies have been done to investigate the performance of the
worker in such tasks. In most of these studies the subjects were young,
mostly under 30 years old. Some studies on the effect of ageing on
reaction time and movement time have been reported in the psychological
literature (Spirduso, 1975; Simon, 1967; Singleton, 1954; Szafran, 1951)
but none on the study of the interactive effectsof age and the information
content of the task. The present study attempted to investigate these
interactive effectson the decision time, movement time, accuracy of
performance and heart rate of the worker. The objectivesof the study,
the method, the experimental design and procedure, and the results are
5
CHAPTER II
LITERATURE SURVEY
2.1 Introduction
This chapter briefly summarizes the existing studies and serves as a
background to the present study. The work done in the following areas is
presented in this chapter:
(1) Information content and task performance.
(2) Age differences in reaction time.
(3) Age differences in reaction and movement time.
(4) Effect of age on speed and accuracy of movement.
(5) Task performance and heart rate.
2.2 Information Content and Task Performance
Three experiments are reported by Fitts (1954) which were designed
to test the hypothesis that, if the amplitude and tolerance limits of a task
are fixed and the subject is instructed to work at his maximum rate, then
the average duration of response will be directly proportional to the
minimum average amount of information per response demanded by the task
conditions. The three experiments were as follows:
-1. The subjects were asked to tap two rectangular metal plates alternatively
with a stylus for different plate widths and different distances between
plates.
2. The subjects were asked to transfer plastic washers from one pin to
another using different distances between the two pins and different
clearances between the washer and the pin.
3. The third task was to transfer pins from one set of holes to another
6
using different distances between the holes and different clearances
between the hole and the pin.
As a result of these three experiments, Fitts proposed an index of
difficulty of movement on the assumption that the average amplitude, the
average duration, and the amplitude variability of successive movements
are related in a manner suggested by information theory. This index of
difficulty is defined as:
ID - log. ~ (2.1)
W
where W is the tolerance range in inches and A is the average amplitude
of the particular class of movements. The choice of denominator for this
index is arbitrary since the range of possible amplitudes must be inferred.
Fitts also found that movement time was well predicted by the relationship.
MT - a + b • ID (2.2)
where MT is the movement time and a and b are constants.
Welford (1960) has suggested that an improved index of task difficulty
might be;
A + 0.5W ID’ - log2
W
AS
This formulation makes movement time dependent upon Weber's fraction (— ,
S
where AS - a just noticable change and S - physical stimulus magnitude)
in that the subject is called upon to distinguish between the distances to
the far and to the near edges of the target. This suggestion also is
based in part on the observation that this definition reduces the
•numerical value of the first constant, a , in Fitts' equation (2.2), giving
the effect of moving the best fit line from intersecting the movement time
axis at a negative quantity of Intersect at a positive quantity.
Fitts and Peterson (1964) studied the effects of response amplitude
and terminal accuracy on two-choice reaction time and movement time. Six
male subjects, 18 - 25 years of age were used. The subjects' task was to
hold a light weight metal stylus on a small metal starting plate fixed at
a point midway between two signal lights, and when one of the lights came
on, the subject attempted to hit the appropriate one of two alternative
targets as quickly as possible. They found that both the required amplitude
of movement and the width of target had a large and systematic effect on
the movement time, but a relatively small effect on reaction time. Movement
time can be influenced quite independently by (a) the degree of uncertainty
of the stimulus and (b) the degree of uncertainty permitted in executing the
movement (Fitts and Peterson, 1964). These findings support the view that
perceptual processes and motor response are relatively independent, and that
human information processing proceeds by a series of essentially independent
steps (Broadbent, 1958; Welford, 1960).
From information theory, if i is a signal from a message consisting
of a sequence of signals, chosen by a source from a set of statistically
independent signals, and if i has a probability of occurance p^ , then:
Information in signal i = -log2 Pi , which is called the "entropy" of
the source and is measured in bits (Shannon and Weaver, 1949). For N
equally likely stimuli, and no response errors, the entropy
H ■ log2 N bits
which is non-negative, has no upper bound as N increases and is additive.
It is also used as a measure of informational load.
8
Once information has passed through the perceptual stage of processing,
a course of action must be chosen. Decision processes can be examined by
simple reaction time and more directly by choice reaction tasks (Stelmach
and Diewert, 1975).
The term "combined decision and manual task" was used by Sadosky (1969),
for the tasks in which the worker is required to exercise both his manual
dexterity and decision making abilities. Thomas (1971) after studying the
performance time for a combined decision and manual task, concluded that
the decision component of the task might be considered as an isolated entity
and its time a function of the input uncertainty and the movement involved,
Tsui (1977), using a task similar to the one used in the present study,
studied the performance time for ten male and ten female subjects under
four levels of information load and three levels of task difficulty.
He found that index of difficulty and information load were significant
in their effect on performance time, but no differences were observed
between male and female subjects.
2.3 Age Differences in Reaction Time
2.3.1. Simple Reaction Time
The Reaction Time (RT), which traditionally is taken as the period
elapsing between the appearance of a stimulus and the beginning of a
response movement, is also traditionally regarded as a measure of the time
taken by central processes (Welford, 1959). The results of various
psychological studies of simple reaction time have shown that RT tends
9
An experiment by Singleton (1954) showed no difference of age change
in reaction time with different complexities of movement. The subject's
task was to move a lever from one to the other end of an 18 inch slot in
response to a signal light. Each subject performed a number of trials in
which he moved the lever in one direction only and others in which he moved •
it from one end to the other and back.
Conflicting evidence comes from an experiment by Griew (1959) in
which subjects were required to move a stylus over a distance of 8 inches
from a metal disk 1.25 inches in diameter to another metal disk at the
appearance of a signal light. For the younger subjects no consistent increase
was found when the more complex movement was required. The older subjects,
however, took consistent and significantly longer, on the average, to
initiate their responding movement under this condition.
Simon (1967) studied the effect of reversal of right and left ears in
auditory Signal-Response (S-R) correspondence on the reaction time of two
disparate age groups. He found a significant difference in reaction time as
a function of age, sex, and S-R correspondence. Reversal of the S-R relation
ship produces significantly greater slowness for older than for younger subjects
2.3.2. Discrimination and Choice Reaction Time
Research by Hick (1952), Hyman (1953), and Crossman (1953) has
indicated that choice reaction time is roughly proportional to the amount
of information transmitted from the display of signal source to the
responding action. RT, therefore, is linearly related to the logarithm
of the number of equiprobable choices, or their equivalent.
10
Hick's formulation may be expressed as:
RT - K log Ne (2.3)
where
RT ■* Reaction time
Ne “ The effective number of equiprobable choices
K - constant depending on the nature of the
' relationship between the signals and the
responding action required.
Crossman (1955) has shown that a different formulation is required
for the effect of different degrees of discrimination and he suggests
the following formula.
Td - C/(log
X±
- log X 2) (2.4)where T^ ■ Discrimination time
X^, X2 are the quantities being compared (e.g. length of two lines),
and C is constant.
Three experiments by Crossman and Szafran (1956), using a sorting
task, have shown that choice and discrimination time did not increase
proportionately with age, that is, age change cannot be described as an
increase of K or C in equations (2.3) or (2.4).
Fozard (1972) studied the effect of age and socioeconomic status on
two sets of measures of cognitive performance. One set consisted of
12 subsets of the General Aptitude Test Battery; the other was a group
of laboratory-based experiments. He found that it is more difficult for
11
from short term memory, (b) monitor two verbal sequences concurrently,
and (c) initiate a response in two-choice discrimination.
2.4 Age Differences in Reaction and Movement Time
Szafran (1951) tested ten subjects in each age decade from the
twenties to the fifties on an aiming task. The subject sat in the center
of a wooden framework and moved a stylus from a central resting point to
any one of a number of 14-inch targets, with 1-inch metal centers,
distributed on three sides around him. He found that the time taken to
move from the resting point to contact with the target increased slightly
with age, but not significantly, and comparatively less than various
stationary components, such as time of initiating response.
In an experiment conducted by Leonard (1952), the subject’s task
was to move the stylus from the center disk to the outer one corresponding
to the particular light on a display consisting of five lights. He found
that,while all the time components of the task increased with age, there
were indications that the speed decrement was greater for the times on the
center disk and outer disk than it was for the transit time between disks.
Singleton (1954) used a display consisting of four lights arranged
in a square, with one diagonal positioned vertically. The control was a
lever, which could move along four directions from a center point. Each
light signal indicated a direction of movement. He found that until the forties
or fifties, the actual time spent making movement did not increase or
increased little with age. The slowing of performance occurs mainly during
those portions of a task where changes in the direction of movement are
necessary, in other words, in the reaction time. Welford (1959), after
12
discussing the experiment by Singleton, reported that "in such experiments
which required series of reaction time, it is difficult to be sure whether
any lengthening of time is due to processes concerned with the initiation
of a responding movement or with processes which in some way are an
aftermath of a previous movement".
In a study by Tolin and Simon (1968) to investigate the effect of
task complexity and stimulus duration on perceptual-motor performance of
two disparate age groups,it was found that older subjects reacted 30
percent slower and moved 76 percent slower than younger ones. The
subject’s task was to make an unguided movement to the onset of one stimulus
light in a four light display. Two stimulus durations were used, 0.11
second and 2.0 seconds. It was found that both reaction time and movement
time were slower for the complex than for the simple task. Younger subjects
moved faster with the 0.11 second stimulus while older subjects moved
faster with the 2.0 seconds stimulus. The slowness of the older subjects
following the shorter-duration stimulus may be related to unreliability
of short-term memory.
In a study by Spirduso (1975), the subjects were categorized into
young (20-30 years), old (50-70 years) and into whether they were active
sports participants or non-active participants. The results for simple
RT, choice RT and movement time indicate that the active groups were more
co-ordinated than non-active groups and that the younger subjects were
faster than the older subjects. It was also found that the old non-active
group was significantly slower than the other three groups on all three
dependent measures. From these results it may be inferred that a highly
active sports life tends to compensate, to some extent, the normal slowing
2.5 Effect of Age on Speed and Accuracy of Movement
13
Indications of speed and accuracy together were obtained in a
figure-tracing experiment by Brown (see Welford, 1958). He found that subjects up
to the age of thirty maintained speed at the expense of accuracy but from
the forties onward, accuracy was restored at the expense of speed.
Davies (1975), using a task requiring cancellation of letters in a text,
found that older subjects worked significantly more slowly and significantly
less accurately than younger ones. However, noise significantly improved
the rate of work for older subjects but not for younger ones without
impairing accuracy. Older subjects, but not younger ones, also were
significantly more accurate in the afternoon. An interpretation is given
for the previous result by Davies, as follows. Older subjects normally
function at a lower level of arousal than do younger subjects; furthermore,
the relationship between arousal level and performance follows on inverted-U,
performance rising with increasing arousal until it reaches an optimal point
and thereafter declining. Since noise at low intensities and afternoon
testing both raise arousal level, this results in the older subjects, who
are further away from the optimal point initially, approaching it more
closely, their performance thus showing a relatively greater improvement
than that of younger subjects under conditions that increase arousal level.
Many changes in cortical function can be attributed to a slowing of
signal-to-noise ratio in the brain. Older people, however, seem often to
compensate by accumulating data over a longer time, thus strengthening
the signal and averaging out some of the noise, before triggering the
14
decision. This results in slower performance, but avoids an increase of
errors, and in some cases leads to older people being more accurate than
their younger counterparts (Welford, 1976).
2.6 Task Performance and Heart Rate
As a person performs work, either mental or physical, certain
physiological changes take place within the human body. One rather easily
measurable change is the heart rate, which is known to increase above the
"rest" rate as work is performed (Young, 1956). Kalsbeek (1971) suggested
that changes in the variability of the instantaneous heart rate could be
used to indicate changes in mental load. In addition to work load, such
factors as temperature, humidity, impervious clothing, sex, age, state of
nutrition, physical conditions, self consciousness, emotional state,
accumulated fatigue, and training have all been found to affect either
the level of heart rate during exercise or the rate of heart recovery
following exercise (Brouha, 1954, 1962). Heart rate is also affected by
stressors such as drugs, noise, and lack of sleep, and by general
characteristics of the task such as novelty, complexity and the prevailing
intensity of task stimuli (Kahneman, 1973). Time-on-task also has an
effect on the heart rate (Gaillard and Trumbo, 1976; Thackray et al, 1974).
Khare (1976) found that heart rate increased when the information load
increased while reach remained constant and when the magnitude of reach
increased while information load remained constant.
In an experiment by Young (1956), 14 male subjects between the ages
of 23 and 31 served as operators in pumping the handle of an apparatus
15
It was found that the means of the heart rate, taken Immediately following
work,were highly significantly different for each of the three selected
paces, and the correlation coefficient for the relationship between heart
rate immediately following work and the pace used by the operators during
the work ranged from 0.889 and 0.999 for the fourteen operators.
Conflicting results concerning the effect of age have been reported
among those investigators who used heart rate as an index of work capacity.
Robinson (1938) and Yiengest (1953) found higher heart rate in older
subjects than in younger subjects while performing work at fixed levels.
Astrand (1958) also found an increase in heart rate at submaximal work
with increasing age. However, the results of Snook (1965) who reports
no increase in heart rate with increasing age while performing work at
a fixed level suggest to the contrary. Furthermore, Brouha (1962) concluded
that for moderate work, any changes in heart rate with age occur only
under stressful conditions such as hot and humid environment.
2.7 Conelus ions
A review of the literature summarized in this chapter reveals that
most of the previous studies on the effect of age were concerned with
the main effect of age on the performance. In other words, the hypothesis
that with increasing age there is slowing in the performance has been tested.
This is now accepted as fact. Since the problem of ageing is associated
with the problem of employment, there is a need to investigate this slowing
in the performance and the effects of variations in the information content
of the task on this slowness. In other words, it is necessary to investigate
the interactions between age and information content of the task. An
16
appropriate Interpretation of the findings of such studies could then be
transformed into meaningful policies for worker placement and could be
used as a guide for job redesign for older workers and for effective
17
CHAPTER III
THE STUDY
3.1 Objectives of the Present Study
The objectives of the present study are to investigate the effects of
age and information content on performance in a combined decision and
manual task. Only choice-uncertainties are involved and there is no preview
of the stimulus signals. More specifically, the interactive effects between
the above variables will be examined.
The following hypotheses were tested:
(a) With an increase in information load, and the
index of difficulty, both the decision and movement
time components of performance time increase but by
greater amounts for the older group than the younger
group.
(b) The accuracy of performance is higher for the older
group than the younger group.
(c) Increasing the information content of the task has a
greater effect on increasing the heart rate of the
older group than the younger group.
18
3.2 Method
The study was conducted within the Industrial Engineering laboratories
at the University of Windsor. Two groups of subjects participated in
this study. Each subject performed 12 experimental runs on a combined
decision and manual task designed for the purposes of the study. The
criteria for the selection of subjects, the apparatus used in the study
and the different experimental runs are described in the following pages.
3.2.1 Subjects
Two groups of subjects participated in this study:
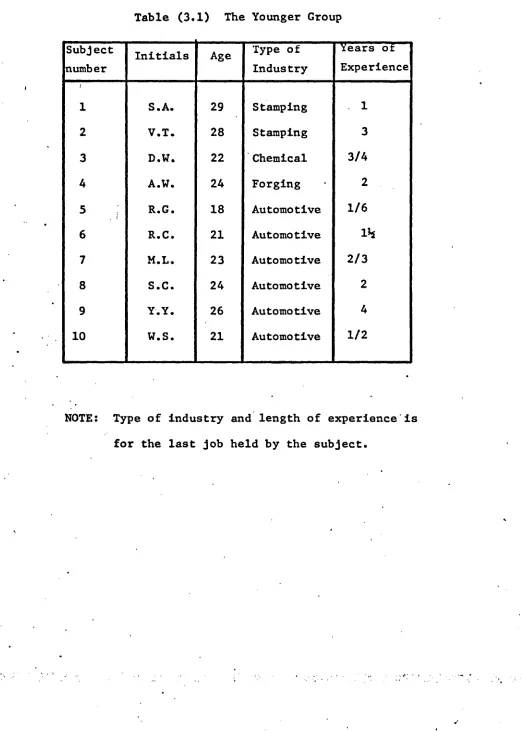
(1) Younger Group
The younger group consisted of 10 male subjects between the ages of
18 and 29 with an average age of 23.5 years. The subjects were chosen
from among industrial workers in the Windsor area. All subjects were
holding jobs in different types of industry but had taken time off to
participate in the study. Table 3.1 summarizes the relevent information.
Each subject was paid for participatirig in the experiment.
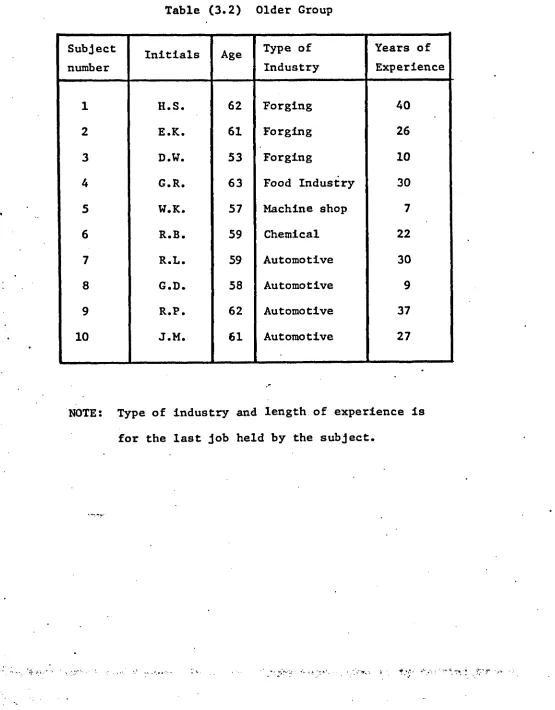
(2) Older Group
The older group consisted of 10 male subjects between the ages of
52 and 63 with an average age of 59.5 years. The subjects were chosen
randomly and with the co-operation of the Canada Manpower Center from
among industrial workers in the Windsor area. The older subjects were
from among the workers who were "between assignments" for a period less
than 6 months and for reasons other than disability. Table 3.2 shows
19
$
All subjects in. both groups were right-handed and in apparent good
health. The purpose of the study was explained to the subjects and they
all appeared to be interested in participating.
Table (3.1) The Younger Group
Subject
number
Initials Age Type of
Industry
Vear8 of
Experience
1 S.A. 29 Stamping 1
2 V.T. 28 Stamping 3
3 D.W. 22 Chemical 3/4
4 A.W. 24 Forging 2
5 . i
R.G. 18 Automotive 1/6
6 R.C. 21 Automotive
lh
7 M.L. 23 Automotive 2/3
8 S.C. 24 Automotive 2
9 Y.Y. 26 Automotive 4
10 W.S. 21 Automotive 1/2
NOTE: Type of Industry and length of experience'Is
Table (3.2) Older Group
Subject
number
Initials Age Type of
Industry
Years of
Experience
1 H.S. 62 Forging 40
2 E.K. 61 Forging 26
3 D.W. 53 Forging 10
4 G.R. 63 Food Industry 30
5 W.K. 57 Machine shop 7
6 R.B. 59 Chemical 22
7 R.L. 59 Automotive 30
8 G.D. 58 Automotive 9
9 R.P. 62 Automotive 37
10 J.H. 61 Automotive 27
NOTE: Type of Industry and length of experience is
for the last job held by the subject.
I 22
3.2.2 Apparatus
The experimental apparatus consisted of the following units
(Figure 3.1):
(a) Signal-Response Unit (S-R)
(b) Tape Reader Unit
(c) Time Measuring and Recording Unit
(d) Heart Rate Recording Unit.
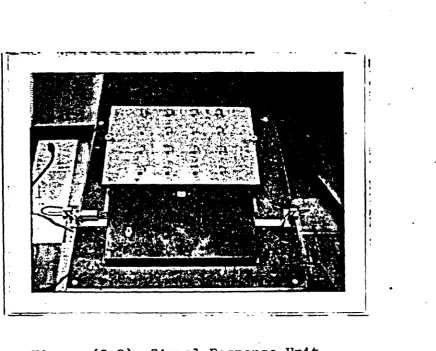
(a) Signal Response Unit
A special S-R unit (Figures 3.2 and 3.4) was used in this study (Tsuif
. 1977). The task consisted of the subjects* grasping the pin, 0.625" of
which rested above the surface of the work board. The system had been so
designed that, as soon as the pin is lifted from its resting position,
a number on the light emitted diode (LED) screen would appear to indicate
the hole number into which the pin should be dropped (see Figure 3.2 also
Tsui, 1977). The subject would look at this number on the LED screen and
in one sweep reach for the hole, position and drop the pin. This constituted
a task cycle which was then repeated.
The S-R unit consisted of the following components:
’ (a.l) The Pin System
The pin system as shown in Figure 3.5 consists of six cylindrical
metal pins, each 0.25" in diameter and 1.25" long. Only one pin stands
in the pin pocket with half of its length appearing above the surface of
. the work board. The pin system is designed such that as the pin is removed
from the pin-pocket, another pin appears to take its position. When it is
I
23
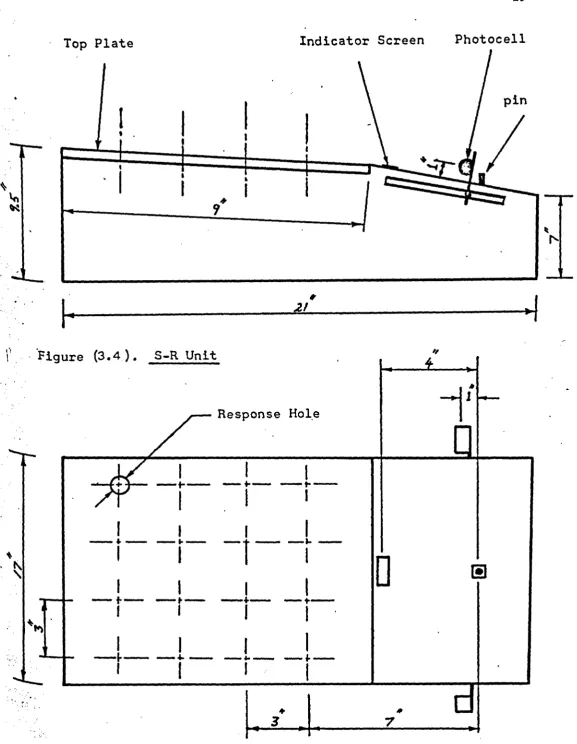
(a. 2) The Response Top Plate
The S-R unit was designed such that the response top plate is inter
changeable. There are A plates, each having 16 holes of equal size arranged
in a AxA matrix, but each plate has a different hole size. The four
different hole sizes are 0.258", 0.313", 0.5" and 1" in diameter.
Numbers 1 to 15 and number 0 were labelled above the sixteen holes
and the arrangement of these numbers was the'same on the four plates.
Number 0 was used instead of 16, because it was within the range of the
BCD signals used by the tape reader. This facilitated the making of the
random number tape. The dimensions and the hole arrangements of the
response plate are as in Figure 3.A.
(a.3) The Signal Indicator
The random numeric signal is transmitted from the tape reader and
displayed onto a rectangular screen (1 inch by 0.75"), located A inches
above the pin-pocket (see Figure 3.A). The number appears only on the
screen as the subject grasps and lifts the pin from the pin-pocket. The
number continues to be displayed until the removed pin has been dropped
into the specified hole, If, in error, the removed pin is positioned
into a wrong hole, the number on the screen remains displayed until a
following pin is grasped, removed and positioned into the correct hole.
This feature allowed an easy identification of errors of positioning.
(a.A) The Photocell System
As shown in Figure 3.A an adjustable photocell system was developed
in order to measure the time between occurrence of stimulus (grasping
and lifting the pin and thus triggering the numeric display) and Initiation
24
of movement (crossing the photocell beam) toward the specified hole. The
"holding time" before starting the positioning movement was thus taken to
be the decision time. The photocell system was adjusted and fixed such
that the photocell beam was at a height of 1 inch from the surface of
the S-R unit and at a distance of 1 inch (horizontal) from the pin-pocket.
It was found that this position for the photocell beam was the closest
position to the pin-pocket which insured no interference between the
subject's hand and the beam while grasping the pin. At the same time
this position eliminated the possibility of interrupting the beam during
the positioning movement.
*
(b) Tape Reader Unit
The tape reader unit (Figure 3.3) consisted of the random number
.tape and the tape reader. The tape reader reads the programmed tape and
sends signals to the S-R unit. This appears in the form.of a random
number on the LED screen. The random number tape is a standard computer
paper tape punched on a teletype punching machine using the IBM BCD system
code. Three tapes were prepared for the 4, 8 and 16 hole tasks, with
equal probability of occurrence of each number in each set.
(c) Time Measuring and Recording Unit
This unit (Figure 3.3) consisted of two time counters and a DIGITEC
paper tape punch unit. The first time counter was for measuring the time
between the appearance of the stimulus (grasping and lifting the pin) and
initiation of movement (crossing the photocell beam). This represented
the decision time. The second time counter was for measuring the total time
(performance time)'measured-between the appearance of the stimulus and the
25
The output measures, that Is performance time, decision time (both in
milliseconds) and the hole number were punched on a paper tape. This tape
was then converted into computer cards for the analysis.
(d) Heart Rate Recording Units
In order to record the heart rate, Model 7 P6 EKG pre-amplifier,
connected to a Grass model 7 polygraph, was used. The amplifier was
connected to the subject through three electrodes applied to the subject's
chest and the heart beats were recorded on Grass recording paper (see
Figure 3.1).
\
27
F i g u r e (3.2)
S i g n a l - R e s p o n s e Unit
28
WA’
r y ^ ’-gyy
l-iZCS*. .■»."
NH > 11!
M
f.VTw ,
«
.'.'jyi'wwi
•
F i g u r e (3.3)
T i m e Measuring, R e c o r d i n g
7
7
29
Photocell
Indicator Screen
Top Plate
pin
Zf
Figure (3.4 ).
S-R Unit
Response Hole
t —
Reproduced with permission o f B e copyright owner. Further reproduction prohibited without
30
t
F
i
g
u
r
e
(3
.
5
)
.
Pi
n
Sy
31
3.2.3 Experimental Runs
The Information, content of the task was varied by using 3 different
levels of Information load (H) and 4 levels of clearance (C) between the
pin and the response hole as follows:
Cl) Information load:
Level Number of Holes H ■ log2 N bits
H2 4 2
I
H3 8 3
H4 16 4
(11) Clearance: _
Cl - 0.75"
C2 - 0.25"
' „ C3 - 0.063"
C4 - 0.008"
The combination between the 3 levels of H and the 4 levels of C
formed the 12 experimental runs as shown in table 3.3.
Table (3.3) Experimental Runs
Order of
the run
Level of
C
Level of
H
1 Cl H2
2 Cl H3
3 Cl HA
A
! C2 H2
5 C2 H3
6 C2 HA
7 C3 H2
8 C3 H3
9 C3 HA
10 CA H2
11 CA H3
33
CHAPTER IV
EXPERIMENTAL DESIGN
4.1 Experimental Models
Introduction:
In order to test the hypotheses In the present study, the following
models were developed.
1. Decision time models.
2. Movement time models.
3. Performance errors model.
4. Heart rate model.
For both decision and movement time, two models each were
developed. In the first model, the two elements of task difficulty, i.e.
clearance and distance, were considered as separate independent variables
in the model. In the second model, the two elements were.combined into
one term (index of difficulty ID) using Fitt's formula as explained
earlier (Equation 2.1).
Decision time, movement time, performance errors and heart rate are
defined as follows:
(a) Decision time:
This is defined as the time elapsed between the appearance of the
stimulus and the beginning of the responding movement (Broadbent, 1958). It consists of:
(i) Occurrence of stimulus.
(ii) Detection of stimulus.
Ciii) Decision.
(iv) Selection of response. . \“
34
(b) Movement time:
This Is defined as the time elapsed between the beginning of the
responding movement to the completion of the movement.
(c) Performance errors:
There is only one type of performance error in this task, i.e.
positioning the pin in the wrong hole. This error is presented as a
percentage by dividing the number of errors by the total number of cycles
in each experimental run.
(d) Heart rate:
35
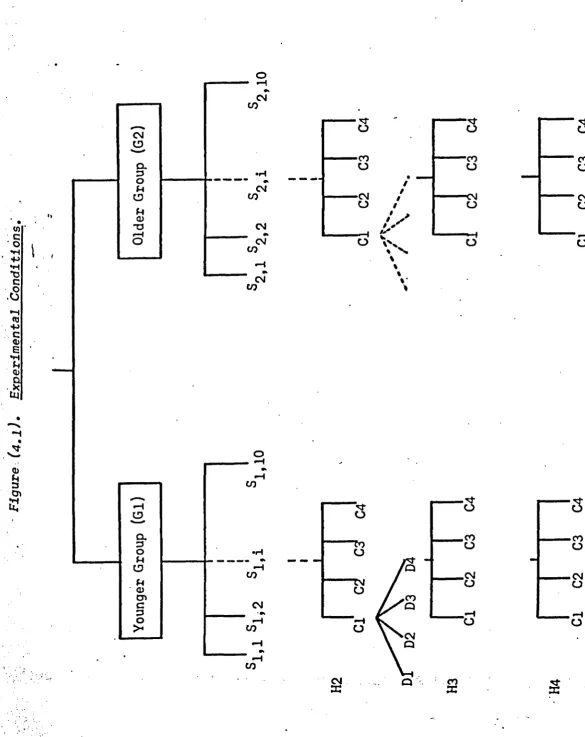
A.1.1 Decision Time Models
Cl) First Model
A 2 x 1 0 x 3 x 4 x 4 mixed model, with both nesting and crossing
arrangement was used to test the main effects and the interactive effects
of the following factors on the decision time (see Figure 4.1).
(1) Age differences, G (fixed)
Two levels of age differences were used:
— First level, younger group (Gl), was subjects with
age between 18 and 29 years.
— Second level, older group (G2), was subjects with
age between 52 and 63 years.
(2) Subjects, S • (random)
Ten subjects in each age level participated in the study.
Subjects were nested within the levels of factor (G).
(3) Information load, H (fixed)
Three levels of information load were used:
*-■
.....-.I
C*; Number of holes (N) H “ log, N bits— First level (H2)
— Second level (H3)
— Third level (H4)
Studies by Scholes (1970) and Raouf and El-Sayed (1975) have Indicated
that small angular differences in the narrow region had negligible effects
on performance time, and that the cross body movements had no effect on
the performance time at any level of information load, distance and
direction.
4
8
16
2
3
4
In light of the above findings, the different levels of information
load are presented as follows:
•
The first level (H2) was represented by holes numbered 3 f 7, 11 and
15; the second level (113) by holes n u m b e r e d ‘2, 3, 6, 7, 10, 11, 14 and
15; and the third level by using all 16 holes (Figures 4.2a and b). Special
covers for the top plate of the S-R unit were designed and used for this
purpose (see Figures 4.4a, b and c).
(4) Clearance, C (Fixed)
Four levels of clearance between the pin and the response
hole were used:
Cl - 0.75"
C2 - 0.25"
C3 - 0.063"
C4 - 0.008"
(5) Distance, D (Fixed)
Four levels of distances between the pin-pocket and the
response holes were used (Figure 4.3):
D1 - 7"
D2 - 10"
D3 - 13"
F
i
g
u
r
e
(
4
.
1
).
E
x
p
e
r
i
m
e
n
t
a
l
C
o
n
d
i
t
i
o
n
s
.
37
•'3-o
•co o
•CM
O
O
CO
/
f
■CM
O
CO
CM
z
3
O
o
£
7
o
o
/
«
//o
o
!*
15
o
o
Figure (4. 2a)
R e s p o n s e Holes for the
Second Level of Information
Load. (H 3 ).
--- 1
L-Figure (4. 2b)
R e s p o n s e Holes for the
39
T o p P late
R e s p o n s e Hole
i
i
P i n
L‘
Figure
(4.3).
The D i f f e r e n t L e v e l s of D i s t a n c e s (D).
41
The Model
The model I s :
Yijk£m " y + a i + Pj(i) + Yk +
+
9m+ aY±k + a61£ +
. . . .
+ eYjk(i) + e<Sjil(i) + 60jm(i)
+ aY<Sik£ + * * ' •
+ eY<SjkJl(l) + • ’ * *
+
3Y<S0jkHm(l) + e (ijk£m) (4,1)where y « general mean.
■ main effect of age.
1 - 1, 2
“ Subjects nested within age.
j " 1 ... 10
Yk - main effect of information load.
k - 1, 2, 3
6
£
■ main effect of clearance.£ * 1 , . . . , 4 .
0 « main effect of distance.
m
in * 1 1 • • • i A •
e (ljk!m) * " e q u a l s .
Y... . ■ The mean decision time of the 40 observations for the ijkJcm
m ^ level of distances, £C^ level of clearance, k ^ level
tti £h
N o t e : In the above model, since all the main effects and all the
Interaction terms were included, there are no degrees of
freedom left for the error term and the test of the main
effects and the interactions were done using the interactions
with the random factor (subjects) as an error term as explained
in the next chapter.
(ii) Second Model
This is essentially the same as the first model except that the two
factors, i.e. the clearance and the distance were combined into the index
of difficulty term, using Fitts' formula (Table 4.1).
The Model
The second model of the decision time using the index of difficulty
as an independent variable is:
+
“ Ylk + “n lp + Ynkp
+ SYJk(1)
+ BnJp(1)
Jkp(i) T (Ijkp)
main effect of the index of difficulty
(4.2)
p ■ 1, ..., 16
Y. the mean decision time of the 40 observations of the
p C^ index of difficulty,
. . th
and i age group, y , a , i3 and Y are the same as
information load, j**1 subject
the first model