Optimizing Graph Mining Attributes based
Inference for Social Network Analysis
Prof. Priyanka Shah, Dr. Richa Mehta
Assistant Professor, Dept. of B.C.A., BPCCS College, KSV University, Gandhinagar, Gujarat, India
Assistant Professor, Dept. of B.C.A., BPCCS College, KSV University, Gandhinagar, Gujarat, India
ABSTRACT: Graph mining is method of analysing and extracting useful knowledge to understand the relationships and content from structured data which is represented in graph. The research work focuses on proposing a methodology for multiple standard attributes of graph mining that can be considered to derive accurate and precise outcomes. In this research work, standard attributes were studied and further categorized based on the significance. The Graph Mining attributes are categorized into two phases-basic functionalities and implementation functionalities, on the basis of Graph Mining implementation FOSS to get specific Graph mining knowledge outcome. Researcher implement all attributes using FOSS- Gephi, SocNetV, yEd and Cytoscape tools. Researcher analysis all results obtained from attribute oriented comparative analysis which is based on supported input file formats, supported graph features. Researcher uses denotation to measure comparative analysis of SNAV tools based on attributes. Researcher derived optimization inferences from result analysis.
KEYWORDS: Graph Mining, Social Network, Social Network Analysis, Graph Attributes
I.INTRODUCTION
Nowadays Graphs are very important data structure in modelling complicated structure and their relations. It grows to be progressively more important in modeling complex structures, such as social networks, chemical compounds, circuits, images, work flows, protein structures, biological networks, the Web, and XML documents.[1]
Different graph mining algorithms in various areas have been developed to analyse the large amounts of graph data. In a graph, there are different patterns kinds of patterns may occur. From these patterns, it is required to discover that pattern which occurred frequently from large set of graph [2]. It provides to characterise the graph sets, select different group of graphs, classify the graph, cluster the graph, etc. Several graph mining algorithms are developed to achieve given tasks: Various Graph Mining Algorithms are mentioned below:
Pattern Mining in Graphs : The problem of frequent pattern mining has been widely studied in the context of mining
transactional data. [3] The problem from pattern mining can be defined in different ways depending upon the
application domain: In the first case, To determine all patterns that support a fraction of corresponding graphs form group of graphs. In the second case, we have a single large graph, and we wish to determine all patterns which are supported at least a certain number of times in this large graph [4].
Clustering Algorithms for Graph Data: Graph data can be clustered based on their structural behaviour. This is a big challenge to match the structure from underlying graphs and use these structures for clustering purpose. Two algorithms are developed for clustering graph data:
Node Clustering Algorithms: In this clustering algorithm, we create a cluster based on node with the use of distance value on the edges.[5]
II. RELATED WORK
Social network analysis studies the relation between different nodes and investigates social structures through the use network and graph theories. As Social networking data is growing quickly, social network analysis and visualisation tools are main necessity. It is also difficult and time consuming to analysis and visualises large and massive graph data. Social network analysis involves different tasks like centrality analysis, community detection, position or role analysis, network modelling, network classification and link prediction. SNA tools are powerful and extensible to analyse and visualise large set of graph data. Different Social network analysis and visualisation tools are available. Each tool has its own powerful and excellent functionalities. The Comparative study of different tools focuses on three main approaches: graph visualisation, computations of various indicators, community detection. In first approach, Visualisation is one of the best feature through which we easily understand the graph data. In visualisation, Social network analysis tools change the size, layouts, colours, size and other properties of network representation. In second approach, SNA tools provide facility to calculate different graph indicator or graph feature like centrality, diameter, density, closeness centrality, betweenness centrality, degree centrality, average shortest path, page rank and triad census. In third approach, community detection detects the group of nodes from huge graph. These groups of nodes are called clustering. For graph visualisation, stand alone software is very helpful. For getting rich set of functionalities, commercial software is useful. [7] Gephi tool provides user friendly layout but it cannot handle large and complex graph. igraph and NetworkX tools provides different layouts. Various tools can support different file formats. From this, igraph tool supports almost all types file formats. NetworkX and igraph tools support most of all graph features. There is only one tool-NetworkX in which approximation can be calculated. Only igraph tool provides cohesion feature. Only Pajek tool provides facility to compute partition. Igraph tool provides fastest result to execute all graph features. [8] The problem undertaken is to compare which social network analysis and visualization tool performs best in terms of accuracy and retrieval of results with relevant features of social network analysis. Social network analysis task includes finding various standard attributes for the social network analysis, discovering the structure of social network, finding communities, analysis and visualize social network.
III.PROPOSEDWORK
The research work focuses on proposing a methodology for multiple standard attributes of Graph Mining that can be considered to derive accurate and precise outcomes of Social Network Analysis (SNA). There are various social network analysis and visualization FOSSs are available.
Stage 1: Standard Attributes Selection.
Stage 2: Measuring Selected Attributes Significance
Stage 3: Two-Phase Experimental Execution availing Free and Open Source Software (FOSS)
Stage 4: Attribute Oriented Comparative Analysis
Stage 5: Deriving Optimisation Inferences
Description of the Proposed Work:
The above stages implementation is elaborated in Implementation Methodology section.
Step 1: Standard Attributes Selection:
The research work focuses on different attributes of graph mining for social network analysis and visualization FOSSs. Any social network has attributes like main functionality, attribute handling, input formats, output format, platform, license, language, cost, supported no of edges, supported no of nodes, memory usage, centrality, supported graph layouts, supported network types, diameter, clustering coefficient, community detection, visualization layouts, density, cliques, triad census, page rank etc. All attributes are very important and efficient.
Step 2: Measuring Selected Attributes Significance:
In stage 2, the importance of each attributes is measured on the basis of accurate and precise outcomes.Graph
Mining has the below detailed functionalities that will be measured on the basis of its significance to derive the required knowledge outcome by availing FOSS as well as some Graph mining core functionalities.
Step 3:Two-Phase Experimental Execution availing Free and Open Source Software (FOSS)
Two-Phase Experimental Execution of Social Network Graphical Data is performed availing FOSS. The
basic functionalities and second phase is based on implementation functionalities based on graph features of FOSS Tools- Gephi, SocNetV, Cytoscape, yEd.
Gephi is an interactive visualization and exploration platform for all kinds of networks and complex systems, dynamic and hierarchical graphs. It runs on Windows, Linux and Mac OS X. Gephi is open-source and free. It supports all types of networks – directed, undirected and mixed, and is capable of handling very large network graphs of up to one million nodes. Various metrics are supported including betweenness, closeness, diameter, clustering coefficient, average shortest path, pagerank and HITS. Dynamic filtering allows edges and/or nodes to be selected based on network structure or data. Ideal for social network analysis, link analysis and biological network analysis. Perhaps the most advanced of the open source tools.[9]
Social Networks Visualizer (SocNetV) is a cross-platform, user-friendly tool for the analysis and visualization of Social Networks. It lets you construct networks (mathematical graphs) with a few clicks on a virtual canvas, or load networks of various formats (GraphML, GraphViz, Adjacency,Pajek, UCINET, etc). Also, SocNetV enables you to modify the social networks, analyse their social and mathematical properties and apply visualization layouts for relevant presentation[10]
Cytoscape is an open source software platform for visualizing complex networks and integrating these with any type of attribute data. A lot of Apps are available for various kinds of problem domains, including bioinformatics, social network analysis, and semantic web.[11]
yEd: yEd is a powerful desktop application that can be used to quickly and effectively generate high-quality diagrams.Create diagrams manually, or import your external data for analysis. Our automatic layout algorithms arrange even large data sets with just the press of a button. yEd is freely available and runs on all major platforms: Windows, Unix/Linux, and Mac OS X.[12]
Stage 4: Attribute Oriented Comparative Analysis
After measuring each attribute in different FOSSs, researcher analysis the result. Phase-wise Attribute Oriented Comparative Analysis of social network analysis and visualization in performed based on a count measuring scale. First phase is based on basic functionalities and second phase is based on implementation functionalities based on graph features. For better analysis, researcher makes different tables based its basic functionalities, supported input file formats, supported network types, supported graph layouts, supported graph features by each FOSS. Researcher also analysis which FOSS takes how much time to execute particular attribute.
Stage 5: Deriving Optimization Inferences
From the computations of the count of supported features, it is easier to find out the FOSS that supports more input file formats, more network types, support maximum graph features as well as is best for handling different graph layouts. Researcher also finds the conclusion that which FOSS takes how much computation time to find out particular feature.
VI.EXPERIMENTALRESULTS
In the research work, two-phase experimental execution is performed on classified attributes measured availing FOSS like Gephi, SocNetV, Cytoscape and yEd and outcomes obtained are elaborated as below.
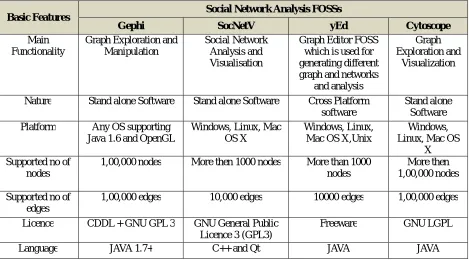
Phase 1: Basic Functionality governing Attributes Execution
Table.1.1: Basic Functionalities governing Attributes
Basic Features Social Network Analysis FOSSs
Gephi SocNetV yEd Cytoscope
Main Functionality
Graph Exploration and Manipulation
Social Network Analysis and Visualisation
Graph Editor FOSS which is used for generating different graph and networks
and analysis
Graph Exploration and
Visualization
Nature Stand alone Software Stand alone Software Cross Platform
software
Stand alone Software
Platform Any OS supporting
Java 1.6 and OpenGL
Windows, Linux, Mac OS X
Windows, Linux, Mac OS X,Unix
Windows, Linux, Mac OS
X Supported no of
nodes
1,00,000 nodes More then 1000 nodes More than 1000
nodes
More then 1,00,000 nodes
Supported no of edges
1,00,000 edges 10,000 edges 10000 edges 1,00,000 edges
Licence CDDL + GNU GPL 3 GNU General Public
Licence 3 (GPL3)
Freeware GNU LGPL
Language JAVA 1.7+ C++ and Qt JAVA JAVA
Phase 2: Implementation Functionalities governing Attributes Execution
The dataset used for the implementation is airlines.gml that was converted into airlines.graphml a common file format that can be used in Gehhi, SocNetV, Cytoscape, and yEd file. The graphical data has 235 nodes and 2594 edges. The Phase 2 implementation is based on the below mentioned criteria.
Criteria 2.1: Core Graph Attributes Criteria 2.2: Supported File Formats Criteria 2.3: Execution Time
Criteria 2.1: Core Graph Attributes
There are different graph features through which we can analyze the graph. Each Social Network Analysis FOSS provides different graph features. Following table 1.2 shows that particular FOSS support that feature or not. If a FOSS supports it then the value of that cell is 1, if a FOSS does not support then the value of that cell is 0.
Table 1.2: Supported Core Graph Attributes
Graph Features Social Network Analysis FOSSs
Gephi SocNetV yEd Cytoscope
CENTRALITY 1 1 1 1
DEGREE CENTRALITY 1 1 0 1
CLOSENESS CENTRALITY 1 1 1 1
BETWEENESS CENTRALITY 1 1 1 0
CLIQUES 0 1 0 0
PAGE RANK 1 1 0 0
DENSITY 1 0 0 1
TRID CENSUS 0 1 0 0
CLUSTERING COEFFICIENT 1 1 0 1
RADIUS 1 0 0 1
AVG. PATH LENGTH 1 1 0 1
MODULARITY 1 0 0 0
FILTERING 1 0 0 0
COUNT 12 10 3 8
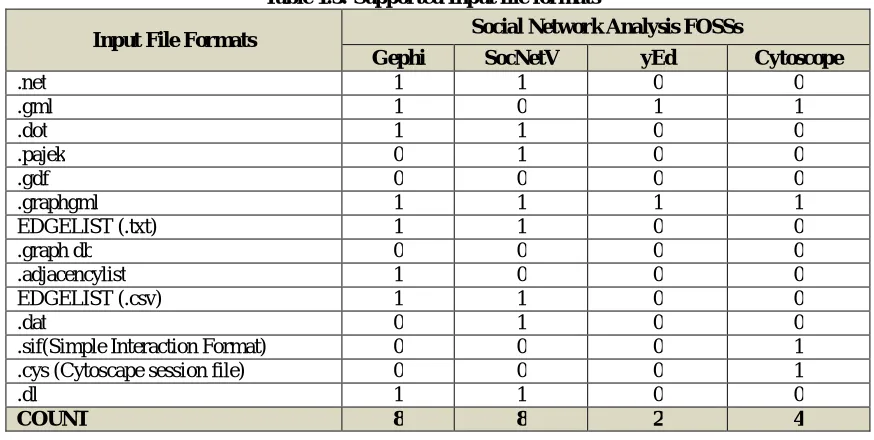
Criteria 2.2: Supported File Formats
In the, different Social Networks Analysis FOSS can support different input file formats. Following table lists all standard input formats of graph as shown on Table 1.3 where Gephi and SocNetVs provide maximum input file formats.
Table 1.3: Supported Input file formats
Input File Formats Social Network Analysis FOSSs
Gephi SocNetV yEd Cytoscope
.net 1 1 0 0
.gml 1 0 1 1
.dot 1 1 0 0
.pajek 0 1 0 0
.gdf 0 0 0 0
.graphgml 1 1 1 1
EDGELIST (.txt) 1 1 0 0
.graph db 0 0 0 0
.adjacencylist 1 0 0 0
EDGELIST (.csv) 1 1 0 0
.dat 0 1 0 0
.sif(Simple Interaction Format) 0 0 0 1
.cys (Cytoscape session file) 0 0 0 1
.dl 1 1 0 0
COUNT 8 8 2 4
Criteria 2.3: Execution Time
After measuring each attributes in different FOSSs, researcher also find out the execution time to calculate various features by different SNA FOSSs. The Execution of core attribute is noted for each SNA FOSS and is mentioned in the Table 1.4
Table 1.4: Execution Time
Graph Features
Social Network Analysis and Visualization FOSSs
Gephi ScoNetV yEd Cytoscape
Load Time 8 seconds 7 seconds 5 seconds 5 seconds
Diameter 4 seconds 7 seconds Not supported 3 seconds
Average Path Length 3 seconds 5 seconds Not supported 3 seconds
Clustering Coefficient 4 seconds 4 seconds Not supported 6 seconds
Average Degree 4 seconds 3 seconds Not supported 3 seconds
Page Rank 6 seconds 2 seconds Not supported Not supported
Cliques Not supported 16 seconds Not supported Not supported
Triad Census Not supported 34 seconds Not supported Not supported
Degree Centrality 4 seconds 2 seconds 4 seconds 3 seconds
Circular Layout Loading Time 3 seconds 2 seconds 4 seconds 3 seconds
Modularity 6 seconds Not supported Not supported Not supported
Data Filtering Loading Time (Degree)
3 seconds 2 seconds Not supported Not supported
Force Atlas Layout Loading Time 28 seconds Not supported Not supported Not supported
Average Execution Time 6.5 seconds 7.58 seconds 3.71 seconds 4.33 seconds
V. RESULT ANALYSIS
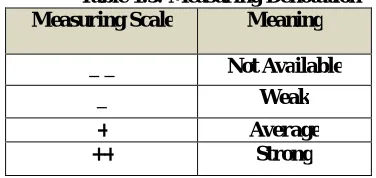
The result analysis is considered as a part of Stage 4: Attribute Oriented Comparative Analysis as mentioned in the Proposed Work. In this phase, for the result analysis, Researcher has used measuring denotation to derive the result
outcomes for Comparative Analysis. The depth Analysis of SNAV in performed based on a count measuring scale as
shown in Table 1.5. The “- -“ denotation indicates that in the SNA FOSS particular Phase Functionalities is Not Available whereas, “-“ denotation indicates that SNA tool is Weak to perform the particular Phase Functionalities. The third “+” denotation indicates that SNA FOSS gives Average performance to perform the particular Phase Functionalities while the fourth “++” denotation indicates that the SNA FOSS is Strong to handle particular Phase Functionalities.
Table 1.5: Measuring Denotation Measuring Scale Meaning
_ _ Not Available
_ Weak
+ Average ++ Strong
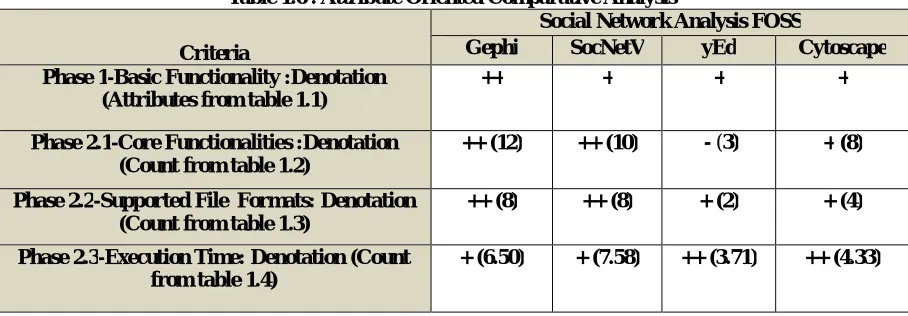
Availing the above Measuring Denotations and referring the Implementation outcomes of Stage 3 the Attribute
Table 1.6 : Attribute Oriented Comparative Analysis
Criteria
Social Network Analysis FOSS
Gephi SocNetV yEd Cytoscape Phase 1-Basic Functionality :Denotation
(Attributes from table 1.1)
++ + + +
Phase 2.1-Core Functionalities :Denotation (Count from table 1.2)
++ (12) ++ (10) - (3) + (8)
Phase 2.2-Supported File Formats: Denotation (Count from table 1.3)
++ (8) ++ (8) + (2) + (4)
Phase 2.3-Execution Time: Denotation (Count from table 1.4)
+ (6.50) + (7.58) ++ (3.71) ++ (4.33)
Above Table 1.6 displays Phase Wise – Attributes oriented Comparative Analysis of different SNA FOSS. Gephi is in the Strong category to provide Phase 1 Functionalities that are based on Basic functionalities because it can run on any Operating System and supports maximum Number of Nodes compare to other FOSS. Gephi and SocnetV gets Strong denotation to provide Core functionalities of Social Networks that are based on Graph attributes. Gephi, SocNetV and Cytoscape provide Average denotation to support network types because they can support only one and two mode Network Types. yEd is Strong to support graph layouts. It supports maximum no of graph layouts. Gephi and SocNetV tools can support maximum no of file formats. In the matter of execution time, yEd and Cytoscape tools perform less features compare to Gephi and SocNetV tools, but computation speed of yEd and Cytoscape tool is minimum to execute graph feature.
VI.CONCLUSIONANDFUTUREWORK
Different Social Analysis and Visualization tools give quantitative and qualitative analysis of social networks. It is very clear that all SNA tools are differing from each other in multiple aspects. These tools give interesting results for calculating network matrices and statistics. All these tools can run on Windows, Mac OS X and Linux operating system. All these tools are stand alone software that are very useful for graph visualization and data format conversion. Gephi and SocNetV tools can handle most of all input file formats. Gephi tool provides maximum features of graph that are centrality, degree centrality, closeness centrality, betweeness centrality, pagerank, density, and diameter. It is not possible to calculate cliques and triad census in Gephi tool. SocNetV tool gives excellent to calculate graph features. This tool analysis each and every vertex very deeply and display outcome in summarized manner. Cytoscape tool provides less graph features compare to Gephi and SocNetV tools. Average execution time of Cytoscape tool is faster than others. The Graph Mining Analyst Professional can avail the optimized Graph Mining Attributes based Inference for Social Network Analysis and Visualization for the accurate and precise outcomes of Graph Mining Knowledge Discovery and to resolve any specific Graph Mining and Visualization research work.
REFERENCES
1. H. Charu C.Aggarwal, "GRAPH DATA MANAGEMENT AND MINING: A SURVEYOF ALGORITHMSANDAPPLICATIONS," in Springer Science, 2010
2. T. W. H. M. A. Inokuchi, " An Apriori-based Algorithm for Mining Frequent Substructures from Graph Dat," in PKDD Conference, pp. 13–23, 2000.
3. M. Vedanayaki*,''Graph Mining Techniques,Tools and Issues-A study”,Department of Mathematics,Amet University ,Kanthur,Chennai -603 112,Vol 7(S7),pp.188-190,2014
4. Ioana-Alexandra APOSTOLATO,''An Overveiw of Software Applications for Social Network Analysis”,Department of Sociology University of Bucharest,Vol-3,Issue-3,pp.71-77, 2013.
5. C. L. E. E.-Z. a. M. G. David Combe, "A comparative study of social network analysis and tools," International Workshop on Web Intelligence and Visual Enterprises 2, pp. 1-12, 2010
7. Nasrin Jokar, Ali Reza et. al “The review of social networks analysis tools Department of Electrical and Computer Engeering,Safashahr Branch,Islamic Azad university,Safashahr,Iran,Vol.85,pp. 329-339,2016,
8. Hemant Agrawal,Ajay Thakur,Rajan slathia,Sumangali K*,''A Comapritive Analysis of Social Networking Analysis Tools”,School of information technology and Engineering,VIT University Vellore,Tamilnadu,632014,India,vol-5,2015.
9. [Online]. Available: https://gephi.org/
10. [Online]. Available: http://socnetv.sourceforge.net/ 11. [Online]. Available: http://www.cytoscape.org/