University of Windsor University of Windsor
Scholarship at UWindsor
Scholarship at UWindsor
Electronic Theses and Dissertations Theses, Dissertations, and Major Papers
10-5-2017
Real-Time Implementation of Spectrum Sensing Techniques in
Real-Time Implementation of Spectrum Sensing Techniques in
Cognitive Radios
Cognitive Radios
Arooj Fatima University of Windsor
Follow this and additional works at: https://scholar.uwindsor.ca/etd
Recommended Citation Recommended Citation
Fatima, Arooj, "Real-Time Implementation of Spectrum Sensing Techniques in Cognitive Radios" (2017). Electronic Theses and Dissertations. 7255.
https://scholar.uwindsor.ca/etd/7255
This online database contains the full-text of PhD dissertations and Masters’ theses of University of Windsor students from 1954 forward. These documents are made available for personal study and research purposes only, in accordance with the Canadian Copyright Act and the Creative Commons license—CC BY-NC-ND (Attribution, Non-Commercial, No Derivative Works). Under this license, works must always be attributed to the copyright holder (original author), cannot be used for any commercial purposes, and may not be altered. Any other use would require the permission of the copyright holder. Students may inquire about withdrawing their dissertation and/or thesis from this database. For additional inquiries, please contact the repository administrator via email
Real-Time Implementation of Spectrum
Sensing Techniques in Cognitive Radios
by
Arooj Fatima
A Thesis
Submitted to the Faculty of Graduate Studies
through the Department of Electrical and Computer Engineering
in Partial Fulfillment of the Requirements for
the Degree of Master of Applied Science
at the University of Windsor
Windsor, Ontario, Canada
2017
c
Real-Time Implementation of Spectrum Sensing Techniques in
Cognitive Radios
by
Arooj Fatima
APPROVED BY:
A. Jaekel
School of Computer Science
E. Abdel-Raheem
Department of Electrical and Computer Engineering
K. Tepe, Advisor
Department of Electrical and Computer Engineering
Declaration of Co-Authorship and Previous
Publication
I.
Co-Authorship
I hereby declare that this thesis incorporates material that is result of joint
research, as follows:
Chapter 3 and 4 of the thesis was co-authored with Aarron Younan, Danilo
Corral-De-Witt, Jose Matamoros, Faroq A. Awin and Esam Abdel-Raheem
under the supervision of professor Kemal Tepe. In all cases, the key ideas,
primary contributions, experimental designs, data analysis, interpretation, and
writing were performed by the author, and the contribution of co-authors was
primarily through the provision of hardware setup and data collection. Arooj
Fatima contributed to the background study and hypothesis modeling; Aarron
Younan contributed to the data collection and graphing results; Danilo
Corral-De-Witt, Jose Matamoros, Faroq A. Awin and Esam Abdel-Raheem provided
feedback on refinement of ideas and editing of the final manuscript.
I am aware of the University of Windsor Senate Policy on Authorship
and I certify that I have properly acknowledged the contribution of other
re-searchers to my thesis, and have obtained written permission from each of the
co-author(s) to include the above material(s) in my thesis.
which it refers, is the product of my own work.
II. Previous Publication
This thesis includes [1] original papers that have been previously published/submitted
for publication in peer reviewed journals, as follows:
Thesis Chapter
Publication title/full citation
Publication
status
Part of Chapter 3
& 4
Corral-De-Witt, Danilo, Aarron
Younan, Arooj Fatima, Jos
Mata-moros, Faroq A. Awin, Kemal
Tepe, and Esam Abdel-Raheem.
”Sensing TV spectrum using
Soft-ware Defined Radio hardSoft-ware.” In
Electrical and Computer
Engineer-ing (CCECE), 2017 IEEE 30th
Canadian Conference on, pp. 1-4.
IEEE, 2017 .
Published
I certify that I have obtained a written permission from the copyright
owner(s) to include the above published material(s) in my thesis. I certify
that the above material describes work completed during my registration as a
III. General
I declare that, to the best of my knowledge, my thesis does not infringe upon
anyones copyright nor violate any proprietary rights and that any ideas,
tech-niques, quotations, or any other material from the work of other people
in-cluded in my thesis, published or otherwise, are fully acknowledged in
accor-dance with the standard referencing practices. Furthermore, to the extent that
I have included copyrighted material that surpasses the bounds of fair dealing
within the meaning of the Canada Copyright Act, I certify that I have obtained
a written permission from the copyright owner(s) to include such material(s)
in my thesis.
I declare that this is a true copy of my thesis, including any final revisions,
as approved by my thesis committee and the Graduate Studies office, and that
this thesis has not been submitted for a higher degree to any other University
Abstract
Wireless communication requirements of higher sampling frequencies and bandwidth are ever
in-creasing. For this purpose, exploitation of underutilized spectrum bands was one the challenging
research targets. Cognitive Radio (CR) is a promising solution to overcome the “limited
band-width” issue. Software defined radio (SDR) is the enabler of CR. The aim of the thesis is to adopt
the vacant TV channels for secondary users. Spectrum sensing prototype has been proposed to
de-tect TV white space (TVWS). The prototype has been developed using Universal Software Radio
Peripheral (USRP) and examined to sense TVWS in the real time world. The conducting analysis
of obtained measurements showed the state of unoccupied spectrum bands in the UHF band ranges
from 500 MHz to 698 MHz in the urban area of Windsor, Ontario, Canada. Two different spectrum
sensing techniques namely, the energy detector, and pilot-tone detector were employed to get the
result with minimum computational complexity. Experiments show that the presence of incumbent
users can be easily detected using the spectrum sensing techniques mentioned in the thesis. The
Dedication
Dedicated to,
My beloved parents: Syed Akhlaq Hussain and Syeda Fatima
My kind aunts: Kaniz Ishtiaq, Narjis Fatima, Naseem Fatima and Meraj Fatima
Acknowledgements
I would like to thank my supervisor Dr. Kemal Tepe for introducing me the concept of Cognitive
Radios and for suggesting it as the project of my thesis. Also, his guidance and support helped me
to achieve successes. I would also like to thank my committee members Dr. Esam A. Raheem and
Dr. Arunita Jaekel for their valuable inputs. A special thanks goes to my colleagues Dr. Faroq
A. Awin, Dr. Sabbir Ahmed, Mr. Danilo Corral-De-Witt, Mr. Aarron Younan and WiCIP team
members. They provided me with constant encouragement and the discussion that I had with them
prompted me to develop new ideas and provide breakthroughs.
I would also like to pay my special regards to the University of Windsor for providing me the
opportunity to study in this institute. The last but not the least I would like to thank my family and
Table of Contents
Declaration of Co-Authorship and Previous Publication . . . iii
Abstract. . . vi
Dedication . . . vii
Acknowledgements . . . viii
List of Tables . . . xi
List of Figures . . . xii
List of Abbreviations . . . xiii
1 Introduction . . . 1
1.1 Background . . . 1
1.1.1 Motivation . . . 2
1.1.2 Problem Statement . . . 2
1.1.3 Use of Television White Spaces . . . 3
1.1.4 Thesis Objectives . . . 3
1.1.5 Thesis Contributions . . . 4
1.2 Thesis Organization . . . 5
2 Literature Review . . . 6
2.1 Introduction . . . 6
2.2 Software Defined Radios . . . 7
2.2.1 Software Defined Radios: A Platform for Cognitive Ratios . . . 8
2.3 Main Functions of CR . . . 9
2.3.1 Spectrum Sensing . . . 10
2.3.2 Spectrum Analysis and Decision . . . 17
2.3.3 Spectrum Management and Sharing . . . 17
2.3.4 Spectrum Mobility . . . 18
2.4 Cognitive Radio Standard: IEEE 802.22 . . . 19
2.5 Communication over Cognitive Radio . . . 20
2.5.1 Cross-Layer Functionality of Networking Layers . . . 20
2.5.2 IEEE 802.22 for Cross-Layer Functionality . . . 21
2.6 Spectrum Sensing using SDR Hardware . . . 23
2.7 Summary . . . 24
3 Research Methodology . . . 25
3.1 Introduction . . . 25
3.2 Equipment and Parameters . . . 26
3.2.1 Radio Frequency Explorer . . . 26
3.2.2 Universal Serial Radio Peripheral . . . 27
3.2.3 Antenna Parameters . . . 28
3.2.4 Spectrum Parameters . . . 28
3.3 Experimental Setup . . . 29
3.3.1 Prototype Setup . . . 29
3.4 Simulated Data Generation . . . 32
3.4.1 Data Generation using GNU Radio . . . 32
3.5 Two-step Spectrum Sensing Approach . . . 34
3.5.1 Pilot-Signal Detection . . . 35
3.5.2 Energy Detection . . . 38
3.6 Performance Analysis . . . 40
3.7 Summary . . . 41
4 Testing and Implementation . . . 43
4.1 Introduction . . . 43
4.2 Data Visualization . . . 43
4.2.1 Prototype Data Visualization . . . 43
4.2.2 GNU Radio Generated Data Visualization . . . 47
4.2.3 MATLAB Generated Data Visualization . . . 49
4.3 Pilot-tone Detection . . . 51
4.4 Received Signal Strength Analysis . . . 54
4.4.1 Magnitude Analysis . . . 54
4.4.2 Threshold Measurement Analysis . . . 56
4.4.3 Energy Measurement Analysis . . . 58
4.5 Performance Analysis . . . 59
4.6 Summary . . . 60
5 Conclusion and Future Scope . . . 62
5.1 Conclusions . . . 62
5.2 Future Scope . . . 63
References . . . 64
List of Tables
2.1 IEEE 802.22 Parameters . . . 19
2.2 PHY Layer Parameters . . . 22
List of Figures
2.1 A Typical Cognitive Radio . . . 6
2.2 A simple Software Defined Radio . . . 7
2.3 A Generic Software Defined Radio . . . 9
2.4 Main Functions of CR . . . 10
2.5 Various Spectrum Sensing Techniques . . . 11
2.6 Pilot Signal in Spectrum . . . 13
2.7 Pilot Detection . . . 14
2.8 Block Diagram of matched filter technique . . . 15
2.9 Block Diagram of CS detection scheme . . . 16
2.10 Cross-Layer Functionality of CR . . . 21
3.1 RF Explorer Hardware and Software Overview . . . 27
3.2 NI USRP-2900/2901 . . . 28
3.3 TVWS Detection Flowchart . . . 31
3.4 GNU Radio Program for data generation . . . 33
3.5 Block Diagram of Two step spectrum sensing Technique . . . 35
3.6 Pilot-tone detection using Filter . . . 36
3.7 Magnitude Response of Band-pass filter . . . 38
3.8 Block Diagram of Utilized Sensing Algorithm . . . 40
4.1 Frequency Observation at Data Collection Program . . . 44
4.2 High Resolution Channel Sweep . . . 45
4.3 ATSC Pilot-tones . . . 45
4.4 Heat Map visualization of channels . . . 47
4.5 Signal Data generated by GNU Radio . . . 48
4.6 Generated TV signal by MATLAB . . . 49
4.7 Peak detection in ATSC Signal . . . 50
4.8 Pilot Signal generated in MATLAB . . . 51
4.9 Observed pilot-tone for in a channel . . . 52
4.10 Idle TV channel . . . 52
4.11 Observed channel 19 . . . 53
4.12 Observed pilot-tone for channel 22 . . . 54
4.13 Received Signal Strength for different data sets . . . 55
4.14 Channel 19 to 51 response for 7 runs (Data set 1) . . . 56
4.15 Channel 19 to 51 response for 7 runs (Data set 2) . . . 57
4.16 Channel 19 to 51 response for 7 runs (Data set 3) . . . 57
4.17 Received Signal Strength of Channel 19 to 50 . . . 58
4.18 Duty cycle of each channel . . . 59
List of Abbreviations
ATSC Advanced Television Systems Committee
AWGN Additive White Gaussian Noise
BPF Band-pass Filter
BW Bandwidth
CR Cognitive Radio
CS Cyclo-Stationary
CSV Comma Separated Value
dBi decibels isotropic
dBm decibels in milli-Watts
DTV Digital Television
ECC Electronics Communication Commission
ED Energy Detector
EIRP Effective Isotropic Radiated Power
FCC Federal Communications Commission
FDM Frequency Division Multiplexing
GPS Global Positioning System
GSM Global System for Mobile communication
GUI Graphical User Interface
IP Internet Protocol
ISM Industrial/ Scientific/ Medical
MAC Medium Access Control
MIMO Multiple Input Multiple Output
OFDMA Orthogonal Frequency-Division Multiple Access
OSI Open System Interconnection
PC Personal Computer
PHY Physical layer
PU Primary User
QoS Quality of Service
RF Radio Frequency
RSS Received Signal Strength
SDA Software Defined Antennas
SDR Software Defined Radio
SNR Signal to Noise Ratio
SU Secondary User
TCP Transmission Control Protocol
TDM Time Division Multiplexing
TPC Transmission Power Control
TV Television
TVWS Television White Spaces
UHF Ultra High Frequency
UK United Kingdom
US United States of America
USRP Universal Serial Radio Peripheral
WiCIP Wireless Communication and Information Processing lab
WiMax Worldwide Interoperability for Microwave Access
Chapter 1
Introduction
1.1
Background
Wireless communications is an integral building block of modern communications. With the
ad-vancement of technology, the demand for radio spectrum has increased tremendously. There are
more users of bandwidth as compared to the capacity of radio spectrum. The Industrial/ Scientific/
Medical (ISM) band has been successful to manage most of the Wireless Local Area Networks
(WLANs) so far but the interference is becoming a nightmare for the communication industry.
The overcrowding in the vital band of communications opens a gateway to find a better spectrum
management techniques. There is a need for an autonomous technique which is efficient enough
to sense the radio spectrum in its surroundings.
A Software Defined Radio (SDR) is capable of managing the spectrum. In the previous kind of
radios, the spectrum was divided either by Frequency Division Multiplexing (FDM) or Time
Divi-sion Multiplexing (TDM) in which particular amount of spectrum has been dedicated to the specific
user even if the user is inactive, the spectrum is considered occupied. SDR is capable enough to
evade the “limited spectrum” assumptions of these kinds of radios in many ways including spread
spectrum and ultra wide band techniques, Software Defined Antennas (SDAs), Cognitive Radios
(CRs), etc. SDRs along with the SDAs are enablers of CRs.
Joseph Mitola III first proposed the concept of CR, and as per his definition a radio which is
smart enough to make its decision based on its surrounding environment, analyze the past
commu-nications and do transmissions based on the current state of the environment can be referred to as
CR [1]. A CR can be termed as an “Intelligent Radio” which has the capability to make decisions
1.1.1
Motivation
Natural disasters such as earthquakes, floods, and hurricanes often cause great loss of human lives.
According to the United Nations Relief Web, more than 750,000 people have died across the
globe during the past decade [2]. Besides the deaths caused by the disaster, a large number of
people suffer or even die due to delay in getting rescued or necessary support. During any disaster,
different relief teams step forward to offer their services. Each team setup their communication
system to coordinate their efforts. Overcrowding of spectrum causes problems due to interference.
Moreover, during mega disasters, communication infrastructure is often severely affected, and it is
hard to re-setup a system with limited resources.
In situations mentioned above, the capability of CR can be utilized to set up a communication
system. A CR will detect its surrounding environment, setup a secure communication system
which will not interfere with its neighboring radios. CR occupies a channel for a certain amount of
time and can communicate with neighboring radios. In this way, a CR will allow its surrounding
co-operating radios to utilize the same spectrum.
The need for a real-time signal processing increases while dealing with the catastrophic
sit-uations. There is a minimum time for a user to analyze the communication system and make
decisions accordingly. CR is capable of analyzing the situation in the real-time along with the
SDR and SDA. One of the benefits of a CR is to use it to setup a communication network which is
a combination of multiple CRs. In this way, the underutilized channels can be efficiently used.
1.1.2
Problem Statement
Fast and reliable communication in case of natural disaster is a crucial aspect of saving human life
from loss. To setup, a communication system which is efficient enough to overcome the
interfer-ence problems while utilizing the limited bandwidths is an important task.
The foremost step before setting up a communication system using CR technique is to detect
computa-tional complexities need to be avoided while identifying the primary users. There is also a need to
demonstrate the effectiveness of the system with a prototype.
1.1.3
Use of Television White Spaces
Disastrous situations such as hurricanes, floods, earthquakes, etc. affect the communication
infras-tructure badly. The Industrial/Scientific/Medical (ISM) band is populated by different Bluetooth,
WiFi, GSM, etc. bands in the vicinity. Moreover, many unlicensed band users also interrupt this
popular band. The use of ISM band increases during such catastrophic situations. The advent of
digital switch-over in the Television (TV) band opens a gateway to many underutilized channels.
These channels are referred to as Television White Spaces (TVWS). These channels can be utilized
for various communication purposes.
TVWS have been preferred over other various frequency bands found in the vicinity because
an enormous amount of TV spectrum is still unoccupied. The use of TVWS to cater the
communi-cation needs in such situation has been proposed in this thesis. TVWS has been chosen to serve the
purpose since this band has been considered as the most underutilized band in the spectrum. The
proposed research demonstrates the idea that these bands can be used to setup a communication
system during disasters.
1.1.4
Thesis Objectives
The goals of the thesis include:
i. Building a prototype that can perform real-time spectrum sensing using Universal Software
Radio Peripheral (USRP) 2901.
ii. Studying the behavior of TVWS available in Ultra High Frequency (UHF) band ranges from
500 MHz to 698 MHz to determine which TV channel band can be exploited for this purpose.
The thesis is intended to establish a prototype using USRP to detect the white spaces present
in the TV spectrum. The major step to setup a CR based communication is spectrum sensing.
Various spectrum sensing techniques that have been implemented in the thesis are obtained from
the literature. The spectrum sensing techniques adopted in this thesis will be used to detect the
presence of the incumbent user of the spectrum. The selection of an efficient technique which
has less computational complexity is the primary objective. The efficiency of the method can be
measured by its probability of detection (Pd) and the probability of false alarm (Pf). The data is
collected in real-time with a USRP hardware and GNU Radio software.
1.1.5
Thesis Contributions
In this thesis, TVWS has been selected as a candidate spectrum band for our spectrum sensing
prototype. The prototype uses a USRP 2901 hardware and GNU Radio software to obtain results
of spectrum sensing. The setup was build in Wireless Communication and Information Processing
(WiCIP) lab.
The prototype has been examined using simulated signals, which were generated using
MAT-LAB and GNU Radio software platform. Then, verification of the validity of the proposed
proto-type has been done by employing the protoproto-type in real world measurements. Data for real world
measurements have been also analyzed in order to determine the TVWS in the target spectrum
band (i.e., from 500 - 698 MHz).
Different spectrum sensing techniques (i.e. energy detection and pilot-tone detection) have
been implemented to detect the presence of incumbent users. The detection has been verified
by adopting different threshold and calculated itsPd andPf under different SNR scenarios while
1.2
Thesis Organization
The thesis is organized as follows. Chapter 2 presents the literature review on CRs as well as
SDRs. The highlighted techniques of spectrum sensing are also the part of the chapter. Finally, the
CR standard IEEE 802.22, as well as the communications system using CR, is presented.
Chapter 3 presents the research methodology in detail. It provides an experimental setup for
detecting TVWS. Equipment and parameters used for testing and implementing the proposed
pro-totype are also considered. An overview of sensing algorithm used in the thesis is also presented
in this chapter. Generation of the simulated ideal signal to examine the proposed prototype is
con-sidered. Furthermore, conducting to the simulations, the performance metric has been discussed
and employed to verify the validity of the proposed prototype.
Chapter 4 gives design examples and achieved results of conducted experiments. It illustrates
the data which has been captured using USRP. The simulated data can also be observed in this
chapter. The chapter demonstrates the experimental results of the proposed prototype and analysis
of the attained experimental results are also considered in this chapter.
Chapter 2
Literature Review
2.1
Introduction
The natural frequency spectrum is not enough to accommodate the increasing number of wireless
communication users. The need for fast communication with higher data rate devices is one of
the most significant concern to be taken into account in coming years. The CR concept provides
a viable solution to the problem. According to the definition given by Federal Communications
Commission (FCC): “Cognitive radio: A radio or system that senses its operational
electromag-netic environment and can dynamically and autonomously adjust its radio operating parameters to
modify system operation, such as maximize throughput, mitigate interference, facilitate
interoper-ability and access secondary markets.” [3].
A generic CR is implemented over an SDR. In RF communications, SDR along with the SDAs
are the enablers of the cognitive radios. SDRs are the capable paradigm of managing and
optimiz-ing the spectrum efficiency. A typical CR is shown in Figure 2.1.
SDR can be interfaced with a wide variety of networks including Zigbee, WLAN, WiMAX,
Bluetooth, etc. SDR structure is not only in use to optimize the spectrum efficiency but also to
overcome the “limited spectrum needs,” as presented in the literature. The chapter is based on the
literature review of previous implementations of CR to scan TVWS, but before describing it, this
chapter presents the basics of CR. At first, an introduction to SDR is presented. The fundamentals
of the main units of SDR and relationship between SDR and CR is given in this chapter.
The functions of CR along with their significant examples will be explained in detail. The CR
standard IEEE 802.22 will be discussed along with the communication protocols of CR. Finally, a
literature review of previously implemented prototypes, as well as their outcomes, are mentioned.
2.2
Software Defined Radios
According to the concept of SDR, the radio in which most or all of the hardware components which
were previously physically implemented including filters, amplifiers, modulators/demodulators are
now implemented using the software on a Personal Computer (PC) or embedded system. A
sim-plified version of an SDR is presented in Figure 2.2.
SDR is responsible for performing the internal and external sensing, (i.e., it deals with the inner
layers of the OSI and TCP/IP models) and forms a connection between each layer. The upper layer
functionalities in Figure 2.1 show a relationship between the SDR and SDA. In addition to SDR,
CR has an advantage of sensing the environment in real-time. SDR initially was considered as
the promising solution for interoperability, seamless global connectivity, standard and
multi-mode issues [4].
2.2.1
Software Defined Radios: A Platform for Cognitive Ratios
The need for higher computational and intelligent functionalities as well as emerging demand in
high Quality of Services (QoS) given by the service providers leads to the CR technology. As
provided in the definition given by FCC, a CR has the capability to adapt the radio parameters and
can change itself accordingly. SDR has shown the flexible communication functionality by using
the fixed analog circuits and components. Based on this, a CR needs to be designed around SDR.
According to one definition, “A CR is an SDR that is aware of its environment, internal state, and
location, and autonomously adjusts its operations to achieve designated objectives [4].”
SDR presents a very flexible platform for an implementation of a CR. It can operate flexibly
with different bandwidths over a wide range of frequencies. An ideal SDR consists of three central
units such as reconfigurable digital radio, a software tunable analog radio and a software tunable
antenna. The primary function of digital radio is to optimize the different waveforms. Software
analog radio front end is there to perform functions such as RF filters, Power Amplifiers, Low
Noise Amplifiers, etc. The impedance synthesizer along with this unit is there to ensure the
Figure 2.3: A Generic Software Defined Radio
2.3
Main Functions of CR
A CR can perform tasks autonomously by using functionalities such as self-managing, self-optimizing,
self-monitoring, self-repair, self-protection, self-adaption, and self-healing to achieve its goals [1].
There are two main highlighting features of CR:
• Flexibility
• Potential gain in spectral efficiency
The RF spectrum is divided into:
• Licensed Spectrum: A licensed spectrum is alloted to a particular user by giving
the administrative rights. The Licensed user is allowed to perform operations in
this particular range. Spectrum management authorities give legal rights to the user
according to which no other user is allowed to use this spectrum within the same
geographic area.
• Unlicensed Spectrum: An unlicensed spectrum is an underutilized spectrum which
utilizing the unused spectrum of the ISM band. These users are authorized to use
the band for a particular period without causing harmful interference to the other
users if the band is unoccupied. According to FCC a user of unlicensed spectrum is
allowed to transmit information which is less than 1 watt [5].
In a typical communication system, the user of licensed band is known as thePrimary user (PU).
The channel has been allocated to the PU regardless of its activity. Secondary Users (SU) are the
one which uses the underutilized unlicensed or in some cases licensed bands of the spectrum. SU
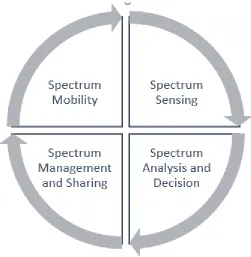
has the lowest priority regarding spectrum usage. The primary objective of the CR is to
accommo-date those SUs, to maximally utilize the available spectrum. The functionality of a CR is shown in
Figure 2.4.
Figure 2.4: Main Functions of CR
2.3.1
Spectrum Sensing
Spectrum sensing is the key aspect of CR. Finding a spectrum sensing technique which requires
effi-cient. The performance metrics of any technique can be estimated based on its detection accuracy,
robustness and complexity. Spectrum sensing is modeled on the following hypothesis [3]:
Hypothesis0(H0):Signal is Absent Hypothesis1(H1):Signal is Present where,
H0:x(t) =w(t),
H1:x(t) =h(t)∗s(t) +w(t),
(2.1)
x(t)is the Received Signal Strength (RSS) of the signal,w(t)is the Additive White Gaussian Noise
(AWGN) [6],s(t)is the received signal andh(t)is the channel gain.
The performance of any sensing techniques can be estimated by calculating its probability of
detectionPdand probability of false alarmPf [7]. For a system to be efficient, ideally thePdshould
be high, andPf should be low. The performance probabilities will be further discussed in Chapter
3.
Several Spectrum Sensing techniques have been proposed in the literature [3, 4, 7–11]. Among
the most notable ones are the energy detection based spectrum sensing, pilot-tone detection scheme,
cyclo-stationary based spectrum sensing, matched-filter detection schemes. Some of the
tech-niques illustrated in Figure 2.5 are presented here.
Figure 2.5: Various Spectrum Sensing Techniques
i) Energy Detection Spectrum Sensing Technique
pres-ence of PU. It works on the simple principle of estimating the strength of the incoming signal.
This technique has the lowest computational and implementation complexities as the detector
does not need to know about the incoming PU signal [12].
A simple Energy Detector (ED) can be based on the detection criteria which can interpret the
presence of an incoming signal by comparing its signal strength with a predefined threshold
value: d=
0 γ <λ
1 γ ≥λ
(2.2)
whereλ is the predefined threshold andγ is the energy of the incoming signal. The selection
of theλ is critical in this scheme as the selection is sensitive to noise bench of the signal. If
λ is considered high then signal with low power will be miss detected by the system
simul-taneously with lowλ, there is a high probability of detecting the noise which can give rise to
Signal to Noise Ratio (SNR) penalties [13]. According to [4], the AWGN in Equation (2.1)
has the power ofσ2and bandwidthBHz.
In a conventional ED, the energy of the signal is computed over a given time periodT
equiv-alently overNsamples:
T =NTs, (2.3)
whereTsis the sampling period of the signal.
The SNR (ρ) of the signal can be computed over a certain time period considering the signal
and complex conjugate signal product as mentioned in Equation 2.4 [7].
ρ= α
2
σ2(t2−t1)
Z t2
t1
s(t)s∗(t)dt, (2.4)
whereα is the magnitude andσ2is the variance.
Limitations: Noise above a certain level cannot be estimated in ED. Once the value of SNR
drops below a certain point the scheme can no longer efficiently detect the signal, irrelevant
ii) Pilot-tone Detection Scheme
Another method to detect the presence of PU in a BW is by estimating the presence of a
Pilot-tone in the spectrum. A transmitter places a pilot tone, and the receiver has complete
knowledge about the location of this tone in the spectrum [10].
Figure 2.6: Pilot Signal in Spectrum
The pilot signal is detected in a digital domain, and hence the hypothesis for this will be:
H0:x(n) =w(n),
H1:x(n) =Sp(n) +w(n),
(2.5)
whereSp(n) is the signal with the pilot of power θ. The pilot data can be estimated using
matched filter statistics which states:
T =
∑
n
x(n)s∗p(n). (2.6)
wherex(n)is the received signal ands∗p(n)is the conjugate of received pilot signal.
The presence of the signal is detected by considering the statistics given in Equation 2.7. Tx
represents the signal presence. The test statistics T is compared with a thresholdλ. If T is
Tx=
0 T <λ
1 T ≥λ
(2.7)
Figure 2.7: Pilot Detection
iii) Match Filter Detection Scheme
The technique with the highestPd and also with the highest computational complexity is the
matched filter detection scheme. To implement this technique, a user must have the complete
knowledge of the incoming PU signal. The concept of matched filter according to [7] works
by maximizing the SNR at the output of the filter. Mathematically, this is written as:
h(t) =
s(t−T) 0≤t≤T
0 elsewhere
(2.8)
The presence of PU can be estimated by passing the signal through a filter which will increase
the useful signal strength at the same time will decrease the noise power [14]. If the signal is
present there will be a clear, sharp peak or else if there is no peak then the signal is not present
in the spectrum. The filter which can perform such function is known as matched filter.
The block diagram given in Figure 2.8 illustrates that the received signalx(t) will be added
with an AWGN which will give the resultant signal (y(t)). The resultant signal along with the
predefined signal will be given as an input z(t) to the match filter which will convolve the two
signals and impulse response of the output signal will then be compared to the thresholdλ for
Figure 2.8: Block Diagram of matched filter technique
Matched filter scheme detects the presence of a PU by increasing the value of SNR. This
gives the advantage to detect the signals with low SNR which are usually neglected in other
schemes.
Limitations: Matched filter cannot be implemented in the case where the receiver does not
have complete information about the incoming signal. Moreover, the computational
complex-ity of this scheme increases the hardware complexities and hence is not a preferable scheme
in so many cases.
iv) Cyclo-Stationary Spectrum Sensing Scheme
In wireless communications when an excess amount of BW is used, signals show very strong
Cyclo-stationary (CS) feature based on modulation type, carrier frequency, and data rate. If
the user knows certain characteristics of PU, then CS feature can be used to detect the presence
of PU in the BW [7].
This technique has robustness in uncertainty in noise power and propagation channel [16]. To
implement this technique user has to make a trade-off with the computational complexities.
modulation scheme used by the PU. This increases the efficiency of the system [17]. The
generic block diagram shows the basic working of the detection scheme in Figure 2.9. An
input signal x(t) is passed through a filter which will reduce the noise element present in
the signal. The resultant signal will be correlated with the other captured signals and after
performing signal correlation, the result will be compared to the predefined threshold λ to
obtain the test statistics resultT(x)which will determine whether PU is present or not.
Figure 2.9: Block Diagram of CS detection scheme
Limitations: CS spectrum sensing technique needs sufficient amount of signals to detect the
spectrum. In case if a number of observations are not enough, the detection performance will
be compromised. Due to high computational and implementation complexities, the overall
hardware complexities of the system increases.
v) Other Spectrum Sensing Algorithms
There is a variety of other detection schemes presented in the literature including the
covari-ance based method in which the difference between the covaricovari-ance of incoming signal and
additive noise is used to detect the presence of the PU.
Eigen value based detection scheme is similar to the covariance based scheme. The Eigen
value of the covariance matrix is computed and then compared to detect the signal. This
scheme is based totally on the test statistics and does not require any information about the
noise and hence also known as “fully blinded” detection scheme [7].
Another technique is wavelet based edge detection in which wavelet transform technique is
used to detect the edges of the signal. Other techniques include spectral estimation method
2.3.2
Spectrum Analysis and Decision
A particular band of a spectrum has its own characteristics based on a number of users and
fre-quency range. Spectrum sensing detects unused spectrum in the band but SU has the ability to
choose the band which is suitable for it in terms of data security and availability of band as
re-quired by SU. Spectrum analysis also determines the path loss, interference, wireless link errors,
layer delays, etc. [1].
The knowledge about the incoming PU is analyzed, and the decision is made on which band
should be allocated to the SU. There are different models and approaches present in the literature
which can be used to analyze the spectrum. One of the techniques uses Markov chain analysis [20].
The following aspects are analyzed by CR [21]:
• Operating Frequency: CR has the capability to analyze and adjust the operating
frequency as required by the SU.
• Modulation: CR detects the modulation scheme and can adjust according to the
need of SU. For example, communication where the minimal delay is required, CR
increases the data rate at the same time neglect the bit error rate.
• Transmission Power: CR can adjust the transmission power according to its use.
For example, if CR needs to accommodate a large number of SUs, it decreases the
transmission power of each user whereas, if the number of SUs are limited then CR
has the potential to increase transmission power accordingly.
• Communication Technology: CR has the aptitude to switch among different
com-munication technologies.
2.3.3
Spectrum Management and Sharing
The information obtained after spectrum sensing and analyzing is then utilized for managing the
on its availability and PU activity. If a certain band is available for a particular time period, but the
PU of the band is showing unpredicted behavior, then it is the responsibility of the CR to switch
SU to the band where PU activity is partially predictable. Selecting the most suitable spectrum for
SU is the main responsibility of spectrum management protocol [21].
Spectrum sharing is an important aspect of CR. Sharing the spectrum requires a coordination
with other users present in the spectrum. Sharing the spectrum can be threatening for SU if a
malicious user is present in the system and it depicts the spectrum band as unoccupied and is
actually trying to read the data sent by the SU. It will not only cause data loss for SU, but also
it will be a threat for SU. Sharing spectrum with a malicious user can be harmful to SU as it can
affect the data security of the SU.
2.3.4
Spectrum Mobility
Spectrum mobility is an important factor of CR protocols as SU is not privileged to use a certain
band for a long time. Availability of licensed bands changes frequently over time. The major factor
affecting mobility is the time it takes during spectrum hand-off [1]. This hand-off cause delay in
various layers of the communication stack. While writing protocols for this aspect of CR, one must
consider the sensing time taken by SU to detect the vacant band and also to vacate the band when
PU becomes active. Otherwise, PU can face severe data loss due to interference. IEEE 802.22 put
forth standards to avoid this interference by putting time constraints for SU. In this case, SU will
not be able to use the band for a prolonged time, and the risk of interference can be minimized.
Spectrum mobility is the key aspect of CR to ensure the uninterrupted communication by
im-plementing dynamic spectrum access [22]. The spectrum holes are the unused or underutilized
spaces present in the spectrum. Spectrum mobility protocol interrupts an on going communication
if PU becomes active. This protocol then switches to another channel to provide communication
services to the SU. To provide QoS communication while ensuring a seamless communication is
2.4
Cognitive Radio Standard: IEEE 802.22
IEEE 802.22 is the standard designed to deal with the white spaces present in the TV spectrum.
IEEE 802.22 ensures a seamless communication of a cognitive user while causing no interference
to a digital or analog user of the band. IEEE 802.22 was introduced initially to setup a
communi-cation system in rural areas while utilizing TVWS.
IEEE 802.22 deals with the Wireless Local Area Network (WLAN) as well as the physical
(PHY) and Medium Access Control (MAC) Layer while ensuring the QoS to any data including
audio and video traffic [24]. This standard is the modified version of IEEE 802.16 (WiMax) and
802.11a/g (WLAN) with a wider range for its user.
The key features of this standard include high data rate, long range, immunity to interference,
extensive data coverage and the most of all it can be operated in the licensed as well as an
unli-censed band [8]. The operating parameters are provided in Table 2.1.
Table 2.1: IEEE 802.22 Parameters
IEEE 802.22 Parameters
Parameter Specification
Range 30-100 km
Methodology Spectrum Sensing to Identify free channels
Channel Bandwidth 6, 7, 8 MHz
Channel Capacity 18 Mbps
User Capacity Up-link: 384 Kbps, Down-link: 1.5 Mbps
The communication regulatory authority has standardized protocols for TVWS operations in the
USA and UK, according to which if a fixed device is operating at a particular geographic location;
it can transmit power up to 1 W in one or multiple 6 MHz channel. Antenna gain of 6 dBi is
allowed. The power spectral density should not be greater than 12.2 dB in any 100 KHz band. The
(20 dBm) and power spectral density should not be above 2.2 dB in a 100 kHz band. If a portable
device is working adjacent to the licensed channel its power should be reduced to 40 mW while
spectral density should be -1.8 dBm in a 100 kHz band. The sensing device should detect signal up
to SNR value of -114 dB and should end the communication within 2 seconds [25]. The antenna
parameters defined by IEEE 802.22 should have a gain of 0 dBi or higher.
2.5
Communication over Cognitive Radio
CR is designed to set up a communication system which meets the ideal concept of meeting the
standards set up by FCC while ensuring the use of an underutilized spectrum of TVWS. It is
designed to work efficiently with different layers of the TCP model. The SU should be able to set
up a communication without causing harmful interruption to PU.
The CR standard IEEE 802.22 is designed to work with the Physical (PHY), Medium Access
Control (MAC) and Network layer of the CR. This standard states that the total time of spectrum
sensing, data transmission and spectrum vacating should not exceed 2 seconds. Moreover, during
this time CR should continuously scan other vacant bands in the spectrum in case if PU wants to
become active so that SU can be able to vacate the band without causing interference with licensed
user.
The CR should provide data security for SU from the malicious users of the spectrum, as it
can cause harm to the data transmitted by SU. Another concept given in literature states that a CR
should be efficient enough to create its own system by setting up a communication between two
SU’s (i.e. one SU transmits the data, and another SU receives it and vice-versa.)
2.5.1
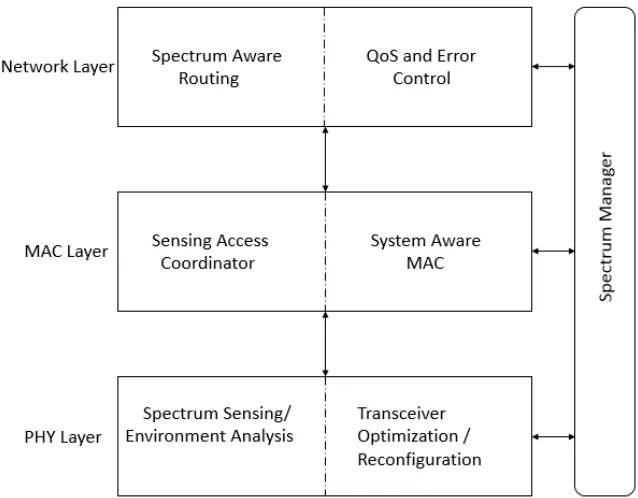
Cross-Layer Functionality of Networking Layers
The cross-layer functionality of CR in Network Interface layer of the TCP model is shown in
Figure 2.10. The physical layer being on the bottom is directly related to all the external hardware
and receiving. CR sensitivity is well-addressed if RF front-end sensitivity is increased. PHY
layer is responsible for exploiting the digital signals for specific PU. The MAC layer, on the other
hand, is in charge of spectrum allocation (i.e., it is responsible for spectrum analysis, spectrum
management, and spectrum mobility.) Moreover, network cooperation where users share their
spectrum sensing measurements is also part of this layer.
Each Internet Protocol (IP) layer supports different configurations which support various modes
of operations of a communication system. The overall performance of each layer is obtained by
tuning the configuration parameters with each other. The major challenges faced during the
con-figuration of these layers include modularity, interoperability, imprecision, scalability, and
com-plexity [26]. Cross-Layer Optimization also increases the computational cost of the system.
Figure 2.10: Cross-Layer Functionality of CR
2.5.2
IEEE 802.22 for Cross-Layer Functionality
IEEE 802.22 has put forth the standards to deal with different communication layers of OSI and
work in a real-time environment. The PHY and MAC parameters defined by IEEE Working Group
are mentioned in the sections below.
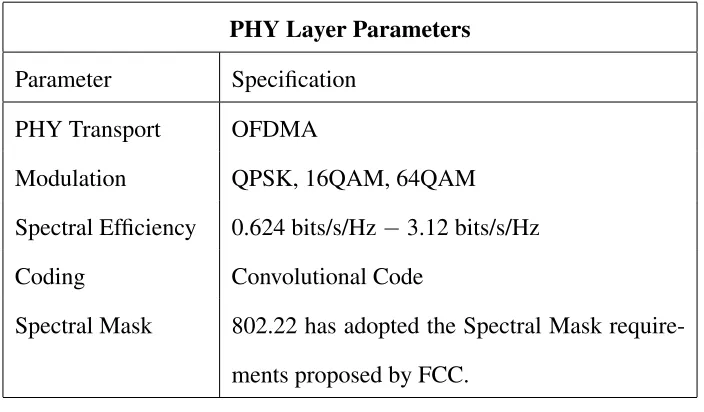
PHY Layer
The service capacity to which a CR correspond is a total of PHY data rate of 18 Mbps in a 6 MHz
TV channel [24]. The main objective of PHY layer is to keep the performance standard high at
the same time the complexity should be low. IEEE 802.22 has defined high flexibility regarding
modulation and coding. Another important issue to consider is the Transmission Power Control
(TPC), according to the standard, the TPC dynamic range should be at least 30 dB. The key features
are given below:
Table 2.2: PHY Layer Parameters
PHY Layer Parameters
Parameter Specification
PHY Transport OFDMA
Modulation QPSK, 16QAM, 64QAM
Spectral Efficiency 0.624 bits/s/Hz−3.12 bits/s/Hz
Coding Convolutional Code
Spectral Mask 802.22 has adopted the Spectral Mask
require-ments proposed by FCC.
MAC Layer
The CR-based MAC should be highly dynamic so that it can effectively respond to the changes
in the operating environment. Robust data delivery is the major function of this layer besides
medium access control. A CR channel can use any multiplexing scheme including frequency,
time, code or any combination therein. Hence, the MAC layer protocol designing is complex as
The other operations of this layer include switch channels, suspend/resume channel operation, and
add/remove channels to protect the incumbent user [24].
2.6
Spectrum Sensing using SDR Hardware
SDR hardware is incorporated with a variety of functionalities. The hardware has the capability to
perform functions such as analog to digital conversion and vice versa, modulation and
demodula-tion, encryption and decrypdemodula-tion, network routing using Graphical User Interface (GUI), etc. There
are various hardware including Radio Television Luxembourg (RTL) SDR [27], USRP [28], etc.
present to detect the spectrum. These hardware have previously been used with different antennas
to achieve communication between SU while applying different CR techniques. A variety of
ven-dors including NI, Ettus, RTL-SDR, etc. are producing SDR hardware. SDRs along with SDAs
have been previously incorporated with softwares such as GNU Radio, Labview, etc. to achieve
CR functionalities.
A scheme which estimates the energy of the PU using Wireless Open-Access Research
Plat-form (WARP) boards is presented in [29]. The research implemented a communication system
using two WARP boards, one board as a transmitter and the other as the receiver. The QPSK
modulated signals were generated for system validation. The experimentation results were able to
detect signals only up to -7 dB SNR.
Ettus USRP and antenna for spectrum sensing in convolutional neural networks along with the
GNU Radio software was used to setup a prototype in [30]. Energy detection scheme for incumbent
user detection is based on machine learning techniques such as K-means clustering while keeping
the 10 dB SNR value fixed.
Two different spectrum sensing methods (i.e., covariance matrix and maximum-minimum
Eigenvalue method) have been implemented in [31] for spectrum sensing. A Universal Software
Radio Peripheral (USRP) was used to capture the real-time signals. This USRP was configured
in this paper.
The literature review of examples motivated us for prototype implementation for scanning TV
signals present in the vicinity. A variety of ideas has been presented in the literature to utilize
TVWS for different uses such as authors in [8] represented the use of TVWS over CR to setup
a communication system over Smart Grids. Authors in [32] implemented the cellular device to
device communication while utilizing TVWS and proved that TVWS could be the optimal solution
for communication setup without causing interference to the PU of the spectrum. The use of SDR
hardware for channel scanning is also discussed in [33, 34].
A prototype using Labview and NI USRP was implemented in UK to scan 2.4 GHz ISM
band [35]. Microsoft and Google are also studying TVWS. Microsoft has conducted the first
ever study of TVWS under FCC regulations as mentioned in [36]. Another study was done to
study the spectral occupancies in Auckland, New Zealand in which authors study the 806 - 2750
MHz bands [37]. The competitive study of TVWs in other parts of the world is mentioned in [38].
2.7
Summary
In this chapter, the literature related to the research was discussed. The SDR is the enabling
technology to implement the CR in the real world. The CR has four main functions including,
spectrum sensing, spectrum analysis and decision, spectrum management and sharing, and sharing
mobility. Spectrum sensing is the most important feature of the CR. Different spectrum sensing
techniques have been discussed in this chapter. The chapter also illustrated a brief overview about
the CR standard IEEE 802.22. Moreover, the PHY and MAC parameters to design communication
Chapter 3
Research Methodology
3.1
Introduction
TVWS is one of the best candidates as a solution to improve the spectrum efficiency. For this
purpose, extensive research works have been done in [30, 33, 34, 38]. In practice, to implement the
spectrum sensing in real world, three important steps were taken into consideration. These stages
include a spectrum sensing prototype, examining the prototype using simulated signal and finally
examining the prototype in the real world. The proposed methodology is explained in details as
follows:
1. Prototype establishment:
A prototype using USRP 2901 and GNU Radio was developed to capture the
real-time TV signals. These signals were stored in a Data Base (DB).
2. Real-time testing:
The stored data was tested to detect the presence of an incumbent user using various
spectrum detection techniques.
3. Simulated testing:
To test the validity of adopted spectrum sensing techniques, simulated signals such
as ATSC, QAM, PSK, QPSK, etc. were generated using MATLAB and GNU
Ra-dio.
The spectrum sensing techniques were at first tested on simulated signals. These signals were
generated in GNU Radio as well as in MATLAB. This chapter presents the prototype
sig-nals having characteristics similar to TV sigsig-nals such as Quadrature Amplitude Modulated (QAM)
signal, Phase Shift Keying (PSK) modulated signal, Gaussian Minimum Shift Keying (GMSK)
modulated signal and Quadrature Phase Shift Keying (QPSK) modulated signal produced by GNU
Radio is also described in this chapter.
A review of pilot-tone detection scheme and its implementation as well as energy detection
scheme and its implementation are considered. Filter designing technique to implement pilot-tone
detection is also presented. The selected energy detection method for the detection of PU is also
discussed.
The adopted method to test the performance of the proposed prototype is also considered.
3.2
Equipment and Parameters
3.2.1
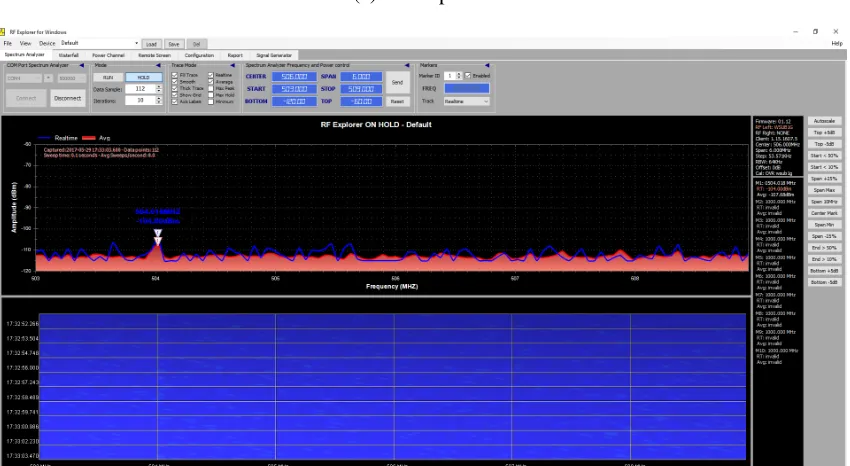
Radio Frequency Explorer
A simple hand held RF explorer as shown in Figure 3.1a was used to observe the spectrum. RF
explorer has a variety of functions including Spectrum Analyzer, RF Generator, Wifi Analyzer, etc.
There are numbers of RF explorer present, but the one which was used to observe the presence
of TV signals in the vicinity has a scanning frequency range between 240 MHz to 960 MHz. In
Figure 3.1b, the observed signal is starting at 513.5 MHz and ending at 519.5 MHz with center
frequency at 516.5 MHz is shown.
Initially, RF explorer was used to observe and record the readings but the readings obtained
cannot be considered reliable enough as the data collected using USRP gave more refined and
(a) RF Explorer
(b) Signal Observation in RF Explorer
Figure 3.1: RF Explorer Hardware and Software Overview
3.2.2
Universal Serial Radio Peripheral
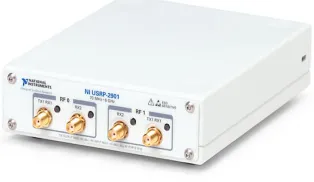
A National Instrument (NI) USRP-2901 has been used to capture the signals in the vicinity. This
unit has a capacity to capture signals ranging between 70 MHz to 6 GHz. It is a 2X2 Multiple
Input Multiple Output (MIMO) device (i.e. it has ports for two receiver antennas, as well as, two
Figure 3.2: NI USRP-2900/2901
The communication applications which can be achieved using this tunable RF transceiver
in-cludes: TVWS, broadcast FM, low-power unlicensed devices (ISM), etc.
3.2.3
Antenna Parameters
The Antenna parameters are given below:
Antenna Resonance
Omni-directional Mobile Antenna 144/440MHz
TV Antenna 500-700MHz
J-Pole Antenna 142MHz
GPS Antenna Model No. GPA-02A
3.2.4
Spectrum Parameters
The spectrum parameters were specified by Industry Canada [39] states the rules to be followed
while working with the TVWS. The TV channels measured in this thesis are from channel 19 to
channel 51 excluding channel 37 which has been preallocated for radio astronomy. The frequency
3.3
Experimental Setup
In this section, the thesis presents the process which was used to sense the UHF TV spectrum bands
in the city of Windsor, Ontario, Canada and discusses some details of the resulting observations.
The sensing platform implemented was composed of an SDR, pythonapplications, GPS mobile
antenna and UHF antenna. The prototype initially was mounted in a vehicle to dynamically detect
spectrum bands, and the collected data is stored both locally and in a remotely located Data Base
(DB).
Analysis of the obtained data exhibits the state of the unoccupied spectrum in the frequency
range from 500 MHz to 698 MHz in the urban area of the city. The frequency range analyzed (500
- 698 MHz) is particularly appealing due to good propagation properties for long range
commu-nications as these channels are widely spread not only in Windsor, ON, but also to the adjacent
areas [40].
3.3.1
Prototype Setup
The purpose of the prototype implementation is to setup a mobile hardware to dynamically sense
and record TVWS in the city. A NI USRP 2901 is employed as the key functional prototype
plat-form component; since this SDR device can provide a high accuracy sensing due to its receivers
low noise figure of 5-7 dB [28]. The proposed measurement setup is divided into as: Data
Col-lection Environment, and Data Visualization. Data ColCol-lection Environment is explained in this
chapter while Data Visualization is part of Chapter 4.
Data Collection Environment
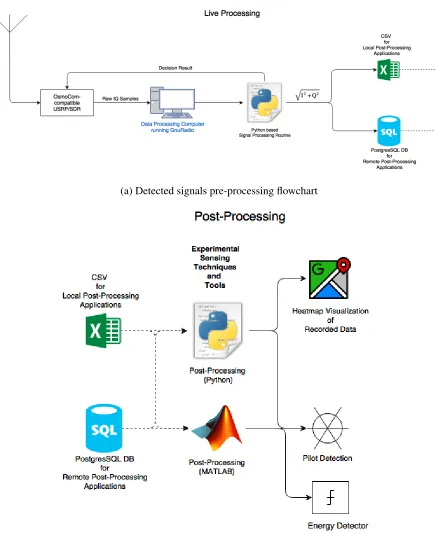
The flowchart of the experimental set-up has been shown in Figure 3.3. The steps of data collection
environment have been explained below:
Hardware setup: The prototype consists of the following hardware elements:
• Dual-Band 2 meters and 70 centimeters mobile antenna.
• GPS-Band active patch antenna model No. GPA-02A.
• WiFi Hotspot for database storage connection.
• Computer running Gnu Radio Python scripts.
Data logging:The proposed algorithm for the signal collection environment is designed as two
Python scripts which were developed to collect, record and report on the details of white spaces in
the band; a script for data capturing and recording and a script to generate heat-map using Google
Maps. The data-logging script is built using the GNU Radio signal processing framework. The
readings are stored in a SQL database as a Comma Separated Values (CSV) file for use in the
post-processing stage.
GNU Radio flow graph: GNU Radio is a software development toolkit which is utilized for
the implementation of SDR and development of signal processing systems. GNU Radio companion
is employed to create the skeleton of the data recorder script. The Osmocom Source block forwards
the unprocessed IQ signal into two different blocks which process the signal further. The Probe
Average Magnitude Squared block turns the incoming IQ stream into an object which is used to
poll and measure various characteristics of the probed signal. This probe is, in turn, invoked using
the Function Probe block. This block invokes a user-specified function and stores the output in a
variable, which can be accessed throughout the Python script. The rate at which this variable is
updated by the function probe block can be specified in the poll rate field of the function probe.
Data Storage: At the completion of each channel hop, the average strength corresponding to a
given channel is recorded into both a CSV file and an online DB as is observed in Figure 3.3. This
data is accessible usingdB HeroSQL database client as well aspgAdmindatabase client. The data
(a) Detected signals pre-processing flowchart
(b) Post-processing flowchart
3.4
Simulated Data Generation
The adopted spectrum sensing techniques have been examined using simulated signals generated
using MATLAB and GNU radio. The generated data has an affiliation with the TV signals. The
modulation schemes used to generate simulated data have been adopted by FCC and Electronics
Communication Committee (ECC) while designing channel parameters for the USA and Europe
respectively.
3.4.1
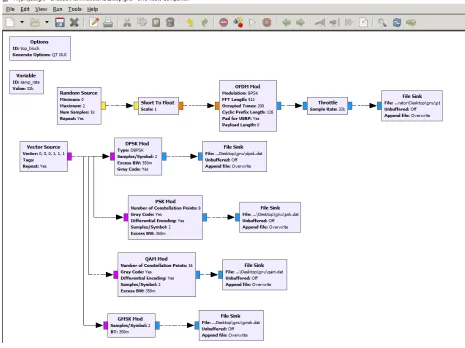
Data Generation using GNU Radio
The following signals have been generated using the software:
• QAM Signal:QAM is a digital modulation scheme. It conveys two analog message
signals, or two digital bit streams, by modulating the amplitudes of two carrier
waves, using the amplitude-shift keying (ASK) digital modulation scheme. The
two carrier waves of the same frequency, usually sinusoids, are out of phase with
each other by 90◦and are thus called quadrature carriers.
QAM is widely used in a digital TV and variety of communication systems [41].
• PSK modulated signal: PSK is the digital modulation technique in which the
phase of the carrier signal is changed by varying the sine and cosine inputs at a
particular time. PSK technique is widely used for wireless LANs, RFID and
Blue-tooth communications.
• GMSK modulated signal: GMSK is a form of modulation used in a variety of
digital radio communications systems. It has advantages of being able to carry
digital modulation while still using the spectrum efficiently. This signal is used in
the variety of communications systems including GSM [42]. This technique is used
• QPSK modulated signal: QPSK allows the signal to carry twice as much
infor-mation as ordinary PSK using the same bandwidth. QPSK is used for satellite
transmission of MPEG2 video, cable modems, video conferencing, cellular phone
systems, and other forms of digital communication over an RF carrier [43].
Figure 3.4 shows the program to generate data for various modulation schemes. A vector
source provides the input signal bits to the modulation blocks. These blocks are further connected
to the file sinks, the blocks in which user allocate the specific location to store the generated data.
The generated files are in the form of.dat extension and can be visualized in Chapter 4.
3.4.2
Data Generation using MATLAB
Another set of data has been generated with the help of MATLAB. The generated signal is
equiv-alent to the ATSC signal but the only advantage of generating this signal is that this user defined
signal attributes are known and hence making it a reliable data set for implementing and testing
spectrum sensing techniques.
Advanced Television Systems Committee TV Signal
Advanced Television Systems Committee (ATSC) defines the standards which are used in modern
day digital Television (DTV) signal transmission. The highlighted aspects of ATSC standards are
given below:
• It uses 8 Vestigial Side Band (VSB) modulation techniques for over-the-air local
broadcast
• It works in VHF, UHF and Super High Frequency (SHF) bands
• ATSC Signals are designed to use the 6 MHz bandwidth
• A 19 kHz pilot signal is added at 0.31 MHz above the lower frequency edge of each
ASTC TV channel band
3.5
Two-step Spectrum Sensing Approach
In Chapter 2, various spectrum detection techniques have been discussed. The matched filter
al-gorithm is the technique with highest Pd and is considered the best technique for analyzing the
presence of an incumbent user. To implement matched filter sensing algorithm, the system must
have complete knowledge about the incoming signal as well as increased computational
complex-ities makes this technique incompetent for our problem.
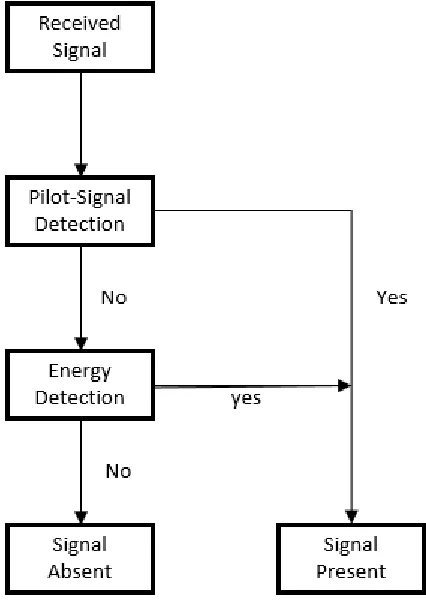
The proposed algorithm in the thesis introduces a combination of two spectrum sensing
presence of a pilot-tone present in the signal. The next step is to estimate the energy of the received
signal. If the first step of the scheme detects the presence of the PU then the system response will
be “incumbent user detected.” If a signal is not detected in the first step, the system will go to the
next step and estimate the energy of the signal, if the estimated energy is above the threshold value
then the presence of incumbent user is declared else, it will assume that there is no user present in
the spectrum. The flowchart in Figure 3.5 explains the user detection in the spectrum.
Figure 3.5: Block Diagram of Two step spectrum sensing Technique
3.5.1
Pilot-Signal Detection
According to the standards given by ATSC, each digital TV channel has an additional pilot
sig-nal present at the beginning of the channel whose magnitude is greater than the average of the
combined signal strength [44]. The ATSC standards specify that each Digital TV (DTV) channel
sur-rounded by a two pilot-tones, one at the beginning and one at the end of the channel. This thesis
focuses on scanning the DTV channels only.
The filter used to detect the presence of a PU in this thesis is a band-pass filter (BPF).
Band pass filter designing
A BPF has been designed to detect the presence of a spectrum user. A BPF is the combination
of a low-pass filter and a high-pass filter and allows a particular set of frequencies to pass while
blocking the remaining set. A highly optimized band-pass filter has the capability to maximize
the number of signals that can be transferred in a system while minimizing the interference among
signals.
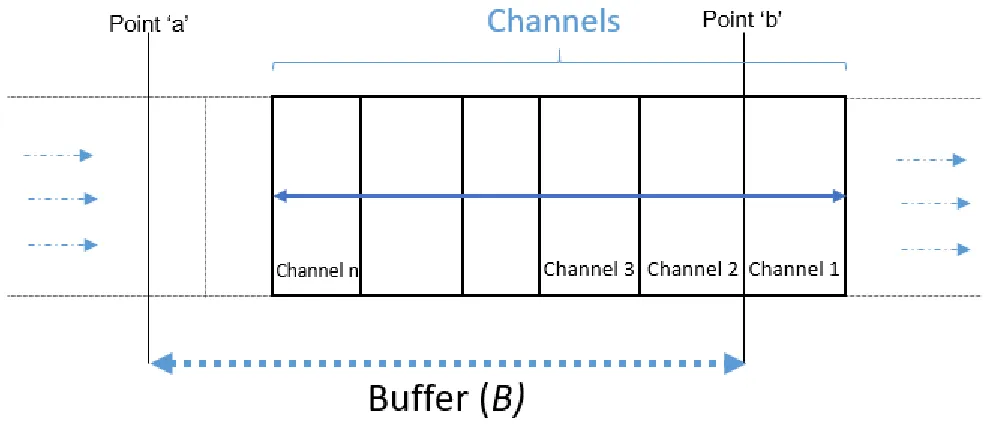
A signal is going to pass through a BPF and this filter will detect the presence of a pilot signal.
A generic concept is shown in Figure 3.6. A channel ranging from one to n, stored in Buffer B
has a starting point at “a” and an ending point at “b,” a channel window containingnchannels is
entering at “a” and going to pass through “b” where there is BPF with a cut-off frequency lying at
f1and f2. The center frequency of the filter is at f0. Thenrepresents the sequence number of each
channel. Each channel is examined individually and presence of signal is detected.
To design a BPF we first need to define:
• Upper cut-off frequency f2: the frequency below which all the frequencies are
passed
• Lower cut-off frequency f1: all the frequencies above this frequency are passed
The critical frequency f0can be calculated by using Equation 3.1.
f0=pf1f2 (3.1)
The bandwidth of the BPF is generated by using Equation 3.2.
BW = f2−f1 (3.2)
A FIR BPF has been designed in MATLAB signal processing toolbox to verify the proposed
algorithm. The results will be demonstrated in Chapter 4. The design algorithm used to design
this FIR filter isKaiser Window. The Kaiser window is an approximation to the prolate-spheroidal
window, for which the ratio of the main-lobe energy to the side-lobe energy is maximized. As
described earlier, the pilot signal of ATSC signal lies at 0.31 MHz and is of 19 kHz bandwidth. The
filter is stopping every frequency before 300 kHz and after 329 kHz. These frequencies have been
selected based on the calculations of given pilot position and its bandwidth. A 10 kHz frequency
is added before and after to avoid miss detection in case if there is any attenuation in the signal.
Figure 3.7: Magnitude Response of Band-pass filter
3.5.2
Energy Detection
Energy detection scheme is the simplest technique to implement as it has the lowest computational
complexity. The primary objective of this scheme is to estimate the energy of the incoming signal.
The binary detection hypotheses of the energy detector have been discussed in Chapter 2.
The detected signals are measured in the form of real-imaginary(I/Q)signals. Since the
num-ber of samples per second is enormous, these signals are first “decimated” at a particular rate.
After finding the amplitude of each signal using Equation 3.3, they are converted in logarithmic
(dB) scale using Equation 3.4 to estimate the signal strength of each channel. The signals are then
stored in the form of a dataset.
Amplitude=pI2+Q2 (3.3)
698 MHz. The average of complete data set for each run is taken overnsamples. This average is
denoted byγ in Equation 3.5 andnirepresents the number of samples.
γ =∑
n i=1ni
n (3.5)
The set is further divided into subsets based on each particular channel data. x in Equation 3.6
represents the sum of Received Signal Strength (RSS) for a particular channel havingn0 number
of samples.λ is the average energy of the channel.
λ = ∑
n0 i=1n0i
n0 , (3.6)
where,n0irepresents the samples of the channel.
The thresholdγ is then compared withλ to verify the test hypothesis. This concept has been
shown in Figure 3.8.
signal detection=
0, λ <γ
1, λ ≥γ
Figure 3.8: Block Diagram of Utilized Sensing Algorithm
3.6
Performance Analysis
The performance of any given sensing scheme is detected by estimating itsPdas well as itsPf.
An-other case is if a signal is not present but is detected then this is missed detection, which contributes
to probability of missed detection (Pm).
Considering the hypothesis given in section 2.3.1,Pd,Pf, andPmcan be perceived as:
i) DeclaringH1underH1hypothesis leads toPd
ii) DeclaringH1underH0hypothesis leads toPf