Volume 8, No. 5, May – June 2017
International Journal of Advanced Research in Computer Science
RESEARCH PAPER
Available Online at www.ijarcs.info
ISSN No. 0976-5697
A
STUDY
AND
ANALYSIS
OF
CLUSTERING
ALGORITHMS
ON
HIV-1
INFECTION
MICROARRAY
DATASET
FOR
FINDING
CLUSTER
WISE
COMMON
GENES
M.S.UMA
DR.R.PORKODI
Research Scholar Assistant Professor
Department of Computer Science Department of Computer Science Bharathiar University Bharathiar University Coimbatore, India Coimbatore, India
Abstract: Data mining refers to collecting or mining knowledge from large amounts of data. It is used in various medical applications like tumor clustering, protein structure prediction, gene selection, cancer classification based on microarray data, clustering of gene expression data, statistical model of protein-protein interaction etc. The analyzing the clustering algorithms phase consist of four clustering algorithms namely K-means, Fuzzy c–means, Hierarchical algorithm and Partitioning Around Medoids(PAM) on HIV – 1 infection effect on macrophages in vitro time course microarray data set. The clustering algorithms are validated using validation measures and based on internal validation measures such as Dunn index, Dunn index 2, Calinski-Harabasz index and Average Silhouette width, the best clustering algorithm out of 4 is to be identified and finally the proposed research work is also to find common genes present in each cluster produced by the four clustering algorithms.
Keywords: Data mining, Microarray, Preprocessing, Clustering algorithm, Finding common genes cluster wise
I. INTRODUCTION
Data mining is often defined as finding hidden information or extracting meaningful information from large database. The aim of data mining is to discover structure inside unstructured data, extract meaning from noisy data, discover patterns in apparently random data, and use all this information to better understand trends, patterns, correlation in existing data [1].Clustering is task of grouping a set of object in such way that objects in the same group called a cluster. Clustering is unsupervised learning problem so as every problem it deals with finding structure in a collection of unlabelled data. This model are sometimes called descriptive model. Clustering is one of the most common untested data mining methods that explore the hidden structures embedded in a dataset. Data Mining is the process of automatic discovery of novel and understandable models and patterns from large amounts of data [2]. Bioinformatics can be defined as the application of computer technology to the management of biological information. It is the science of storing, extracting, organizing, analyzing, interpreting and utilizing information from biological sequence and molecules. The primary goal of bioinformatics is to increase the understanding of biological processes. Bioinformatics is the science of managing, mining, and interpreting information from observations of biological processes [3].
Various genome projects have contributed to an exponential growth in DNA and protein sequence databases, and advance in high-throughput technology such as microarrays and mass spectrometry have further created the fields of functional genomics and proteomics, in which one can monitor quantitatively the presence of multiple gene, proteins, metabolites and compounds in a given biological state [4]. Microarray is used for gene expression analysis. It comprises of a tiny membrane or glass slide having sample of many regularly arranged genes. Microarray analysis can detect thousands of genes in a small sample along with the expression of those genes. Microarray Datasets are often characterized by high-dimensions and small samples [5].
The paper organized as follows: section 1 describes the introduction on data mining, section 2 describes the literature review, section 3 describes the methodology of the proposed work, section 4 describes result and discussion and finally the paper is concluded in section 5.
II. LITERATURE REVIEW
Dhanalakshmi, K, Hannah Inbarani, 2013 [6] has
analysis, Gene expression datasets of four different cancers are chosen such as Breast Cancer, Leukemia, Lung Cancer and Carcinoma Cancer. Cluster gram is used for automatically clusters genes and samples based on gene expression patterns. Proposed algorithm is compared with rough K-means and K-means algorithms. Comparison based on the elapsed time of three clustering algorithms. K- means take less elapsed time compare to other two algorithms. Fuzzy soft Rough K-means has more internal process but presents better results in less time. Number of iterations for convergence rate is reduced with our proposed algorithm (9, 7, 11, and 3 for Leukemia, lung, carcinoma and breast cancer). These two are used for validation measures namely Xie-Beni index and DB-index. In DB index has less value for the proposed algorithm compare to other two clustering algorithms for all datasets (0.0673, 0.0154, 0.1064 and 0.1135 for Leukemia, lung, carcinoma and breast cancer).The Xie-Beni also less with our proposed algorithm (0.3573, 0.0874, 0.2482 and 0.1274 for Leukemia, lung, carcinoma and breast cancer).
Porkodi Rajendran, Deepika Thangavel, 2016 [7]
has presented a work to identify gene enrichment analysis of clustered genes from asthma microarray dataset using k-means clustering algorithm. It follows two strategies that are clustering gene expression profile using K-Means clustering algorithm and conducting Gene Enrichment Analysis using Gene Ontology (GO) to identify the enriched GO terms in each cluster. The microarray dataset contains 41,000 genes and out of that only 9,425 genes. After processing it produces the 3 sets of clusters such as four clusters set, six clusters set and eight clusters set. In the first cluster set with 4 clusters have the number of genes 1720, 2636, 2458 and 2611 respectively. Similarly, the other two cluster sets numbers of genes are identified. The gene enrichment analysis is conducted for each cluster in the cluster set based on top most significant molecular functions GO terms enriched in each cluster.
Yanchi Liu1, Zhongmou Li, et al. 2010 [8] has of
the investigated the validation properties of a suite for 11 existing internal clustering validation measures (RMSSTD, RS,T,CH,I,D,S,DB,XB,SD and S-Dbw) for hard clustering in five different aspects namely monotonicity, noise, density, subclusters and skewed distributions. From the experiment results, most of the existing measures have certain limitations in different application scenarios. Finally, the experiment results show that S-Dbwis the only internal validation measure which performs well in all five aspects, while other measures have certain limitations in different application scenarios, mainly in aspects of noise and sub clusters.
Sarah M. Kim, Matthew I. Pena et al. 2016 [9]
has evaluated the ability of three separate clustering methods like hierarchical, k-means, and k-medoids along with three pair-wise distance measures such as Levenshtein, Jaccard, and n-gram to expertly group lysine, isoleucine, and
3-hydroxypropanoic acid (3-HP) biosynthesis pathways. From the experimental results it analyze that average Silhouette width was also lower for 3-HP (0.12) than for those for lysine (0.55) and isoleucine (0.22). For Silhouette width and to a lesser extent Dunn index, clustering using Jaccard distance had the lowest values across the three pathways. Levenshtein distance showed the most stability, with values above 0.9 across all clustering methods. Isoleucine clusters using n-gram distance showed the most stability, with values close to 0.9. For 3-HP clusters, there was no one distance measure that resulted in high stability values; And conclude that though there was no one combination of clustering methods and distances that performed well across all three example biosynthesis pathways, some clustering methods and distance measures namely hierarchical clustering and Levenshtein distance resulted in clusters that matched the expected external. This suggests that an automated method for grouping pathways is possible because it gives in the form of directed approach.
Eréndira Rendón, et al. 2011 [10] has presented a
presents a comparison between two clustering validity index approaches that are internal and external. For analyses it uses four external indexes (F-measure, NMIMeasure, Entropy, Purity) and six internal indexes (BIC, CH, DB, SIL, NIVA and DUNN). Totally 13 datasets were used, which were clustered using the means and Bissection K-means algorithms. For Bissection K-K-means algorithm using internal indexes, correctly classified group numbers are obtained as 86% of the time, and in 51.9% when external indexes were used. When clusters of the K-means algorithm were clustered using internal indexes as 76.9% of accuracy was obtained and 61.5% with external indexes. From which the internal indexes are more specific in real group number determination than external indexes, or at least with the used datasets.
Satya Chaitanya Sripada, M.Sreenivasa Rao, 2011
[11] has compared the for K-means and Fuzzy C means clustering using the validity measure as Purity and Entropy. It is medical data for evaluating external measures. For the medical data sets the Fuzzy C means and K-means algorithms were framed and the clusters were generated. The values show that the Fuzzy C Means has high value of purity and low value of entropy. This means a good clustering. The K-means has lower value of purity and high value of entropy compared to Fuzzy C Means. The Fuzzy C means clustering is more suited for medical data sets when compared to K means.
III. METHODOLOGY
certain validation measures and based on internal validation measures such as Dunn index, Dunn index 2, Calinski-Harabasz index and Average Silhouette width, the best
clustering algorithm out of 4 is to be identified. Finally the proposed research is also to find common genes present in each cluster produced by the four clustering algorithms.
Fig.1 Methodology of the Proposed Work
A. ataset
The HIV-1 Infection dataset is downloaded from GEO Database Browser and used for the proposed work. The dataset is GEO series with 12625 probe IDs and 16 samples with their corresponding information.
B. Preprocessing
The preprocessing is required to remove noisy data or irrelevant data from the dataset. In addition to that, there are some other preprocessing steps are to be considered based on the type and nature of database. As handling of microarray dataset in R is concerned, there are two steps are important one is converting GEO dataset into Expression set object and the other is to convert expression values in the dataset to log2 normalized form. Then the Proposed research work has done two other preprocessing tasks which are
iltering and standardination. Filtering step to remove genes which are
expressed at low levels or show only small changes in expression. Expression values of genes are standardized to have a mean value of zero and a standard deviation of one.
C. Analyzing clustering Algorithms
This section describes the basic idea behind in k-means, fuzzy c-k-means, hierarchical clustering and PAM.
D. K-means algorithm
numbers of clusters to use. There numbers of clusters to decide which options is the most useful, applicable or interpretable solution..
E. Fuzzy- c-means algorithm
A major problem in applying the FCM method for clustering microarray data is the choice of the fuzziness parameterm. We show that the commonly used valuem= 4 is not appropriate for some data sets, and that optimal values formvary widely from one data set to another. By setting threshold levels for the membership values, genes which are tightly associated to a given cluster can be selected. Using a brain cancer data set as an example, we show that this selection increases the overall biological significance of the genes within the cluster [13].
F. Hierarchical algorithm
Hierarchical of clusters is often graphically represented by a dendrogram A dendrogram captures the process by which a hierarchical clustering is generated by showing the order in which clusters are merged (bottom-up view) or clusters are split (top-down view). One of the attractions of hierarchical techniques is that they correspond to taxonomies that are very common in the biological sciences. Instead, any desired number of clusters can be obtained by ‘cutting’ the dendrogram at the proper level. Also, hierarchical techniques are sometimes thought to produce better quality clusters [14].
G. PAM
The PAM (Partioning Around Medoids) algorithm, also called the K-medoids algorithm, represents a cluster by a medoid. Initially, the number of desired clusters is input and a random set of k items is taken to be the set of medoids. Then at each step, all items from the input dataset that are not currently medoids are examined one by one to see if they should be medoids. That is, the algorithm determines whether there is an item that should replace one of the existing medoids [15].
H. Validating the cluster Results
The evaluation of the performance of the above four algorithm are done using cluster validation measures. In general, clustering validation can be categorized into two classes, external clustering validation and internal clustering validation. The Proposed research work uses four widely
used internal cluster validation measures to validating the results of clustering algorithms.
I. Dunn index
The Dunn index defines the ratio between the minimal intracluster distances to maximal intercluster distance [16].
Dunn index = 𝑑𝑑𝑚𝑚𝑚𝑚𝑚𝑚
𝑑𝑑𝑚𝑚𝑚𝑚𝑚𝑚 (1)
Where dmin denotes the smallest distance between two
objects from different clusters and dmax denotes the largest
distance of two objects from the same cluster. The Dunn index is limited to the interval [0, ∞] and should be maximized.
J. Calinski-Harabasz Index
Calinski-Harabasz Index the math formula to the measure [17]. 𝑆𝑆𝑆𝑆𝐵𝐵
𝑠𝑠𝑠𝑠𝑊𝑊 *
𝑁𝑁−𝐾𝐾
𝑘𝑘−1 (2)
Where K is the number of clusters and N is the total number of observations (data points), SSW is the overall
within-cluster variance equivalent to the total within sum of squares calculated above), SSB is the overall between-cluster
variance.
K. Average Silhouette width
The silhouette width is calculated by averaging all the silhouette values for each pathway, where the silhouette value is calculated using the following function [18].
s(i)=( b(i) - a(i) ) / max( a(i), b(i) ) (3)
Observations with a large s(i) (almost 1) are very well clustered, a small s(i) (around 0) means that the observation between two clusters, and observations with a negative s(i) are probably placed in the wrong cluster.
l. Finding of common genes- cluster wise
The proposed research work takes clustering results produced by all the four specified algorithm as input and identify the common genes present in different clusters of the four clustering algorithm. The four clustering algorithms produced 4 clusters uniformly c1, c2, c3 and c4. Then the common genes present in cluster 1 of all algorithms are identified using the below intersection function.
CommonGene =∑4𝑚𝑚=1 (FCMciՈ KMci Ո HCciՈ PAMci)
Similarly the common genes present in cluster 2, cluster3 and cluster 4 are identified.
IV. RESULTS AND DISCUSSION
A. Result of Preprocessing
The experimental dataset consists of 12625 genes in which 3956 genes are excluded through filtering and 2871 genes are excluded through standardization function.
B. Results of clustering algorithms
Table 1. Clusters by clustering algorithms
Algorithm Cluster 1 Cluster 2 Cluster 3 Cluster 4
K-Means 1356 1131 1326 1985
Fuzzy c-means 1970 815 1481 1532
Hierarchical 2205 1347 1724 522
PAM 2379 1261 1081 1077
C. Result of k-means Algorithm
In Fig. 2, cluster 1 shows the overall picture on how the genes present in this cluster are expressed. It is observed that the genes in this cluster uniformly expressed between -1 and +1 expression pattern. Similarly cluster 2, cluster 3, and cluster 4 has followed the gene expression patterns between -1 and +1, 0 and 1 and -2 & +1 respectively.
[image:5.595.37.288.325.496.2]The 2D representation of k-means clusters solution is depicted in Fig. 3.
Fig. 2 Plotting of Gene Expression Profile by k-means algorithm
Fig. 3 Plotting of Gene Expression Profile by 2D Representation for K-means clusters solution
Result of Fuzzy c-means Algorithm
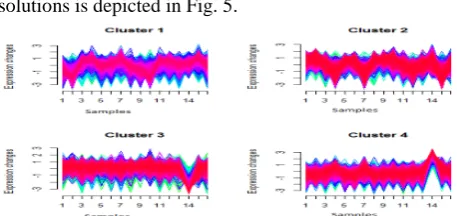
In Fig. 4, cluster 1 shows the overall picture on how the genes present in this cluster are expressed. It is observed that the genes in this cluster uniformly expressed between -1 and +1 expression pattern. Similarly cluster 2, cluster 3, and cluster 4 has followed the gene expression patterns between -1 and +2, -1 and 2 and -2 & +1 respectively.
[image:5.595.319.547.631.733.2]The 2D representation of fuzzy c-means cluster solutions is depicted in Fig. 5.
Fig. 4 Plotting Gene Expression Profile by Fuzzy c-means algorithm.
Fig. 5 Plotting of Gene Expression Profile by 2D Representation for Fuzzy c-means clusters solution
Fig. 6 Plotting of Gene Expression Profile by Hierarchical algorithm cluster dendrogram
D. Result of Hierarchical Algorithm
The genes have been organized into a tree, leaves represent genes and length of the paths between leaves represents distances between genes. Similar genes lie within same subtrees. The number of cluster to be formed is set as four and ward method. The Hierarchical clustering results are shown in dendrogram in Fig. 6.
The 2D representation of Hierarchical cluster solutions is depicted in Fig. 7.
[image:5.595.37.266.662.770.2]E. Result of PAM algorithm
The PAM clustering algorithm has produced four clusters based on Average Silhouette Width. The Cluster 1 grouped 2379 genes of average silhouette width 0.14. Similarly Cluster 2, Cluster 3 and Cluster 4 grouped 1261 genes of average silhouette width 0.11, 1081 genes of average silhouette width 0.09 and 1077 genes of average silhouette width 0.08 respectively as shown in Fig. 8.
The 2D resprentation of partitioning around medoids cluster solutions is depicted in Fig. 9.
[image:6.595.319.559.63.191.2]Fig. 8 Plotting Gene Expression Profile by Partitioning around Medoids(PAM)
Fig. 9 Plotting Gene Expression Profile by 2D Representation for Partitioning Around Medoids (PAM) Clusters solution
F. Result of cluster Validation
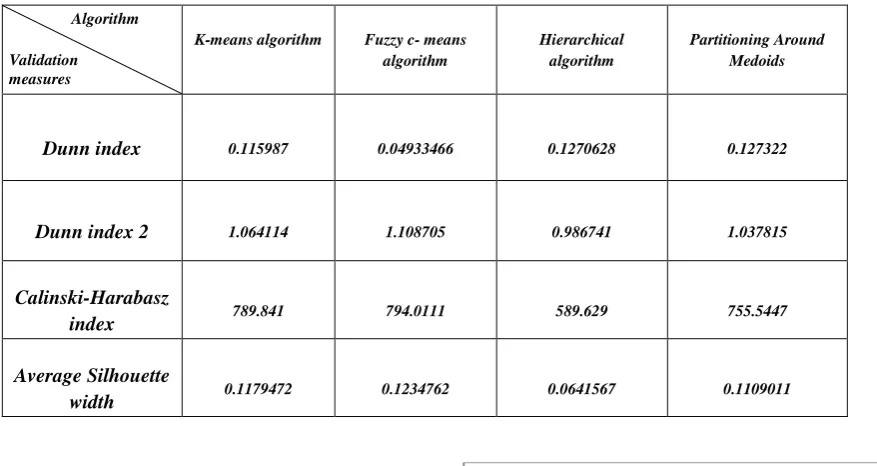
[image:6.595.183.543.345.747.2]The proposed research work has validated the performance of four clustering algorithms using internal cluster validation measures such as Dunn index, Dunn index 2, Calinski-Harabasz index and Average Silhouette width. The result of these validation measures are represented in Table 2 and the same is depicted using bar chart in Fig. 10 (a), (b) & (c).
Table 2. Result of cluster validation measures
K-means algorithm Fuzzy c- means algorithm
Hierarchical algorithm
Partitioning Around Medoids
Dunn index 0.115987 0.04933466 0.1270628 0.127322
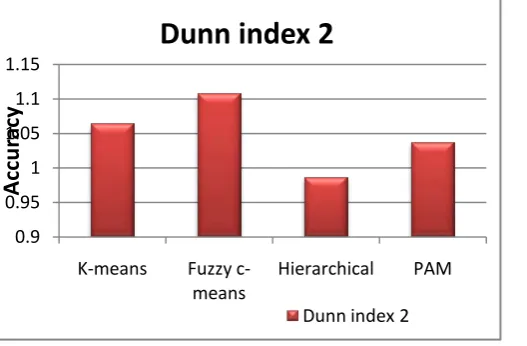
Dunn index 2 1.064114 1.108705 0.986741 1.037815
Calinski-Harabasz
index 789.841 794.0111 589.629 755.5447
Average Silhouette
width 0.1179472 0.1234762 0.0641567 0.1109011
The experiment results are validated using internal validation measures which performs well in all four aspects, while other measures have certain limitations in different clustering algorithms. The best resulted clusters, of the experimental dataset are compared based on compared the high values of Dunn index, Dunn index 2, Calinski-Harabasz index and Average Silhouette width values which
are 0.1270628, 1.108705, 794.0111, and 0.1234762
respectively. From the above inference identified that fuzzy c-means clustering algorithm gives better clustering accuracy then other three clustering algorithms.
Fig. 10 (a) Clustering validation using Dunn index,Average Silhouette 0
0.02 0.04 0.06 0.08 0.1 0.12 0.14
K-means Fuzzy
c-means Hierarchical PAM
Accu
ra
cy
Dunn index
Average Silhouette width Validation
measures
[image:6.595.85.524.350.583.2]Fig.10 (b) Clustering validation using Dunn index 2 Fig.10 (c) clustering validation using Calinski-Harabaz index
Finding of common genes-cluster wise
The common genes present in each cluster of all the four clustering algorithms have been identified using basic
[image:7.595.44.570.54.228.2]intersection function and the result has been tabulated in Table 3.
Table 3. Cluster vs Common genes
Algorithms C1 C2 C3 C4 No. of Common genes
K-means 1356 1131 1326 1985 22
Fuzzy c means 1970 815 1481 1532 0
Hierarchical 2205 1347 1724 522 15
PAM 2379 1261 1081 1077 0
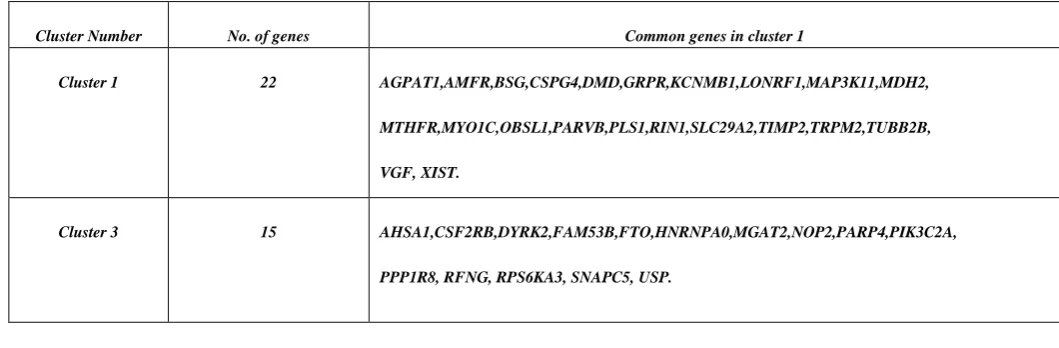
The experimental results of this phase has identified 22 genes as common genes present in cluster 1 of K-means, fuzzy c-means, hierarchical and PAM with its size 1356, 1970, 2205 and 2379 respectively. Similarly 15 genes has been identified as common genes present in cluster 3 of K-means, fuzzy c-means, hierarchical and PAM
with its size 1326, 1481, 1724 and 1081 respectively. The research work has also found that there is no common genes present in cluster 2 and cluster 4 of all the four algorithms. The cluster wise common genes found have been represented in Table 4.
0.9 0.95 1 1.05 1.1 1.15
K-means Fuzzy
c-means Hierarchical PAM
Accu
ra
cy
Dunn index 2
Dunn index 2
0 200 400 600 800 1000
K-means Fuzzy
c-means Hierarchical PAM
Accu
ra
cy
Calinski-Harabasz index
[image:7.595.41.305.55.228.2]Table 4. Common genes in cluster 1 and cluster 3
Cluster Number No. of genes Common genes in cluster 1
Cluster 1 22 AGPAT1,AMFR,BSG,CSPG4,DMD,GRPR,KCNMB1,LONRF1,MAP3K11,MDH2,
MTHFR,MYO1C,OBSL1,PARVB,PLS1,RIN1,SLC29A2,TIMP2,TRPM2,TUBB2B,
VGF, XIST.
Cluster 3 15 AHSA1,CSF2RB,DYRK2,FAM53B,FTO,HNRNPA0,MGAT2,NOP2,PARP4,PIK3C2A,
PPP1R8, RFNG, RPS6KA3, SNAPC5, USP.
V. CONCLUSION AND FUTURE WORK
Data mining in Bioinformatics can be defined as the application of computer technology to the management of biological information. The primary goal of bioinformatics is to increase the understanding of biological processes. The proposed research work consists of four main phases namely preprocessing phase, Analyzing Clustering algorithms phase, validation Phase and Finding of common genes-cluster wise have been successfully implemented in R. The analysing the clustering algorithms phase applied four clustering algorithms namely K-means, Fuzzy c– means, Hierarchical algorithm and Partitioning Around Medoids on HIV – 1 infection effect on macrophages in vitro time course microarray data set. The results of the above clustering algorithms have been validated using certain validation measures and based on these measures; it is found that Fuzzy C-Means clustering algorithm gives better clustering accuracy than the other three clustering algorithms. Finally, the proposed research work have also found common genes present in each cluster of four algorithms.
In future, the research may be extended by considering hybrid approach to improve the clustering accuracy.
REFERENCES
[1] Kaufman, L. and Rousseeuw, P.J. Finding Groups in Data: an Introduction to Cluster Analysis. John Wiley and Sons, 1990.
[2]
concepts and techniques,
[3] Ambroise C and McLachlan, G (2002), “Selection bias in gene extraction on the basis of microarray gene-expression data”, Proc Natl Acad Sci U S A 99(10):6562–6.
[4] Alberts B, Johnson A, Lewis J, Raff M, Roberts K and Walter P (2002), “Molecular Biology of the Cell. Garland Publishing, New York, fourth edition.
[5] Pan W (2002),“A comparative review of statistical methods for discovering differentially expressed genes in replicated microarray experiments, “Bioinformatics 18(4):546–554.
[6] Dhanalakshmi, K., and H. Hannah Inbarani. "Fuzzy soft rough K-Means clustering approach for gene expression data." arXiv preprint arXiv:1212.5359 (2012).
[7] Rajendran, Porkodi, and Deepika Thangavel. "Clustering of Microarray Data to Identify Enriched Go Terms of Genes in Severe Asthma Dataset using Gene Enrichment Analyze." Indian Journal of Science and Technology 9.8 (2016).
[8] Yanchi Liu1,2, Zhongmou Li2, Hui Xiong2, Xuedong Gao1, Junjie Wu3 Understanding of Internal Clustering Validation Measures 2010 IEEE International Conference on Data Mining.
[9] Sarah M., Kim Matthew, I. Penam, Mark Moll George Giannakopoulos George N. Bennett, Lydia E. Kavraki, "An Evaluation of Different Clustering Methods and Distance Measures Used for Grouping Metabolic Pathways,” To appear in the Proc. of the Eighth Intl. Conf. on Bioinformatics and Computational Biology (BICoB 2016).
[10] Eréndira Rendón, Itzel Abundez, Alejandra Arizmendi
and Elvia M. Quiroz, “Internal versus External cluster validation Indexes, "International Journal of Computers and Communications Issue 1, Volume 5, 2011.
[11] Satya Chaitanya Sripada., Dr. M.Sreenivasa Rao,
"Comparison Of Purity And Entropy Of K-Means Clustering And Fuzzy C Means Clustering, "Indian Journal of Computer Science and Engineering (IJCSE)
[12] Hamerly G, Elkan C. (2002),
the eleventh international conference on Information and knowledge management (CIKM).
[13] J. C. Bezdek (1981), "Pattern Recognition with Fuzzy
[14] Ward, Joe H. (1963), "Hierarchical Grouping to Optimize an Objective Function", Journal of the American Statistical
Association. 58 (301): 236–244.
[15] H.S. Park, C.H. Jun, “A simple and fast algorithm for
K-medoids clustering”, Expert Systems with Applications, 36, (2) (2009), 3336–3341.
[16] Dunn 1974, Dunn J. (1974), "Well separated clusters
and optimal fuzzy partitions. Journal of Cybernetics ,4, 95-104.
[17] Calinski RB, Harabasz J A, “dendrite method for cluster
analysis”, Communications in Statistics 1974, 3:127.
[18] Rousseeuw 1987, Rousseeuw, P.J, (1987), " Silhouettes