Volume 5, No. 3, March-April 2014
International Journal of Advanced Research in Computer Science
RESEARCH PAPER
Available Online at www.ijarcs.info
New Linkage Learning Technique in Genetic Algorithm for Stock Selection
R.Lakshmi
Assistant Professor, CSE
Pondicherry University Karaikal Campus, India
K.Vivekanandan
Professor, CSE
Pondicherry Engineering College Puducherry, India
S.Amilan
Associate Professor
Dept. of Commerce, Pondicherry University Karaikal Campus, India
Abstract: In the present paper the researchers develop a new Linkage Learning method draws its concept from machine learning approach and incorporated it with the existing Genetic Algorithms, which would identify a stock with better performance among the given number of stocks. This new Linkage Learning Genetic Algorithm uses historical\fundamental financial indicators and price information of stock trading. Using that information the process would find a stock that can be graded for its performance based on the expected returns. In several studies on stock market the problem of identifying the good stock have been solved by Hidden Markov Model, Artificial Neural Network, Simulated Annealing and Simple Genetic Algorithm. However the linkage Learning Genetic Algorithm has not been applied in the area of stock market for the problem dealt in the present study. Therefore an attempt has been made to use this new Linkage Learning process to identify high quality stocks with investment value using financial indicators. Experimental results with real data from the Indian Stock Market reveal that the Linkage Learning Genetic Algorithm for stock selection leads to better results.
Keywords: Linkage Learning, Association Rule Learning, Genetic Algorithms, Stock performance forecast.
I. INTRODAUCTION
Genetic Algorithm (GA) is based on the survival-of-the-fittest [1] fashion by gradually manipulating the potential problem solutions to obtain the more superior solutions in population. Genetic Algorithms have been proved to be efficient in handling complex NP-Hard problems in the recent past. A wide variety of Genetic Algorithms have been devised to solve a range of problems. A lot of works have already been done towards effectively using GA to solve such problems. Genetic algorithms differ from each other in terms of solution representation, genetic operators used, termination criteria, etc. These existing algorithms, in no way, mark an end of the search for a better Genetic Algorithm. Therefore, there is always a scope for further improvement of these Genetic Algorithms. Genetic algorithms work very well if the genes belonging to the same building block are tightly linked together within the chromosome. Otherwise, if these genes are spread all over the chromosome, building blocks are very hard to be created and easy to be destroyed by the recombination operator.
Genetic algorithms cannot perform well under such circumstances. Traditional genetic algorithms suffer from the linkage problem and they are unable to learn the linkage among genes. Traditional genetic algorithms require the users to possess prior domain knowledge of the problem so that the genes on chromosomes can be correctly arranged with respect to the chosen operators. When problem domain knowledge is available, the problem can be solved easily using traditional genetic algorithms with an appropriate chromosome representation. However, when that knowledge is not available, one way to handle the problem is to make the GA capable of adapting and learning the linkages that exist within the chromosome.
There is several linkage learning techniques [1], [2], [3], [4] available in the field of genetic algorithm. Linkage
learning in GAs is the process of grouping together functionally (epistatically) dependent subsets of genes. Genetic (also known as Physical) linkage [2] is a measure of distance between the loci of two or more specific functionally dependent genes and this is the same as what the biological world commonly interprets the linkage to be. Linkage does not necessarily mean the genetic linkage, any representation of the functional dependency between two or more genes, can be considered as a representation of linkage. In line with the above approaches, a new Linkage Learning method called Association Rule Learning (ARL) [3] [4] [5] has been developed and employed in the Indian Stock Market to find out the stocks which are worthy of investments. The Linkage Learning method used in the study tries to identify the linkage between the selected financial indicators and the performance of the stock in the form of stock returns are given in the following sections.
Section 2 describes the variables used in the stock selection. Section 3 explains the GA approach for stock selection. Section 4 describes the proposed work of this study applied to stock selection. Section 5 discusses the experimental results obtained for 100 companies stock.
II. VARIABLESUSEDINSTOCKSELECTION
rank is considered as the best stock among the given stocks and the stocks which are in lower order of ranks are considered as poorer in performance [8] [9].
For the purpose of ranking the stocks, the following financial indicators representing the Profitability, Liquidity, Solvency and so on are employed as input factors as influencing variables keeping the Annual Price Return as the influenced variable. Using these influencing and influenced variables the linkage among these two sets are identified by the proposed system. The important financial indicators which are used as influencing variables are Price to Earnings ratio, Book Value per Share, Current Ratio, Earnings per Share andPrice to Book Valueratio.The influenced variable in the system is Annual Price Return which is calculated by using the adjusted share prices of the selected sample companies.
The Annual Price Return (APR) from a company’s equity share is calculated by using the following formula. Adjusted Pricei March, t – Adjusted PriceApril, t-1 APR = ---
Adjusted Pricei April, t-1 Where,
Adjusted Pricei March,t indicates the Adjusted price of the ith Company in the month of March of the year ‘t’.
Adjusted Pricei April, t-1 is the Adjusted price of the ith Company in the month of April of the year ‘t-1’.
The Price to Earnings ratio is an important ratio which indicates the power of the company to increase the price of the equity share with the given EPS. If the value of P/E ratio is high then company equity share price would increase at the higher level than a company with low PE ratio keeping other factors unaltered.
Book Value of a company’s share is representing the asset base available for an equity share of the company as per the accounting records. Higher the Book Value of a share indicates the strength of the share.
Price to Book ratio is a ratio which measures the Price of the company’s share in terms of the Book value per share of the company. This ratio is a vital ratio to measure the financial strength of the company since the ratio indicates the price level change as and when the book value changes. If the ratio is high then the company share prices would increase at a high rate for a given change in the Book Value per Share.
In finance literature the liquidity of a company would always be treated as a crucial factor for determining the financial strength of the company. The liquidity is normally measured using Current Ratio. This ratio is calculated dividing the Total Current Assets by the total current liability of the company. That is,
Current Assets Current Ratio = --- Current Liabilities
EPS is the direct measure of the profit that indicates the profit that can be made available to the share holders after paying the interest to the lenders of the company and tax to the government. Therefore higher the EPS better is the financial strength of the company. The EPS is calculated as, Profit after Tax available to the share holders
EPS = --- Number of Shares
This EPS value has been calculated as a percentage of the face value. Using the above mentioned variables the
proposed LLGA identifies the stocks which are investment-worthy.
III. GENETICALGORITHMAPPROACHFORSTOCK
SELECTIONPROBLEM
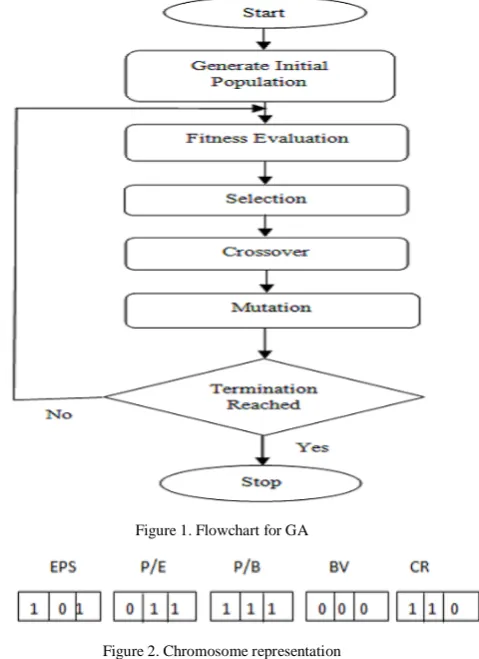
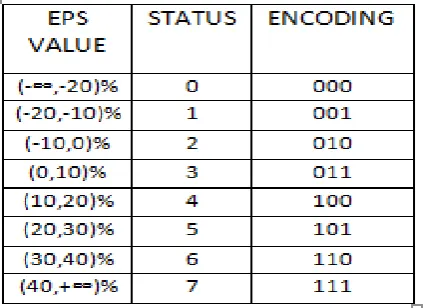
The working principle of genetic algorithm is given in figure 1. To solve any problem algorithmically, the input variables have to be efficiently defined. In GA once the input parameters are defined, it should be properly encoded or represented known as chromosome representation which is shown in figure 2. In the present study of stock selection each chromosome has five input parameters namely Price to Earnings ratio, Book Value per Share, Current Ratio, Earnings per Share and Price to Book Valueratio. They are taken as five genes in a chromosome and represented in octal binary encoding having three single bits of each gene as illustrated in figure 2
Figure 1. Flowchart for GA
Figure 2. Chromosome representation
In GA the first step is creating an initial population which consists of a given number of chromosomes generated randomly. In this paper, the initial population of the genetic algorithm is generated by encoding five input variables. For each input variable, we design eight statuses representing different qualities in terms of different range of values varying from 0 (extremely poor) to 7 (extremely good), which are shown in table 1. After generating the initial population, the ensuing work is to evaluate the fitness of each and every chromosome. The devise of the fitness function is a vital process in GA, which determines what a GA should optimize [10].
Table 2: Associated Relationship B/W Variables and APR Value
In the present study the fitness function has been used [5] using Ranking of the selected sample companies and the error rate calculation.
IV. PROPOSEDSYSTEMOFASSOCIATIONRULE
LINKAGELEARNINGINSTOCKSELECTION
The proposed linkage learning [16] [17] process draws its concept from machine learning approach [5] [11]. Machine learning is a branch of artificial intelligence [24]. Machine learning has the ability to learn the study of any systems without being explicitly programmed. In this paper, a new linkage learning process uses a popular machine learning approach known as Association Rule Learning which finds relations between variables (data) in large databases. In stock selection the input variables are defined as N = {EPS, P/E, BVPS, P/B, CR} and their association rule is
{EPS, P/E, BVPS, P/B, CR} {APR}
would indicate the relationship between the financial indicators such as EPS, P/E, BVPS, P/B, CR and the APR which is shown in table 2. The APR value is dependent value and it is associated with the financial indicators kept in the left hand side of the rule. For example higher the financial indicators increase company’s performance in terms of annual return. In this problem, the ARL method reads the values of financial indicators and their APR values of all companies. Based on their values, the proposed system assigns statuses to each financial indicator. The status of each parameter has also been used to derive the status of the APR. Once the status is identified by the ARL, it categorizes the parameters into three groups. Financial indicators having statuses from 0 to 3 are kept in group 1, statuses from 4 to 5 are kept in group 2 and statuses from 6-7 are kept in group 3. Their APR statuses are classified as low (L), medium (M) and high (H). The parameters EPS and P/E are the highly
influencing variables which influence the APR value. Applying the rule of confidence on table 2 i.e whenever the ratio is high the APR is also high. Using such information decision can be made on stock ranking by the Association Rule Learning Technique.
After evolving the fitness function of the population, the better chromosomes with higher fitness value are selected using roulette wheel selection method. Following that crossover operators are applied and generated offspring for the next generation. This paper employs two point crossover method [13] [14] [15] which randomly selects two crossover points within the chromosome and swaps the genes within the crossover sites to produce offspring which is shown in figure 3.
Figure 3. Chromosomes in CrossOver Operation
After the crossover operation, the chromosomes are mutated using one’s complement multi point mutation technique which randomly selects genes and complement from either ‘0’ to ‘1’ or ‘1’ to ‘0’ and produce a mutated offspring shown in figure 4. The obtained offspring from selection technique, crossover operation and mutation are kept in the next generation. The above GA process is continued till the termination criteria are met. That is, the final generation will be judged once the optimized results are obtained.
Figure 4. Chromosome in Mutation
From the process of GA optimization, the stocks are ranked. Now the linkage learning GA learns the status of APR and its corresponding financial indicators of all companies and advices the investors to invest their shares in top most ranked companies which are likely to have good performance.
V. EXPERIMENTALANALYSIS
The data for the experimental analysis have been collected from “PROWES”, a database of Centre for Monitoring Indian Economy, India. The sample data have been collected for a period from April 2007 to March 2013. This data have been collected for 100 companies randomly selected from the list of 200 companies used for calculating S&P BSE 200 Index. This index is a broad based index used to represent the market movements in the Bombay Stock Exchange (BSE).
Table 3: Experimental Setup
GA Parameters Values and Methods
Population Size 100
Selection Elitism method
Selection Rate 10 %
Mutation Binary Inversion Mutation
Mutation Rate 10%
Crossover Two Point Binary Crossover
The table 3 shows the genetic parameters used in the implementation. The population size is 100 and the elitism selection whereby the selection rate is 10% is used to select the highly fit financial indicators to the subsequent generation in order to obtain optimal annual returns. Association rule learning method will read the values of financial indicators and the APR values of the selected companies. Using the appropriate linear relationship (derived from the rule of confidence) between the values of financial indicators on one hand and the values of APR on the other hand, stock performance has been identified. That is the status of a company’s financial indicators is falling in the higher group which leads the APR to be in the higher status. Based on their statuses the system predicts the stock’s performance in the order of which is having better ranking among the given number of stocks. In this study the Fitness function/Evaluation function, the Root Mean Square Error (RMSE) [10] between the derived ranking and the actual ranking of each stock is calculated to check the accuracy of the proposed system. The derived ranking of 100 companies is found using the proposed linkage learning system which uses the concept of Association Rule Learning approach. Experimental outcomes have been collected for 10 runs and the mean of 10 runs are used in the graph to show the efficiency of the system.
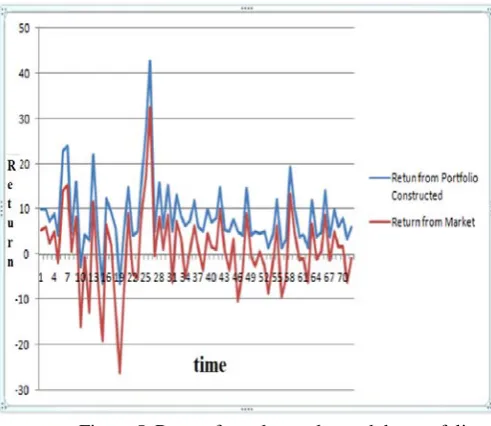
Based on the system generated ranks, a portfolio of top ranking ten scrips in each period was constructed as a portfolio. This portfolios return was calculated as equally weighted stocks portfolio. Then this return was compared with the benchmark portfolio return calculated using NSE
NIFTY index as the representative of market. In the comparison, it is found that in all periods the constructed portfolio outperformed the market with higher returns than the market return. The each period’s return from the constructed portfolio and the return from the market are exhibited in a graph given in figure 5.
Figure 5. Return from the market and the portfolio constructed
In the present study linkage learning process which uses Association Rule Learning Technique to identify the best performing stocks in the market has been used. The proposed technique has identified the best performing stocks which outperformed the market. This has been proved in the real-time data collected from the Indian popular and very old Stock Market, Bombay Stock Exchange. Thus it is concluded that the proposed LLGA techniques can be applied in the stock performance prediction also.
VI. ACKNOWLEDGMENT
The suggestions and motivation of Dr. K.Vivekanandan, Professor of Computer Science, Pondicherry Engineering College, Puducherry, India and Dr.S.Siva Sathya, Associate Professor, Department of Computer Science and Engineering, Pondicherry University, Puducherry, India are gratefully acknowledged..
VII.REFERENCES
[1] Davis L. “Handbook of Genetic Algorithms” Van
Nostrand Reinhold, 1991.
[2] Abhishek Singh, Goldberg, D. E., & Chen, Y.-p,
“Modified linkage learning genetic algorithm for difficult non-stationary problems”, in Proceedings of Genetic and Evolutionary Computation Conference (GECCO-2002), pp. 419–426, 2002
[3] Association rule learning from Wikipedia.
[4] Yogesh Singh et al., "A review of Studies on Machine
Learning Techniques", IJCSS, Vol. I, issue I.
[5] Jeff Bowes, Eric Neufeld, Jim E. Greer and John Cooke, “A
Comparison of Association Rule Discovery and Bayesian
Network Causal Inference Algorithms to Discover Relationships in Discrete Data”.
[6] M. Munetomo and D. E. Goldberg, “Identifying linkage by
non-linearity check”, IlliGAL Report No. 98012, University of Illinois at Urbana-Champaign, Urbana, IL, 1998.
[7] Arthur L. Corcoran, Roger L. Wainwright, “Reducing
disruption of superior building blocks in genetic algorithms”, Proceedings of the, ACM SIGAPP Symposium on Applied Computing February, 2003.
[8] Shin-Shou Chen, Chien-Feng Huang, Tzung-Pei Hong, “ A
Multi-objective Genetic Model for Stock Selection”, The 27th Annual Conference of the Japanese Society for Artificial Intelligence, 2013M.
[9] Shahram Gtion of ilaninia, et.al, “An Application of Genetic
Algorithms(GA) on the IRON Stock Market”, ISSN 1818 – 4952, World Applied Sciences Journal 14(6): 842-849, 2011.
[10] Chengxiong Zhou, Lean Zhou, et.al “Selecting Valuable
Stock Using Genetic Algorithm”, pp. 688–694, 2006. © Springer-Verlag Berlin Heidelberg 2006.
[11] Jochen Hipp et.l, “Algorithms for Association Rule Mining –
[12] Goldberg, D. E., “An analysis of a reordering operator with tournament selection on a GA-hard problem”, Lecture Notes in Computer Science (LNCS), 2723, pp. 825–836, 2009.
[13] P. Larra˜ naga, et. Al, “Genetic algorithms for the Travelling
Salesman Problem: A Review of Representations and Operators”, Artificial Intelligence Review, 1999.
[14] Mustafa Kaya. (2011). The effects of two new crossover
operators on genetic algorithm performance. Applied Soft Computing, Elsevier, Vol. 11 pp. 881–890.
[15] R. Lakshmi, Dr. K. Vivekanandan, “Heuristics Based
Learning on Human Psychology “, IJCA, ISSN 0975 – 8887, Feb 2013.
[16] Chuang, C.-Y., & Chen, Y.-p, “Linkage identification by
perturbation and decision tree induction”, In Proceedings of IEEE Congress on Evolutionary Computation (CEC 2007), EI, pp. 357–363, 2007R. Nicole, “Title of paper with only first word capitalized,” J. Name Stand. Abbrev., in press.
[17] R.Lakshmi, K.Vivekanandhan, R.Brintha, “A New
Biological Operator in Genetic Algorithm for Class Scheduling Problem”, IJCA, Volume . 60, ISSN 0975 – 8887, Issue 12,December 2012.
[18] David R. Newman. The Use of Linkage Learning in Genetic
Algorithm.
[19] R. Lakshmi, Dr. K. Vivekanandhan, “Interference Induced
Silencing In Travelling Salesperson Problem Using Linkage Learning Genetic Algorithm”,IJESR, Volume.3,Issue-3, ISSN 2277-2685, March 2013.
[20] Ganesh Bonde, Rasheed Kaled, “Stock price prediction using
genetic algorithms and evolution strategies”.
[21] R. Lakshmi, K. Vivekanandan, “Gene Silencing in Linkage
Learning GA”, National Conference on Future Computing (NCFC 2012), Pondicherry University, India.
[22] R. Lakshmi, Dr. K. Vivekanandan, “An Analysis Of
Recombination Operator in Genetic Algorithms”, IEEE International Conference on Advance Computing (ICoAC
2013, MIT, Chennai, India (Awarded Best Paper).
[23] R. Lakshmi, K. Vivekanandan, “Performance Analysis Of
Linkage Learning Techniques In Genetic Algorithms”, IJRET, Volume 02, issue: 12 EISSN: 2319-1163 | PISSN: 2321-7308, Dec 2013.
[24] H. Goto, Y. Hasegawa, and M. Tanaka, “Efficient