Page 1 of 14
Epigenetic landscape analysis of lncRNAs in acute myeloid
leukemia with DNMT3A mutations
Yu-Jun Dai1,2,3#, Fang Hu1,2,3#, Si-Yuan He4#, Yue-Ying Wang5
1Department of Hematologic Oncology, Sun Yat-sen University Cancer Center, Guangzhou 510000, China; 2Center State Key Laboratory of Oncology in South China, Guangzhou 510000, China; 3Collaborative Innovation Center for Cancer Medicine, Guangzhou 510000, China; 4The University of Texas MD Anderson Cancer Center UTHealth Graduate School of Biomedical Sciences, Houston, TX 77030, USA; 5State Key Laboratory of Medical Genomics, Shanghai Institute of Hematology, RuiJin Hospital, Shanghai Jiao Tong University School of Medicine, Shanghai 200025, China
Contributions: (I) Conception and design: YJ Dai; (II) Administrative support: YY Wang; (III) Provision of study materials or patients: YJ Dai, F Hu, SY He; (IV) Collection and assembly of data: F Hu, SY He; (V) Data analysis and interpretation: YJ Dai, F Hu, SY He; (VI) Manuscript writing: All authors; (VII) Final approval of manuscript: All authors.
#These authors contributed equally to the work.
Correspondence to: Yu-Jun Dai. Department of Hematologic Oncology, Sun Yat-sen University Cancer Center, Guangzhou 510000, China.
Email: dgzx16@163.com; Yue-Ying Wang. State Key Laboratory of Medical Genomics, Shanghai Institute of Hematology, RuiJin Hospital, Shanghai Jiao Tong University School of Medicine, Shanghai 200025, China. Email: wyymoon@hotmail.com.
Background: Acute myeloid leukemia (AML) is a type of cancer that consists of a group of hematological malignancies with high heterogeneity. DNA methyltransferase 3A (DNMT3A)-mutated AML patients have a poor prognosis. Some long non-coding RNAs (lncRNAs) have been reported to enhance therapeutic sensitivity, and so could affect the overall survival rate of elderly cytogenetically normal acute myeloid leukemia (CN-AML) patients; however, studies on the lncRNA signature in DNMT3A-mutated AML are rare.
Method: The DNMT3A R878H conditional knock-in mouse model was constructed to explore the lncRNAs of DNMT3A mutation by using the Cuffcomparison method. Cis and trans regulation networks were used to predict candidate genes. The expression levels in leukemic cell lines and the prognostic index of these candidate genes were analyzed with the Broad Institute Cancer Cell Line Encyclopedia (CCLE) and OncoLnc databases. The data for each sample were statistically analyzed using GraphPad Prism.
Results: In this study, we applied the DNMT3A R878H conditional knock-in mouse model to explore the lncRNA epigenetic landscape of DNMT3A mutation by using the Cuffcomparison method. Twenty-three differentially expressed lncRNAs were identified in Dnmt3aR878H/WTMx1-Cre+ mice. We next predicted the downstream targetable genes regulated by these lncRNAs through cis and trans regulation networks and found 124 candidate genes are related to these lncRNAs. In further analysis of 124 genes, we found that increased mRNA expression levels of interleukin 1 receptor type 2 (IL1R2), Krüppel-like factor 13 (KLF13), ATPase H+ transporting V1 subunit A (ATP6V1A), proteasome 26S Subunit, non-ATPase 3 (PSMD3), and pyrroline-5-carboxylate reductase 2 (PYCR2) were associated with poor prognosis in AML. Functional analysis of these genes demonstrated that the pathways involved in autophagy, cell cycle, and hematopoietic stem cell differentiation were more enriched in Dnmt3aR878H/WTMx1-Cre+ mice.
Conclusion: Our study was the first to use DNMT3A R878H conditional knock-in mouse model to predict the specific lncRNAs regulated by the DNMT3A mutation in AML. Six candidate genes were found to be associated with DNMT3A mutation with poor prognosis. Our results provided a possible treatment strategy for this disease.
Keywords: LncRNA; DNMT3A R878H; knock-in mice; RNA-seq
Page 2 of 14
Introduction
DNA methylation, as one of the most important modification methods in epigenetics, plays a key role in the regulation of an organism’s life. The mutation frequency of DNA methyltransferase 3A (DNMT3A) has been found to be 22.1% in acute myeloid leukemia (AML) (1,2). It has been reported that AML cases with DNMT3A mutations are often accompanied by other genetic or epigenetic abnormalities, with nucleophosmin 1 (NPM1) mutations (nearly 69.6%) being the most frequent ones. Meanwhile, MLL abnormalities are likely exclusive to DNMT3A mutations. The NPM1 gene, which is also one of the most common mutation genes in AML, carries the normal karyotype, with an incidence of approximately 35. NPM1 mutation is considered to be a relatively favorable prognostic factor in young AML patients but indicates poor survival in older AML patients (3). Studies have shown that DNMT3A mutations could be a prognostic factor in NPM1-mutated AML with remission (4-6).
DNMT3A and DNA methyltransferase 3 B (DNMT3B)
jointly control the modification of DNA. They are highly expressed in early mammalian embryos and are gradually down-regulated with cell differentiation, but their expression is low in mature adult tissues (7,8). Animal models have shown that when DNMT3A is knocked out during the embryonic stage, mice display growth retardation, dysplasia, and other phenomena, and die by 4 weeks of age (9). DNMT3A also plays an important role in maintaining the function of germline stem cells. Knock-out of DNMT3A in mouse germ stem cells can cause extensive hypomethylation in the mouse genome and lead to genetic imprinting disorder, spermatogenesis, development disorders, and embryo death in mice (10,11). DNMT3A is also a necessary protein for hematopoietic stem cells (HSCs) to maintain their normal proliferation and differentiation function (12,13). Studies have indicated that conditional knockout of DNMT3A in mouse HSCs impairs the self-renewal ability of HSCs and destroys their directional differentiation potential (14-16).
As a new mechanism of epigenetic litter control, n c R N A h a s b e c o m e a t o p i c a l i s s u e i n m o d e r n oncology research. Like many other solid tumors,
the occurrence of hematological malignancies is a disorder of multiple intracellular molecules and multiple links. Studies have shown that long non-coding RNAs (lncRNAs) can control the development of tumors, and notch receptor 1 (NOTCH1) has been shown to regulate the expression of several lncRNAs in T-cell acute lymphoblastic leukemia (17). A total of 48 lncRNA patterns have been identified that can predict response to standardized therapy and overall survival in elderly patients with CN-AML (18). Hughes found that in AML patients with a CCAAT enhancer-binding Protein Alpha (CEBPA) mutation, the expression of lncRNA Urothelial Cancer-Associated 1 (UCA1) was specifically up-regulated, and cell proliferation could be maintained by inhibiting the expression of cell cycle regulator p27kip1 (19). The expression of lncRNA Nuclear Paraspeckle Assembly Transcript 1 (NEAT1) in acute promyelocytic leukemia (APL) samples was significantly down-regulated compared with a normal control group and was inhibited by the PML/ RARa fusion gene (20). The expression profiles of lncRNAs are related to the recurrent mutation, clinical features, and prognosis of AML (21). Some of these lncRNAs may play a functional role in leukemia formation (22).
Adult leukemia with a DNMT3A mutation is mostly insensitive to chemotherapy and has a low remission rate, which is now known as a special subtype of acute leukemia. Thus, our study aimed to explore the specific lncRNAs expressed in DNMT3A-mutated leukemia based on a
DNMT3A mutant mouse model, and analyze the clinical
prognosis of its target genes.
Methods
The c-bio portal and metascape analysis
The cBioCancer Genomics Portal was used to analyze the genetic landscape of the DNMT3A mutation in The Cancer Genome Atlas (TCGA) AML samples. Detailed clinical information and genetic alternations of DNMT3A were provided by this cancer genomic dataset, including 225 tumor research papers. Functional analysis was performed using a web-based portal called Metascape. Clusters enriched terms into groups and were divided by functional Submitted Dec 07, 2019. Accepted for publication Feb 04, 2020.
doi: 10.21037/atm.2020.02.143
annotation and the P value. Cytoscape software was used to visualize the network results.
Construction of Dnmt3aR878H/WTMx1Cre+ mice
Dnmt3a R878H conditional knock-in mice were generated through recombineering by targeting PL253 vectors, as previously reported (23). Polymerase chain reaction (PCR) analysis was performed with specific primers (Table 1) to detect the genotype of the offspring. Next, we activated the mutant Dnmt3a protein by intraperitoneal injection with pIpC 4 weeks after birth. The mice were bred based on animal care standards, and all operations were approved by the Committee on Animal Use for Research at the Shanghai Jiao Tong University School of Medicine (23). All experiments were performed following guidelines and regulations of the Shanghai Jiao Tong University School of Medicine, China.
RNA-sequence
RNA was extracted from the bone marrow cells of Dnmt3aR878H/WTMx1Cre+ and Dnmt3aWT/WTMx1Cre+
mice using the standard protocol of TRIzol-isopropanol precipitation. The libraries were prepared according to the manufacturer’s instructions (Illumina’s TruSeq RNA Sample Preparation Kit, version 2) as follows:
Step 1. Magnetic oligo-dT was utilized for pulling down the poly-A RNA from the bulk RNA of mice;
Step 2. mRNA was segmented by metal-ion-catalyzed hydrolysis;
Step 3. cDNA was synthesized for a-tailing and subsequent ligation of adapters.
The quality of samples was examined using a 2100
Bioanalyzer and then sequenced by Illumina MiSeq with a 200-bp paired-end. All the experiments were performed by colleagues at the Shanghai Institute of Hematology, Rui-Jin hospital of Shanghai Jiao Tong University School of Medicine.
Prediction of lncRNA
The Cuffcomparison method was used to compare
Cufflinks splicing results without reference to annotations,
and unknown annotations were obtained. To match the new transcripts and extract (i, u, x), 3 types of transcripts for prediction of lncRNA, we achieved the following parameters:
Step 1. Transcription length ≥200 bp and exon ≥2;
Step 2. Predicted ORF <300 bp;
Step 3. Pfam, CPC, and CNCI prediction— the intersection of the prediction results. A CPC score <0 and CNCI score <0 were selected, with Pfam being significantly higher than that of other transcripts as potential lncRNA;
Step 4. By comparing with unknown lncRNA, the same sequence of unknown lncRNA was removed. i: A transfrag falling entirely within a reference intron; u: Unknown, intergenic transcript; x: Exonic overlap with reference on the opposite strand.
Prediction of lncRNA target genes
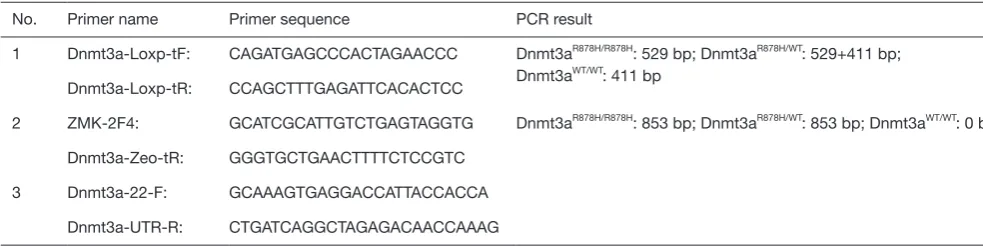
[image:3.595.45.537.95.218.2]Trans-regulation and cis-regulation were used to predict target genes. We chose genes with a distance of less than 10 kb without lncRNA as the target gene for cis regulation. Trans-prediction uses a murine mRNA database. The blast was used to select the complementary analogous sequence, Table 1 Primers for identifying genotype of mice
No. Primer name Primer sequence PCR result
1 Dnmt3a-Loxp-tF: CAGATGAGCCCACTAGAACCC Dnmt3aR878H/R878H: 529 bp; Dnmt3aR878H/WT: 529+411 bp;
Dnmt3aWT/WT: 411 bp
Dnmt3a-Loxp-tR: CCAGCTTTGAGATTCACACTCC
2 ZMK-2F4: GCATCGCATTGTCTGAGTAGGTG Dnmt3aR878H/R878H: 853 bp; Dnmt3aR878H/WT: 853 bp; Dnmt3aWT/WT: 0 bp
Dnmt3a-Zeo-tR: GGGTGCTGAACTTTTCTCCGTC
3 Dnmt3a-22-F: GCAAAGTGAGGACCATTACCACCA
Page 4 of 14
RNA plex (24) was used to calculate the complementary energy between the 2 sequences, and the sequences above the threshold were selected for further analysis.
OncoLnc and CCLE analysis
OncoLnc is a comprehensive interactive web server that contains the gene expression data of tumors and normal samples from the TCGA projects. The patients were divided into 2 groups according to the median expression of candidate genes. Next, we used Kaplan-Meier and log-rank methods to analyze the overall survival by the OncoLnc dataset (http://www.oncolnc.org/). The expression data of cell lines with DNMT3A mutation with/without NPM1 mutation was analyzed using the Broad Institute Cancer Cell Line Encyclopedia (CCLE) dataset.
Statistical analysis
The experiment was carried out in triplicate. The data for each sample was statistically analyzed using GraphPad Prism 8.0 (GraphPad Software Inc., San Diego, CA, USA). The P value was calculated by comparison of means (t-test).
Results
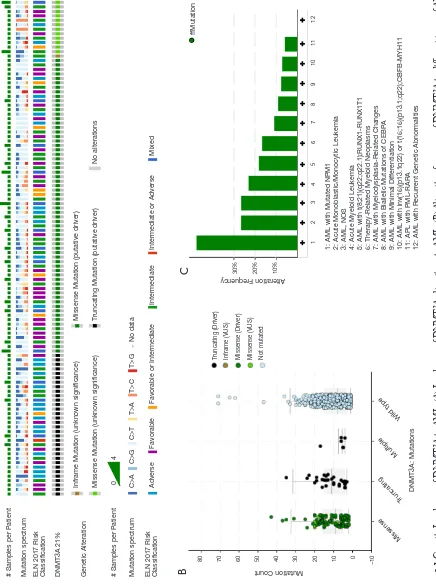
Genetic landscape of DNMT3A in acute myeloid leukemia It is widely recognized that DNMT3A plays an important role in hematopoiesis and tumorigenesis. To explore the genetic landscape of DNMT3A in AML, we analyzed the DNMT3A alterations using cBioPortal for acute myeloid leukemia (OHSU, Nature 2018) and found that DNMT3A was altered in 114 samples from 531 patients with AML (21%). Among the DNMT3A alterations, the majority were missense mutations (putative driver, R882) and truncating mutations (putative driver) (Figure 1A). The genetic landscape also contained 1 unknown significant inframe mutation (Q573_A575del) and 15 missense mutations with unknown significance, including G543C, N879D, G543D, R309G, V657M, L3440, V657M, F751L, V716D, N879D, R659H, K826M, G570E, R326C, and F755S. The European Leukemia Net (ELN) risk classification (European leukemia net, 2017) and the mutation spectra of these AML patients were exhibited in Figure 1A. The
mutation count of DNMT3A in patients for these 4 different mutation types was also displayed (Figure 1B). Then, the detailed cancer types with DNMT3A alternations were further analyzed. Among all these different types, the AML type with mutated NPM1 contained the most mutations, with a nearly 50% (47.65%) alteration frequency. The second and third types of AML were acute monoblastic/monocytic leukemia (26.67%) and AML NOS (26.58%), respectively. A certain percentage of DNMT3A alterations occurred in AML with RUNX1-RUNX1T1 (18.18%), therapy-related myeloid neoplasms (16.67%), AML with myelodysplasia-related changes (10.94%), AML with biallelic mutations of CEBPA (9.09%), AML with minimal differentiation (7.69%), AML with CBFB-MYH11 (7.14%), APL with PML-RARA (5.88%), and AML with recurrent genetic abnormalities (0%) (Figure 1C).
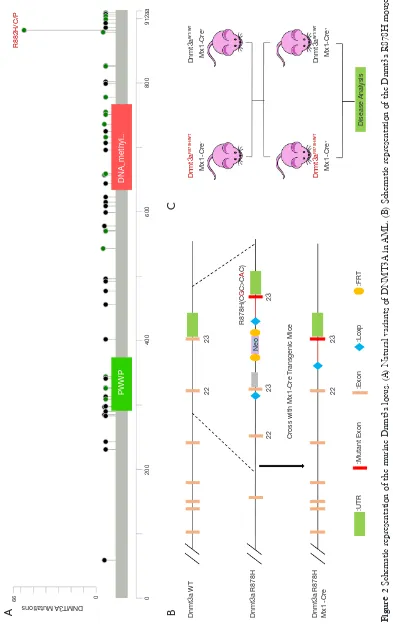
Construction of the Dnmt3a R878H mouse model
DNMT3A consists of 3 main domains: the PWWP domain, the ADD domain, and the C-terminal catalytic domain, with the vast majority of mutations occurring mainly in the C-terminal catalytic domain (Figure 2A). To further explore the functional mechanism of the putative driver missense mutation DNMT3A-R882H, we used a mouse model that was reported previously to express the mutant Dnmt3a R878H through Cre-mediated splicing endogenously. Mice with an IFN-inducible Mx1 promoter (Mx1Cre), which is specifically expressed in the hematopoietic system, were crossed with Dnmt3a mutant mice, and then we used pIpC to replace the endogenous Dnmt3a exon 23 and induce the expression of Dnmt3a R878H (Figure 2B). Finally, we used the Dnmt3aR878H/WTMx1-Cre+ mice and Dnmt3aWT/WT
Mx1-Cre+ mice for further functional analysis (Figure 2C).
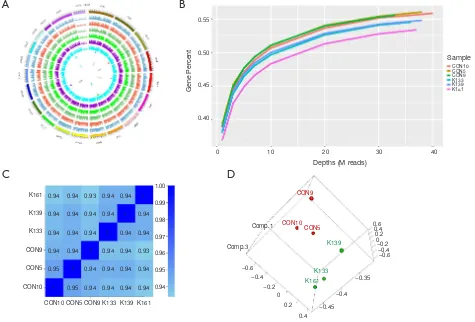
RNA-sequence of Dnmt3a R878H mice
To explore the function of the DNMT3A mutation in mice in detail, we performed RNA-seq of the BM cells of Dnmt3aR878H/WTMx1-Cre+ mice and Dnmt3aWT/WT
Mx1-Cre+ mice ON Miseq. TopHat’s spliced mapping algorithm
Figure 1
Genetic Landscape of DNMT3A in AML. (A) Landscape of DNMT3A alterations in AML. (B) Alteration frequency of DNMT3A in differen
t types of AML. (C)
The mutation counts of DNMT3A alterations in AML.
A
B
C
# Samples per Patient Mutation spectrum DNMT3A 21% Genetic Alteration
No alterations
Adverse Favorable Favorable or Intermediate Intermediate Interm
ediate or Adverse Mixed
Inframe Mutation (unknown significance) Missense Mutation (putative dr
iver)
Missense Mutation (unknown significance) T
runcating Mutation (putative driver)
# Samples per Patient 0 4
C>A C>G C>T T>A T>C T>G No data
Mutation spectrum ELN 2017 Risk Classification
ELN 2017 Risk Classification Mutation Count
DNMT3A: Mutations
Missense Truncating Multiple
Wild type
80 70 60 50 40 30 20 10 0 −10 Truncating (Driver) Inframe (VUS) Missense (Driver) Missense (VUS) Not mutated
1: AML with Mutated NPM1 2: Acute Monoblastic/Monocytic Leukemia 3: AML, NOS 4: Acute Myeloid Leukemia 5: AML with t(8;21)(q22;q22.1);RUNX1-RUNX1T1 6: Therapy-Related Myeloid Neoplasms 7: AML with Myelodysplasia-Related Changes 8: AML with Biallelic Mutations of CEBP
A
9: AML with Minimal Dif
fer
entiation
10: AML with inv(16)(p13.1q22) or t(16;16)(p13.1;q22);CBFB-MYH11 11: APL with PML-RARA 12: AML with Recurr
ent Genetic Abnormalities
Alteration Frequency
ffMutation
30% 20% 10%
Page 6 of 14
Fi
gu
re
2
Sc
he
ma
tic
re
pr
es
en
ta
tio
n o
f t
he m
ur
in
e Dn
mt
3a
lo
cu
s.
(
A
) Na
tu
ra
l v
ar
ia
nts
of
DN
MT3
A i
n AM
L.
(B
) S
ch
ema
tic r
ep
re
sen
ta
tion
o
f t
he
Dnm
t3
a R
87
8H m
ou
se
model. (C) Diagram of the breeding of Dnmt3a
R878H/WT
Mx1-Cre
+ mice.
B
PWWP
DNA_methyl..
DNMT3A Mutations
Dnmt3a WT Dnmt3a R878H Dnmt3a R878H Mx1 -Cr
e
:UTR :Mutant Exon :Exon :Loxp :FR
T
22 23
22 23 23
22 23
Neo
Cr
oss with Mx1-Cr
e T
ransgenic Mice
Disease Analysis
R882H/C/P
R878H(C
G
C>C
A
C)
Dnmt3a
R878H/WT
Dnmt3a
WT/WT
Mx1-Cr
e
-
Mx1-Cr
e
+
Dnmt3a
R878H/WT
Dnmt3a
WT/WT
Mx1-Cr
e
+
Mx1-Cr
e
+
66 0 0 200
400 600
800 912aa
A
B
[image:6.595.50.443.86.715.2]circle in the graph in Figure 3 is the genome, and each circle in the graph represents the chromosome coverage of a sample (Figure 3A). Satisfaction analysis displayed that the number of genes detected increased with the increase in sequencing (Figure 3B). To compare the gene expression levels between different genes and different samples, reads of sequences were transformed into fragments per kilobase of the exon model per million mapped reads (FPKM) to standardize the gene expression levels. Next, we checked the relationship between samples using the
correlation coefficient (Figure 3C) and principal component
analysis (Figure 3D). Both these methods demonstrated that the similarity between the murine samples was high, with correlation coefficients being over 0.9, indicating the experimental reliability and rationality of the sample
selection.
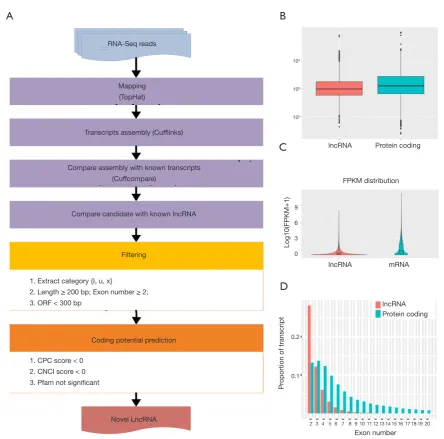
Prediction of new lncRNAs by RNA-Seq in mice
[image:7.595.59.534.86.408.2]Numerous studies have shown that lncRNA plays an important role in tumorigenesis and development by regulating gene expression through chromatin modification and transcriptional regulation. In our study, Cuffcomparison was used to compare the splicing results of Cufflinks without reference to annotations, and new transcripts with unknown annotation matching were obtained. Three types of transcripts (i, u, x) were extracted to predict the lncRNAs. Then, we used the Perl script to find the corresponding gene on the chromosome of the new lncRNAs (Figure 4A). In addition, we compared the structure of the lncRNAs with Figure 3 RNA-seq of Dnmt3a R878H mice. (A) Genome coverage map of RNA-seq data of Dnmt3aR878H/WTMx1-Cre+ mice and Dnmt3aWT/WTMx1-Cre+ mice. (B) Saturation cryptanalysis to detect the amount of sequenced data. (C) Heatmap map of gene expression correlation, the numerical value refers to the correlation coefficient. (D) Sample PCA map based on gene expression of Dnmt3aR878H/WTMx1-Cre+ mice and Dnmt3aWT/WTMx1-Cre+ mice.
A
B
C
D
Gene Per
cent
Depths (M reads)
Comp.3
−0.6 −0.4
−0.2 0
0.2
−0.4
K161 K133
K139
CON5 CON9
CON10
−0.35 −0.4
−0.6 −0.2 0 0.2 0.4 0.6
−0.45 0.4 Comp.1
0.94
0.94
0.94
0.94
0.95
1 0.94
0.94
0.94
0.94
1
0.95 0.93
0.94
0.94
1
0.94
0.94 0.94
0.94
1
0.94
0.94
0.94 0.94
1
0.94
0.94
0.94
0.94 1
0.94
0.94
0.93
0.94
0.94
Sample CON10 CON5 CON9 K133 K139 K161
0.55
0.50
0.45
0.40
K161
K139
K133
CON9
CON5
CON10
1.00
0.99
0.98
0.97
0.96
0.95
0.94
0 10 20 30 40
Page 8 of 14
Figure 4 Prediction of new lncRNA in Dnmt3a R878H mice. (A) New lncRNA prediction process. (B) Length distribution of lncRNA and mRNA. (C) Comparison of exon numbers of lncRNA and mRNA. (D) Comparison of expression levels of lncRNA and mRNA.
that of the RNA. We observed no significant difference in transcription length (Figure 4B), exon number (Figure 4C), or expression level (Figure 4D) between the lncRNAs and RNAs.
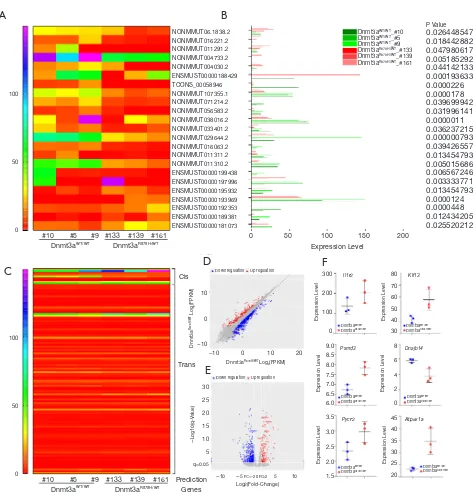
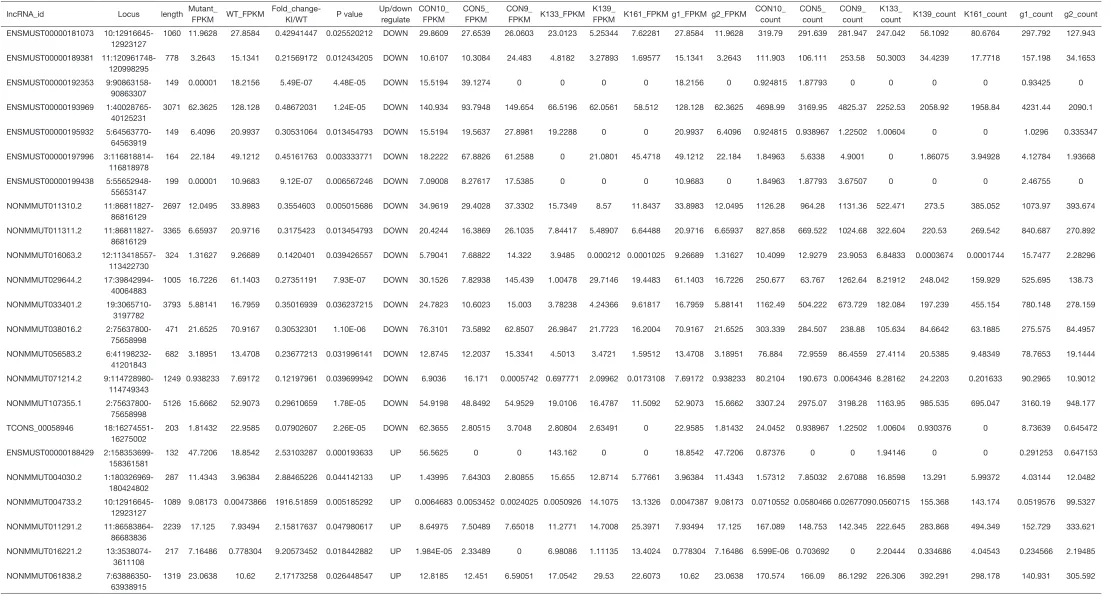
We further used Cuffdiff to analyze differential lncRNAs among samples and identified 23 differentially expressed lncRNAs in Dnmt3aR878H/WTMx1-Cre+ mice (
Figure 5A and
Table S1). The expression of these differentially expressed
lncRNAs was shown using the expression value of the
samples and the P values, as shown in Figure 5B and Table S1. The trans-regulation and cis-regulation systems were used to predict the target genes regulated by differential lncRNAs of the Dnmt3a mutation. In total, we found 11 candidate genes through the cis-regulation system and 113 target genes through the trans-regulation system (Figure 5C). Next, we examined differences in the expression levels of these candidate genes between Dnmt3aR878H/WTMx1-Cre+
mice and Dnmt3aWT/WTMx1-Cre+ mice. EdgeR was used
A
C
B
D
lncRNA Protein coding
Log10(FPKM+1)
Pr
oportion of transcript
lncRNA mRNA FPKM distribution
Exon number
2 3 4 5 6 7 8 9 10 11 12 13 14 15 16 17 18 19 20 lncRNA Protein coding RNA-Seq reads
Mapping (TopHat)
Transcripts assembly (Cufflinks)
Compare candidate with known lncRNA
Filtering
Coding potential prediction
Novel LncRNA 1. Extract category {I, u, x}
2. Length ≥ 200 bp; Exon number ≥ 2; 3. ORF < 300 bp
1. CPC score < 0 2. CNCI score < 0 3. Pfam not significant
Compare assembly with known transcripts (Cuffcompare)
104
103
102
9
6
3
0
0.2
Figure 5 Prediction of candidate genes in Dnmt3a R878H mice. (A) Heatmap map of predicted new lncRNAs in Dnmt3aR878H/WTMx1-Cre+ mice and Dnmt3aWT/WTMx1-Cre+ mice. (B) The expression levels of these lncRNAs. P value was displayed on the right side of the figure. (C) Heatmap map of candidate genes expressed in Dnmt3aR878H/WTMx1-Cre+ mice and Dnmt3aWT/WTMx1-Cre+ mice by cis and trans regulation. (D) Express correlation scatter plot of RNA-seq. (E) Differential Gene Volcano Map. Red indicates up-regulation of differentially expressed genes and blue indicates down-regulation of differentially expressed genes. (F) The expression levels of candidate genes of Dnmt3aR878H/WTMx1-Cre+ mice and Dnmt3aWT/WTMx1-Cre+ mice.
A
B
C
D
E
F
Dnmt3a R878H/WT Log 2 (FPKM) Expr ession Level Expr ession Level Expr ession Level Expr ession Level Expr ession Level Expr ession Level − Log10(q-V alue)Dnmt3aR878H/WT Log
2(FPKM) Il1r2 Psmd3 Pycr2 Klf13 Dnajb14 Atp6v1a q=0.05 Log2(Fold-Change)
Down regulation Up regulation
Dnmt3aWT/WT Dnmt3aR878H/WT Dnmt3aWT/WT Dnmt3aR878H/WT Dnmt3aWT/WT Dnmt3aR878H/WT Dnmt3aWT/WT Dnmt3aR878H/WT Dnmt3aWT/WT Dnmt3aR878H/WT Dnmt3aWT/WT Dnmt3aR878H/WT Down regulation Up regulation
NONMMUT06.1838.2 NONMMUT016221.2 NONMMUT011291.2 NONMMUT004733.2 NONMMUT004030.2 ENSMUST00000188429 TCONS_00058946 NONMMUT107355.1 NONMMUT071214.2 NONMMUT056583.2 NONMMUT038016.2 NONMMUT033401.2 NONMMUT029644.2 NONMMUT016063.2 NONMMUT011311.2 NONMMUT011310.2 ENSMUST00000199438 ENSMUST00000197996 ENSMUST00000195932 ENSMUST00000193969 ENSMUST00000192353 ENSMUST00000189381 ENSMUST00000181073 P Value 0.026448547 0.018442882 0.047980617 0.005185292 0.044142133 0.000193633 0.0000226 0.0000178 0.039699942 0.031996141 0.0000011 0.036237215 0.000000793 0.039426557 0.013454793 0.005015686 0.006567246 0.003333771 0.013454793 0.0000124 0.0000448 0.012434205 0.025520212
Dnmt3aWT/WT_#10
Dnmt3aWT/WT_#5
Dnmt3aWT/WT_#9
Dnmt3aR878H/WT_#133
Dnmt3aR878H/WT_#139
Dnmt3aR878H/WT_#161
100 50 0 100 50 0 10 0 −10 300 200 100 0 80 70 60 50 40 30 8 6 4 2 0 45 40 35 30 25 20 9.0 8.5 8.0 7.5 7.0 6.5 6.0 3.5 3.0 2.5 2.0 1.5 30 25 20 15 10 5
−10 0 10 20
−10 −5 FC=−2 0 FC=2 5 10
#10 #5 #9 Dnmt3aWT/WT
#10 #5 #9 Dnmt3aWT/WT
#133 #139 #161 Dnmt3aR878H/WT
#133 #139 #161 Dnmt3aR878H/WT Prediction Genes Trans Cis Expression Level
Page 10 of 14
to analyze the different genes among the samples and obtain the correction of the P value posterior multiple hypothesis tests. We then determined the P value threshold by controlling the false discovery rate (FDR). The scatter map of gene expression (Figure 5D) and the volcanic map of the differential genes (Figure 5E) showed the up-regulated genes (red plot) and down-up-regulated genes (green plot) in Dnmt3aR878H/WTMx1-Cre+ mice compared with
Dnmt3aWT/WTMx1-Cre+ mice. Next, the prognostic values
of these candidate genes were analyzed through the OncoLnc dataset, and 13 genes were found to be closely related to the prognosis of AML (Tables S2,S3). Taken together, the results above indicate that only 6 genes were both differentially expressed in Dnmt3aR878H/WTCre+ mice
and associated with the prognosis of AML. Therefore, we chose only these 6 genes among the predicted candidate genes. The expressions of these differentially expressed candidate genes were further validated using the expression value of the murine samples (Figure 5F).
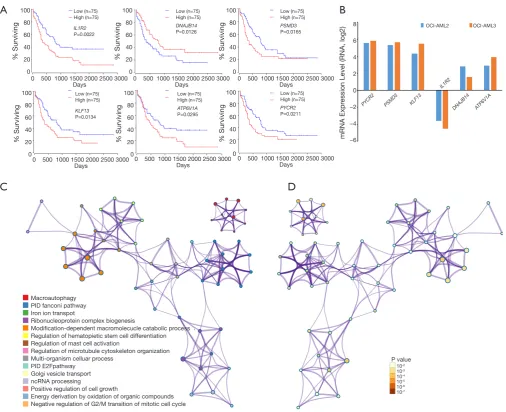
Prognosis and functional analysis of candidate genes in AML
We then explored the efficiency of these candidate genes in the survival of patients with AML. Oncolnc tools were used to analyze the survival of patients with AML. The Kaplan-Meier curve and log-rank test analyses revealed that increased IL1R2 (P=0.0022), KLF13 (P=0.0134), ATP6V1A
(P=0.0295), PSMD3 (P=0.0165), and PYCR2 (P=0.0211) mRNA levels were significantly associated with poor prognosis in terms of overall survival (OS) of AML patients
(Figure 6A). Decreased Dnaj heat shock protein family
(Hsp40) member B14 (DNAJB14) mRNA levels also had a tendency to indicate a poor prognosis, with P=0.0126. Next, we chose two cell lines OCI-AML3 (harboring DNMT3A R882C mutation and NPM1 mutation) and OCI-AML2 (harboring DNMT3A R635W mutation) and attempted to explore the expression level of these dysregulated genes in human AML patients cell lines with NPM1 and/or DNMT3A mutations. The results based on CCLE showed that most of these dysregulated genes showed greater expression in OCI-AML3 cells compared with OCI-AML2 cells (Figure 6B). Functional analysis of these target genes was performed using Metascape tools, and the significant terms
were identified and then hierarchically clustered into a tree based on κ-statistical similarities (Figure 6C,D,Table 2).
Discussion
DNMT3A gene mutations occur in a variety of hematopoietic
diseases. The mutation rate in adult AML is more than 20%, and 10–15% in myelodysplastic syndrome (MDS). The loss
of DNMT3A was clinically observed to be associated with
a variety of hematological malignancies (25-27). However, the detailed mechanism of leukemogenesis associated with DNMT3A mutations was not clear.
Increasing evidence has shown that lncRNAs can promote or inhibit the growth of tumors by regulating or maintaining gene expression. Abnormal expression of lncRNA often leads to the occurrence, development, and metastasis of tumors (18). It has been reported that HOX antisense intergenic RNA (HOTAIR) exhibits a significant positive correlation with DNMT3A (28). The lncRNA H19 plays a crucial role in the initiation and progression of cancers, while the overexpression of H19 in AML patients has a strong positive association with DNMT3A mutations. Patients with a high expression level of H19 have shown a lower complete remission (CR) rate compared with those patients with low expression (29). Furthermore, the molecular dynamics analysis of lncRNA demonstrated that some lncRNAs could integrate with the promoter of the 5‘-UTR and recruit DNMT3A protein. The complex could then methylate the target genes, leading to epigenetic alternation (30). In this study, we focused on those lncRNAs related to hematological tumors to fully understand the mechanism of these lncRNAs in diseases; we hope our findings will lead to new ideas for the research, diagnosis, and prognosis of hematological tumors.
To further explore those lncRNAs regulated by
DNMT3A mutations, we used the DNMT3A mutation
homologous lncRNAs by comparing the ID or whole-genome pairwise alignment (hg19/mm10, whole-genome.UCSC. edu) of these lncRNAs in murine and human samples. Meanwhile, because of the rapid evolution and highly non-conservative characteristics of lncRNA, we were unable to match the murine lncRNAs with human lncRNAs, which prevented us from comprehensively evaluating the expression of these lncRNAs in databases in human AML patients (31).
According to this finding, we identified the differentially
expressed lncRNAs in Dnmt3a mutant mice and predicted their downstream target genes based on cis- and trans-regulation. Indeed, more than 6 genes, including Il1r2,
Klf13, Psmd3, Dnajb14, Pycr2, and Atp6v1a, were aberrantly
[image:11.595.46.553.81.493.2]regulated by the DNMT3A R878H mutation and suggested a poor prognosis. The functional analysis demonstrated that these genes are associated with macro-autophagy, iron ion transport, hematopoietic stem cell differentiation, and the cell cycle, which are, in turn, closely related to the occurrence and development of hematological malignancies. Figure 6 Prognosis and functional analysis of these candidate genes in Dnmt3a R878H mice. (A) The prognostic values of the predicted genes regulated by these lncRNAs in Dnmt3aR878H/WTMx1-Cre+ mice and Dnmt3aWT/WTMx1-Cre+ mice. (B) The expression level of the six
candidate genes in OCI-AML3 cells and OCI-AML2 cells based on the CCLE dataset. The significant terms among the candidate genes
(metascape) according to its functional term (C) and P value (D).
% Surviving
% Surviving
% Surviving
% Surviving
% Surviving
% Surviving mRNA Expr
ession Level (RNA, log2)
Low (n=75) High (n=75) Low (n=75) High (n=75) Low (n=75) High (n=75) Low (n=75) High (n=75) Low (n=75) High (n=75) Low (n=75) High (n=75) IL1R2 P=0.0022 KLF13 P=0.0134 DNAJB14 P=0.0126 ATP6V1A P=0.0295 PSMD3 P=0.0165 PYCR2 P=0.0211 PYCR2
OCI-AML2 OCI-AML3
PSMD3 KLF13 DNAJB14 ATP6V1A IL1R2 100 80 60 40 20 0 100 80 60 40 20 0 Macroautophagy PID fanconi pathway Iron ion transpot
Ribonucleoprotein complex biogenesis
Modification-dependent macromolecucle catabolic process Regulation of hematopietic stem cell differentiation Regulation of mast cell activation
Regulation of microtubule cytoskeleton organization Multi-organism celluar process
PID E2Fpathway Golgi vesicle transport ncRNA processing
Positive regulation of cell growth
Energy derivation by oxidation of organic compounds Negative regulation of G2/M transition of mitotic cell cycle
8 6 4 2 0 −2 −4 −6 100 80 60 40 20 0 100 80 60 40 20 0 100 80 60 40 20 0 100 80 60 40 20 0 10-2 10-3 10-4 10-5 10-6 10-7
0 500 1000 1500 2000 2500 3000 Days
0 500 1000 1500 2000 2500 3000 Days
0 500 1000 1500 2000 2500 3000 Days
0 500 1000 1500 2000 2500 3000 Days
0 500 1000 1500 2000 2500 3000 Days
0 500 1000 1500 2000 2500 3000 Days
P value
A
B
Page 12 of 14
Consistent with our result, the immune microenvironment-related gene, IL1R2, is known to be associated with a poor prognosis of AML and lung cancer in TCGA and Gene Expression Omnibus (GEO) datasets (32,33). In addition, a hormone-sensitive patient-derived xenograft (PDX) model showed that Krüppel-like factor 1 (KLF1) was related to the hormone sensitivity in acute lymphoblastic leukemia (34). ATP6V1A was a critical gene related to autophagy, which can induce autophagy through binding with a small-molecule compound EN6 and activating the mTOR signaling pathway (35). PSMD is considered an important cancer-related gene in the NF-kb pathway, which was shown to be consistently activated in Sezary Syndrome (36). Furthermore, some studies indicate that the single-nucleotide polymorphism (SNP) variations of PSMD3 in European individuals are related to the number of immune cells in peripheral blood and inflammatory diseases such as asthma (37). However, the roles of PYCR2 and DNAJB12 in hematopoietic malignancies have not been widely studied, although PYCR2 has been associated with proteomic subgrouping and reported to be involved in metabolic reprogramming of hepatocellular carcinoma with hepatitis B infection (38). As an ER J-protein, DNAJB14 accelerates
the degradation of membrane proteins to maintain homeostasis (39). Our study is the first to report that the decreased expression of DNAJB14 is associated with the poor prognosis of AML.
Conclusions
In conclusion, we found the specific lncRNAs regulated
by DNMT3A mutations using a DNMT3A R878H
knock-in mouse model and predicted the candidate genes
influenced by these lncRNAs. These findings might provide
information relevant to the future development of novel therapeutics targeting these special lncRNAs and candidate genes for DNMT3A-mutated leukemic cells.
Acknowledgments
We would like to thank Editage for their English language editing services. We specially thank all of our colleagues at Shanghai Institute of Hematology for constructing the animal model and technical help.
[image:12.595.45.549.95.378.2]Funding: This work was supported by the National Natural
Table 2 Ontology pathway analysis of targetable genes
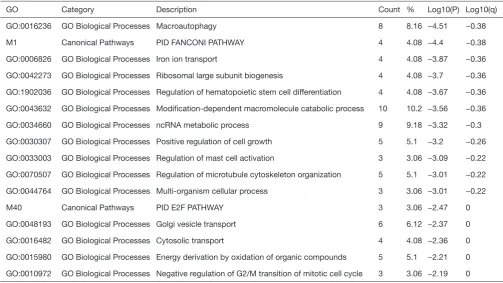
GO Category Description Count % Log10(P) Log10(q)
GO:0016236 GO Biological Processes Macroautophagy 8 8.16 −4.51 −0.38
M1 Canonical Pathways PID FANCONI PATHWAY 4 4.08 −4.4 −0.38
GO:0006826 GO Biological Processes Iron ion transport 4 4.08 −3.87 −0.36
GO:0042273 GO Biological Processes Ribosomal large subunit biogenesis 4 4.08 −3.7 −0.36
GO:1902036 GO Biological Processes Regulation of hematopoietic stem cell differentiation 4 4.08 −3.67 −0.36
GO:0043632 GO Biological Processes Modification-dependent macromolecule catabolic process 10 10.2 −3.56 −0.36
GO:0034660 GO Biological Processes ncRNA metabolic process 9 9.18 −3.32 −0.3
GO:0030307 GO Biological Processes Positive regulation of cell growth 5 5.1 −3.2 −0.26
GO:0033003 GO Biological Processes Regulation of mast cell activation 3 3.06 −3.09 −0.22
GO:0070507 GO Biological Processes Regulation of microtubule cytoskeleton organization 5 5.1 −3.01 −0.22
GO:0044764 GO Biological Processes Multi-organism cellular process 3 3.06 −3.01 −0.22
M40 Canonical Pathways PID E2F PATHWAY 3 3.06 −2.47 0
GO:0048193 GO Biological Processes Golgi vesicle transport 6 6.12 −2.37 0
GO:0016482 GO Biological Processes Cytosolic transport 4 4.08 −2.36 0
GO:0015980 GO Biological Processes Energy derivation by oxidation of organic compounds 5 5.1 −2.21 0
Science Foundation of China [Grant number 81570151], Shanghai Municipal Education Commission-Gaofeng Clinical Medicine [Grant number 20152507].
Footnote
Conflicts of Interest: The authors have no conflicts of interest to declare.
Ethical Statement: The authors are accountable for all
aspects of the work in ensuring that questions related to the accuracy or integrity of any part of the work are appropriately investigated and resolved. All experiments were performed following guidelines and regulations of the Shanghai Jiao Tong University School of Medicine, China.
Open Access Statement: This is an Open Access article
distributed in accordance with the Creative Commons Attribution-NonCommercial-NoDerivs 4.0 International License (CC BY-NC-ND 4.0), which permits the non-commercial replication and distribution of the article with the strict proviso that no changes or edits are made and the original work is properly cited (including links to both the formal publication through the relevant DOI and the license). See: https://creativecommons.org/licenses/by-nc-nd/4.0/.
References
1. Yan XJ, Xu J, Gu ZH, et al. Exome sequencing identifies somatic mutations of DNA methyltransferase gene DNMT3A in acute monocytic leukemia. Nat Genet 2011;43:309-15.
2. Linch DC, Hills RK, Burnett AK, et al. The clinical impact of mutant DNMT3A R882 variant allele frequency in acute myeloid leukaemia. Br J Haematol 2020. [Epub ahead of print].
3. Ostronoff F, Othus M, Lazenby M, et al. Prognostic significance of NPM1 mutations in the absence of FLT3-internal tandem duplication in older patients with acute myeloid leukemia: a SWOG and UK National Cancer Research Institute/Medical Research Council report. J Clin Oncol 2015;33:1157-64.
4. Schnittger S, Haferlach C, Alpermann T, et al. DNMT3A is a Powerful Follow-up Marker in NPM1 mutated AML. Blood 2014;124.
5. Bezerra MF, Lima AS, Pique-Borras MR, et al. Co-occurrence of DNMT3A, NPM1, FLT3 mutations
identifies a subset of acute myeloid leukemia with adverse prognosis. Blood 2020. [Epub ahead of print].
6. Cappelli LV, Meggendorfer M, Dicker F, et al. DNMT3A mutations are over-represented in young adults with NPM1 mutated AML and prompt a distinct co-mutational pattern. Leukemia 2019;33:2741-6.
7. Noh KM, Wang H, Kim HR, et al. Engineering of a Histone-Recognition Domain in Dnmt3a Alters the Epigenetic Landscape and Phenotypic Features of Mouse ESCs. Mol Cell 2018;69:533.
8. Weinberg DN, Papillon-Cavanagh S, Chen H, et al. The histone mark H3K36me2 recruits DNMT3A and shapes the intergenic DNA methylation landscape. Nature 2019;573:281-6.
9. Challen GA, Sun D, Jeong M, et al. Dnmt3a is essential for hematopoietic stem cell differentiation. Nat Genet 2011;44:23-31.
10. Zhang X, Su J, Jeong M, et al. DNMT3A and TET2 compete and cooperate to repress lineage-specific transcription factors in hematopoietic stem cells. Nat Genet 2016;48:1014-23.
11. Sanders MA, Chew E, Flensburg C, et al. MBD4 guards against methylation damage and germ line deficiency predisposes to clonal hematopoiesis and early-onset AML. Blood 2018;132:1526-34.
12. Gu T, Lin X, Cullen SM, et al. DNMT3A and TET1 cooperate to regulate promoter epigenetic landscapes in mouse embryonic stem cells. Genome Biol 2018;19:88. 13. Ketkar S, Verdoni AM, Smith AM, et al. Remethylation of
Dnmt3a (-/-) hematopoietic cells is associated with partial correction of gene dysregulation and reduced myeloid skewing. Proc Natl Acad Sci U S A 2020;117:3123-34. 14. Yang L, Rodriguez B, Mayle A, et al. DNMT3A Loss
Drives Enhancer Hypomethylation in FLT3-ITD-Associated Leukemias. Cancer Cell 2016;30:363-5. 15. Zhang X, Wang X, Wang XQD, et al. Dnmt3a loss and
Idh2 neomorphic mutations mutually potentiate malignant hematopoiesis. Blood 2020. [Epub ahead of print].
16. Lu R, Wang J, Ren Z, et al. A Model System for Studying the DNMT3A Hotspot Mutation (DNMT3A(R882)) Demonstrates a Causal Relationship between Its Dominant-Negative Effect and Leukemogenesis. Cancer Res 2019;79:3583-94.
17. Trimarchi T, Bilal E, Ntziachristos P, et al. Genome-wide mapping and characterization of Notch-regulated long noncoding RNAs in acute leukemia. Cell 2014;158:593-606. 18. Garzon R, Volinia S, Papaioannou D, et al. Expression and
Page 14 of 14
Proc Natl Acad Sci U S A 2014;111:18679-84. 19. Hughes JM, Salvatori B, Giorgi FM, et al.
CEBPA-regulated lncRNAs, new players in the study of acute myeloid leukemia. J Hematol Oncol 2014;7:69.
20. Zeng C, Xu Y, Xu L, et al. Inhibition of long non-coding RNA NEAT1 impairs myeloid differentiation in acute promyelocytic leukemia cells. BMC Cancer 2014;14:693. 21. Tsai CH, Yao CY, Tien FM, et al. Incorporation of long
non-coding RNA expression profile in the 2017 ELN risk classification can improve prognostic prediction of acute myeloid leukemia patients. EBioMedicine 2019;40:240-50. 22. Li Q, Dong C, Cui J, et al. Over-expressed lncRNA
HOTAIRM1 promotes tumor growth and invasion through up-regulating HOXA1 and sequestering G9a/EZH2/Dnmts away from the HOXA1 gene in glioblastoma multiforme. J Exp Clin Cancer Res 2018;37:265.
23. Dai YJ, Wang YY, Huang JY, et al. Conditional knockin of Dnmt3a R878H initiates acute myeloid leukemia with mTOR pathway involvement. Proc Natl Acad Sci U S A 2017;114:5237-42.
24. Tafer H, Hofacker IL. RNAplex: a fast tool for RNARNA interaction search. Bioinformatics 2008;24:2657-63. 25. Shlush LI, Zandi S, Mitchell A, et al. Identification of
pre-leukaemic haematopoietic stem cells in acute leukaemia. Nature 2014;506:328-33.
26. Bond J, Touzart A, Lepretre S, et al. DNMT3A mutation is associated with increased age and adverse outcome in adult T-cell acute lymphoblastic leukemia. Haematologica 2019;104:1617-25.
27. Bartels S, Faisal M, Busche G, et al. Mutations associated with age-related clonal hematopoiesis in PMF patients with rapid progression to myelofibrosis. Leukemia 2019. [Epub ahead of print].
28. Zhang YY, Huang SH, Zhou HR, et al. Role of HOTAIR in the diagnosis and prognosis of acute leukemia. Oncol Rep 2016;36:3113-22.
29. Zhang TJ, Zhou JD, Zhang W, et al. H19 overexpression promotes leukemogenesis and predicts unfavorable
prognosis in acute myeloid leukemia. Clin Epigenetics 2018;10:47.
30. Lister N, Shevchenko G, Walshe JL, et al. The molecular dynamics of long noncoding RNA control of transcription in PTEN and its pseudogene. Proc Natl Acad Sci U S A 2017;114:9942-7.
31. Jiang YY, Zhu H, Zhang H. [Analysis of orthologous lncRNAs in humans and mice and their species-specific epigenetic target genes]. Nan Fang Yi Ke Da Xue Xue Bao 2018;38:731-5.
32. Guo X, Zhang Y, Zheng L, et al. Global characterization of T cells in non-small-cell lung cancer by single-cell sequencing. Nat Med 2018;24:978-85.
33. Yan H, Qu J, Cao W, et al. Identification of prognostic genes in the acute myeloid leukemia immune
microenvironment based on TCGA data analysis. Cancer Immunol Immunother 2019;68:1971-8.
34. Jing D, Bhadri VA, Beck D, et al. Opposing regulation of BIM and BCL2 controls glucocorticoid-induced apoptosis of pediatric acute lymphoblastic leukemia cells. Blood 2015;125:273-83.
35. Chung CY, Shin HR, Berdan CA, et al. Covalent targeting of the vacuolar H(+)-ATPase activates autophagy via mTORC1 inhibition. Nat Chem Biol 2019;15:776-85. 36. Caprini E, Cristofoletti C, Arcelli D, et al. Identification
of key regions and genes important in the pathogenesis of sezary syndrome by combining genomic and expression microarrays. Cancer Res 2009;69:8438-46.
37. Crosslin DR, McDavid A, Weston N, et al. Genetic variants associated with the white blood cell count in 13,923 subjects in the eMERGE Network. Hum Genet 2012;131:639-52.
38. Gao Q, Zhu H, Dong L, et al. Integrated Proteogenomic Characterization of HBV-Related Hepatocellular Carcinoma. Cell 2019;179:561-77.e22.
39. Goodwin EC, Motamedi N, Lipovsky A, et al. Expression of DNAJB12 or DNAJB14 causes coordinate invasion of the nucleus by membranes associated with a novel nuclear pore structure. PLoS One 2014;9:e94322.
Table S1 List of the 23 differentially express lncRNAs in mice
lncRNA_id Locus length Mutant_
FPKM WT_FPKM
Fold_change-KI/WT P value
Up/down regulate
CON10_ FPKM
CON5_ FPKM
CON9_
FPKM K133_FPKM
K139_
FPKM K161_FPKM g1_FPKM g2_FPKM
CON10_ count
CON5_ count
CON9_ count
K133_
count K139_count K161_count g1_count g2_count
ENSMUST00000181073
10:12916645-12923127
1060 11.9628 27.8584 0.42941447 0.025520212 DOWN 29.8609 27.6539 26.0603 23.0123 5.25344 7.62281 27.8584 11.9628 319.79 291.639 281.947 247.042 56.1092 80.6764 297.792 127.943
ENSMUST00000189381 11:120961748-120998295
778 3.2643 15.1341 0.21569172 0.012434205 DOWN 10.6107 10.3084 24.483 4.8182 3.27893 1.69577 15.1341 3.2643 111.903 106.111 253.58 50.3003 34.4239 17.7718 157.198 34.1653
ENSMUST00000192353
9:90863158-90863307
149 0.00001 18.2156 5.49E-07 4.48E-05 DOWN 15.5194 39.1274 0 0 0 0 18.2156 0 0.924815 1.87793 0 0 0 0 0.93425 0
ENSMUST00000193969
1:40028765-40125231
3071 62.3625 128.128 0.48672031 1.24E-05 DOWN 140.934 93.7948 149.654 66.5196 62.0561 58.512 128.128 62.3625 4698.99 3169.95 4825.37 2252.53 2058.92 1958.84 4231.44 2090.1
ENSMUST00000195932
5:64563770-64563919
149 6.4096 20.9937 0.30531064 0.013454793 DOWN 15.5194 19.5637 27.8981 19.2288 0 0 20.9937 6.4096 0.924815 0.938967 1.22502 1.00604 0 0 1.0296 0.335347
ENSMUST00000197996
3:116818814-116818978
164 22.184 49.1212 0.45161763 0.003333771 DOWN 18.2222 67.8826 61.2588 0 21.0801 45.4718 49.1212 22.184 1.84963 5.6338 4.9001 0 1.86075 3.94928 4.12784 1.93668
ENSMUST00000199438
5:55652948-55653147
199 0.00001 10.9683 9.12E-07 0.006567246 DOWN 7.09008 8.27617 17.5385 0 0 0 10.9683 0 1.84963 1.87793 3.67507 0 0 0 2.46755 0
NONMMUT011310.2
11:86811827-86816129
2697 12.0495 33.8983 0.3554603 0.005015686 DOWN 34.9619 29.4028 37.3302 15.7349 8.57 11.8437 33.8983 12.0495 1126.28 964.28 1131.36 522.471 273.5 385.052 1073.97 393.674
NONMMUT011311.2
11:86811827-86816129
3365 6.65937 20.9716 0.3175423 0.013454793 DOWN 20.4244 16.3869 26.1035 7.84417 5.48907 6.64488 20.9716 6.65937 827.858 669.522 1024.68 322.604 220.53 269.542 840.687 270.892
NONMMUT016063.2
12:113418557-113422730
324 1.31627 9.26689 0.1420401 0.039426557 DOWN 5.79041 7.68822 14.322 3.9485 0.000212 0.0001025 9.26689 1.31627 10.4099 12.9279 23.9053 6.84833 0.0003674 0.0001744 15.7477 2.28296
NONMMUT029644.2
17:39842994-40064883
1005 16.7226 61.1403 0.27351191 7.93E-07 DOWN 30.1526 7.82938 145.439 1.00478 29.7146 19.4483 61.1403 16.7226 250.677 63.767 1262.64 8.21912 248.042 159.929 525.695 138.73
NONMMUT033401.2
19:3065710-3197782
3793 5.88141 16.7959 0.35016939 0.036237215 DOWN 24.7823 10.6023 15.003 3.78238 4.24366 9.61817 16.7959 5.88141 1162.49 504.222 673.729 182.084 197.239 455.154 780.148 278.159
NONMMUT038016.2
2:75637800-75658998
471 21.6525 70.9167 0.30532301 1.10E-06 DOWN 76.3101 73.5892 62.8507 26.9847 21.7723 16.2004 70.9167 21.6525 303.339 284.507 238.88 105.634 84.6642 63.1885 275.575 84.4957
NONMMUT056583.2
6:41198232-41201843
682 3.18951 13.4708 0.23677213 0.031996141 DOWN 12.8745 12.2037 15.3341 4.5013 3.4721 1.59512 13.4708 3.18951 76.884 72.9559 86.4559 27.4114 20.5385 9.48349 78.7653 19.1444
NONMMUT071214.2
9:114728980-114749343
1249 0.938233 7.69172 0.12197961 0.039699942 DOWN 6.9036 16.171 0.0005742 0.697771 2.09962 0.0173108 7.69172 0.938233 80.2104 190.673 0.0064346 8.28162 24.2203 0.201633 90.2965 10.9012
NONMMUT107355.1
2:75637800-75658998
5126 15.6662 52.9073 0.29610659 1.78E-05 DOWN 54.9198 48.8492 54.9529 19.0106 16.4787 11.5092 52.9073 15.6662 3307.24 2975.07 3198.28 1163.95 985.535 695.047 3160.19 948.177
TCONS_00058946
18:16274551-16275002
203 1.81432 22.9585 0.07902607 2.26E-05 DOWN 62.3655 2.80515 3.7048 2.80804 2.63491 0 22.9585 1.81432 24.0452 0.938967 1.22502 1.00604 0.930376 0 8.73639 0.645472
ENSMUST00000188429
2:158353699-158361581
132 47.7206 18.8542 2.53103287 0.000193633 UP 56.5625 0 0 143.162 0 0 18.8542 47.7206 0.87376 0 0 1.94146 0 0 0.291253 0.647153
NONMMUT004030.2
1:180326969-180424802
287 11.4343 3.96384 2.88465226 0.044142133 UP 1.43995 7.64303 2.80855 15.655 12.8714 5.77661 3.96384 11.4343 1.57312 7.85032 2.67088 16.8598 13.291 5.99372 4.03144 12.0482
NONMMUT004733.2
10:12916645-12923127
1089 9.08173 0.00473866 1916.51859 0.005185292 UP 0.0064683 0.0053452 0.0024025 0.0050926 14.1075 13.1326 0.0047387 9.08173 0.0710552 0.0580466 0.02677090.0560715 155.368 143.174 0.0519576 99.5327
NONMMUT011291.2
11:86583864-86683836
2239 17.125 7.93494 2.15817637 0.047980617 UP 8.64975 7.50489 7.65018 11.2771 14.7008 25.3971 7.93494 17.125 167.089 148.753 142.345 222.645 283.868 494.349 152.729 333.621
NONMMUT016221.2
13:3538074-3611108
217 7.16486 0.778304 9.20573452 0.018442882 UP 1.984E-05 2.33489 0 6.98086 1.11135 13.4024 0.778304 7.16486 6.599E-06 0.703692 0 2.20444 0.334686 4.04543 0.234566 2.19485
NONMMUT061838.2
7:63886350-63938915
chr Start End Strands lncRNA_id chr Start End Strands Gene_id Gene_name Oncolnc (P value)
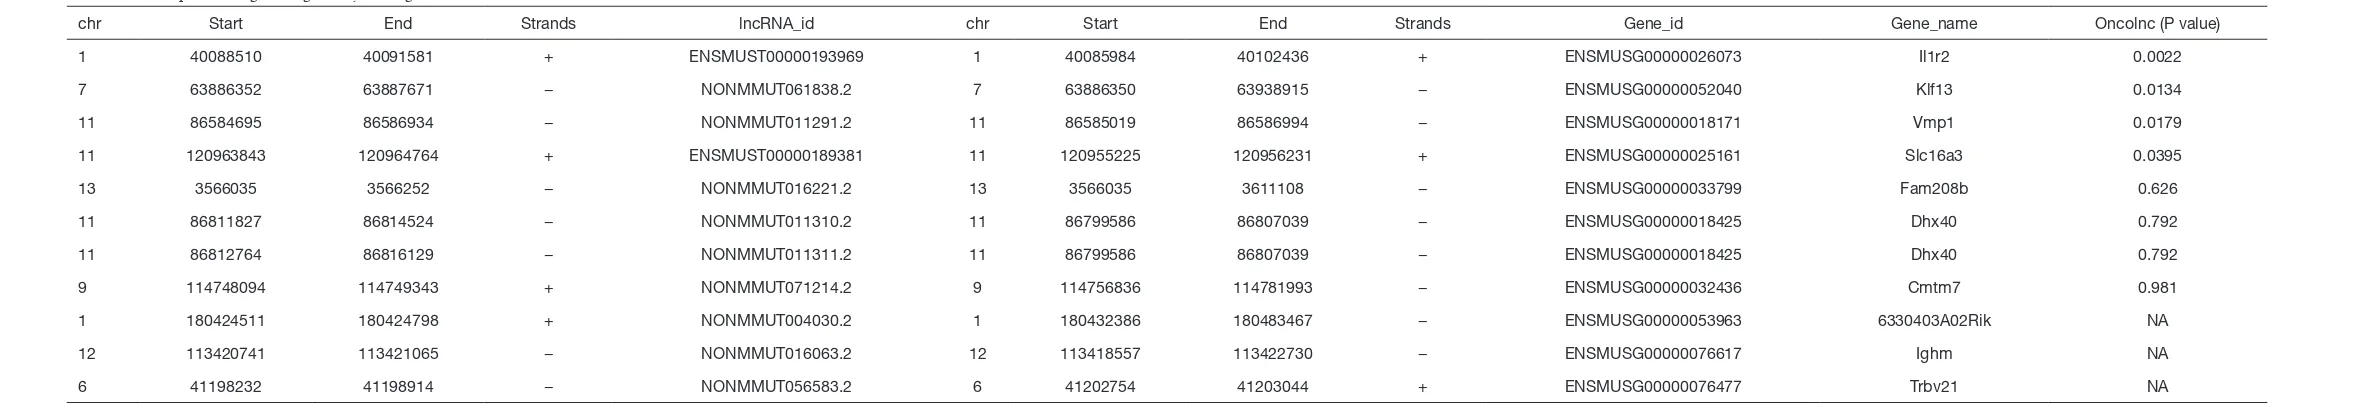
1 40088510 40091581 + ENSMUST00000193969 1 40085984 40102436 + ENSMUSG00000026073 Il1r2 0.0022
7 63886352 63887671 − NONMMUT061838.2 7 63886350 63938915 − ENSMUSG00000052040 Klf13 0.0134
11 86584695 86586934 − NONMMUT011291.2 11 86585019 86586994 − ENSMUSG00000018171 Vmp1 0.0179
11 120963843 120964764 + ENSMUST00000189381 11 120955225 120956231 + ENSMUSG00000025161 Slc16a3 0.0395
13 3566035 3566252 − NONMMUT016221.2 13 3566035 3611108 − ENSMUSG00000033799 Fam208b 0.626
11 86811827 86814524 − NONMMUT011310.2 11 86799586 86807039 − ENSMUSG00000018425 Dhx40 0.792
11 86812764 86816129 − NONMMUT011311.2 11 86799586 86807039 − ENSMUSG00000018425 Dhx40 0.792
9 114748094 114749343 + NONMMUT071214.2 9 114756836 114781993 − ENSMUSG00000032436 Cmtm7 0.981
1 180424511 180424798 + NONMMUT004030.2 1 180432386 180483467 − ENSMUSG00000053963 6330403A02Rik NA
12 113420741 113421065 − NONMMUT016063.2 12 113418557 113422730 − ENSMUSG00000076617 Ighm NA
[image:16.1191.12.1191.93.296.2]lncRNA_id Trans_Target_mRNA Trans_Target_gene gene_name Trans_Evalue Oncolnc (P value)
NONMMUT107355.1 ENSMUST00000085826 ENSMUSG00000020661 Dnmt3a −87.7 0.000353
ENSMUST00000181073 ENSMUST00000131158 ENSMUSG00000022438 Parvb −71.8 0.000404
ENSMUST00000181073 ENSMUST00000090178 ENSMUSG00000074212 Dnajb14 −82.4 0.0126
ENSMUST00000181073 ENSMUST00000138549 ENSMUSG00000025817 Nudt5 −73.2 0.0164
NONMMUT107355.1 ENSMUST00000152102 ENSMUSG00000017221 Psmd3 −92.8 0.0165
ENSMUST00000181073 ENSMUST00000194253 ENSMUSG00000026520 Pycr2 −71 0.0211
ENSMUST00000181073 ENSMUST00000130036 ENSMUSG00000052459 Atp6v1a −76.1 0.0295
ENSMUST00000181073 ENSMUST00000041203 ENSMUSG00000030270 Cpne9 −68.3 0.0352
NONMMUT107355.1 ENSMUST00000022036 ENSMUSG00000021553 Slc28a3 −90.7 0.05
NONMMUT107355.1 ENSMUST00000127090 ENSMUSG00000020823 Sec14l1 −90.1 0.0549
ENSMUST00000181073 ENSMUST00000127660 ENSMUSG00000052738 Suclg1 −79.1 0.0552
ENSMUST00000181073 ENSMUST00000144378 ENSMUSG00000029655 N4bp2l2 −74.6 0.0572
ENSMUST00000181073 ENSMUST00000140370 ENSMUSG00000038324 Trpc4ap −75.4 0.0627
ENSMUST00000181073 ENSMUST00000110549 ENSMUSG00000042817 Flt3 −74.1 0.0629
ENSMUST00000181073 ENSMUST00000147183 ENSMUSG00000057236 Rbbp4 −79.2 0.082
NONMMUT107355.1 ENSMUST00000127211 ENSMUSG00000027787 Nmd3 −90.2 0.0957
ENSMUST00000181073 ENSMUST00000127373 ENSMUSG00000025173 Wdr45b −73.9 0.114
ENSMUST00000181073 ENSMUST00000112311 ENSMUSG00000025825 Iscu −75.7 0.118
NONMMUT107355.1 ENSMUST00000156046 ENSMUSG00000020526 Znhit3 −92 0.122
ENSMUST00000181073 ENSMUST00000099374 ENSMUSG00000074802 Gas2l3 −74.8 0.145
ENSMUST00000181073 ENSMUST00000123641 ENSMUSG00000006191 Cdkal1 −77.5 0.146
ENSMUST00000181073 ENSMUST00000091674 ENSMUSG00000006191 Cdkal1 −68.2 0.146
ENSMUST00000181073 ENSMUST00000023867 ENSMUSG00000023104 Rfc2 −80.6 0.162
ENSMUST00000181073 ENSMUST00000135018 ENSMUSG00000024773 Atg2a −77.1 0.167
ENSMUST00000181073 ENSMUST00000135943 ENSMUSG00000031604 Msmo1 −71.2 0.173
ENSMUST00000181073 ENSMUST00000159426 ENSMUSG00000036636 Clcn7 −74.2 0.177
ENSMUST00000181073 ENSMUST00000123133 ENSMUSG00000058498 Rnf207 −73.6 0.192
ENSMUST00000181073 ENSMUST00000196258 ENSMUSG00000045482 Trrap −81.5 0.196
ENSMUST00000181073 ENSMUST00000202421 ENSMUSG00000053134 Supt7l −84.2 0.207
ENSMUST00000181073 ENSMUST00000181042 ENSMUSG00000037416 Dmxl1 −80.8 0.222
ENSMUST00000181073 ENSMUST00000116231 ENSMUSG00000080115 Mettl21b −69.5 0.223
ENSMUST00000181073 ENSMUST00000188847 ENSMUSG00000048874 Phf3 −84.5 0.229
NONMMUT107355.1 ENSMUST00000203625 ENSMUSG00000001521 Tulp3 −91 0.254
ENSMUST00000181073 ENSMUST00000202627 ENSMUSG00000029161 Cgref1 −83 0.263
ENSMUST00000181073 ENSMUST00000160708 ENSMUSG00000004626 Stxbp2 −75 0.263
ENSMUST00000181073 ENSMUST00000140279 ENSMUSG00000014504 Srp19 −77.2 0.267
ENSMUST00000181073 ENSMUST00000186398 ENSMUSG00000026356 Dars −64.7 0.282
ENSMUST00000181073 ENSMUST00000153173 ENSMUSG00000030869 Ndufab1 −74.7 0.296
ENSMUST00000181073 ENSMUST00000138468 ENSMUSG00000027598 Itch −77.3 0.303
ENSMUST00000181073 ENSMUST00000186246 ENSMUSG00000067336 Bmpr2 −76.2 0.304
NONMMUT107355.1 ENSMUST00000134323 ENSMUSG00000035949 Fbxw2 −86 0.306
ENSMUST00000181073 ENSMUST00000040519 ENSMUSG00000037787 Apopt1 −78.4 0.313
ENSMUST00000181073 ENSMUST00000163992 ENSMUSG00000015316 Slamf1 −79.8 0.313
ENSMUST00000181073 ENSMUST00000192890 ENSMUSG00000026705 Klhl20 −75.1 0.345
NONMMUT107355.1 ENSMUST00000146104 ENSMUSG00000007570 Fance −89.2 0.372
ENSMUST00000181073 ENSMUST00000108249 ENSMUSG00000037643 Prkci −77.7 0.377
NONMMUT107355.1 ENSMUST00000153924 ENSMUSG00000073771 Btbd19 −90.9 0.39
ENSMUST00000181073 ENSMUST00000071852 ENSMUSG00000056941 Commd7 −82 0.393
ENSMUST00000181073 ENSMUST00000173966 ENSMUSG00000002984 Tomm40 −78.9 0.396
NONMMUT107355.1 ENSMUST00000141152 ENSMUSG00000047126 Cltc −86.1 0.401
ENSMUST00000181073 ENSMUST00000146233 ENSMUSG00000040483 Xaf1 −72.3 0.415
ENSMUST00000181073 ENSMUST00000128582 ENSMUSG00000039768 Dnajc11 −72.5 0.421
ENSMUST00000181073 ENSMUST00000142327 ENSMUSG00000003660 Snrnp200 −78.3 0.456
ENSMUST00000181073 ENSMUST00000195731 ENSMUSG00000026080 Chst10 −75.8 0.469
ENSMUST00000181073 ENSMUST00000185401 ENSMUSG00000053877 Srcap −74.9 0.485
ENSMUST00000181073 ENSMUST00000206479 ENSMUSG00000053158 Fes −82.3 0.504
ENSMUST00000181073 ENSMUST00000021173 ENSMUSG00000020818 Mfsd11 −65.5 0.531
ENSMUST00000181073 ENSMUST00000084926 ENSMUSG00000044037 Als2cl −76.8 0.538
ENSMUST00000181073 ENSMUST00000154704 ENSMUSG00000041966 Dcaf17 −72.2 0.552
NONMMUT107355.1 ENSMUST00000162792 ENSMUSG00000033400 Agl −90 0.566
ENSMUST00000181073 ENSMUST00000086353 ENSMUSG00000040528 Milr1 −71.1 0.587
ENSMUST00000181073 ENSMUST00000134594 ENSMUSG00000001143 Lman2l −76.4 0.593
ENSMUST00000181073 ENSMUST00000202151 ENSMUSG00000036435 Exoc1 −72.1 0.604
ENSMUST00000181073 ENSMUST00000127536 ENSMUSG00000037214 Thap1 −80.4 0.605
ENSMUST00000181073 ENSMUST00000186061 ENSMUSG00000032409 Atr −81.9 0.612
ENSMUST00000181073 ENSMUST00000182970 ENSMUSG00000029110 Rnf4 −75.3 0.636
ENSMUST00000181073 ENSMUST00000198325 ENSMUSG00000001016 Ilf2 −78 0.676
ENSMUST00000181073 ENSMUST00000029786 ENSMUSG00000028140 Mrpl9 −73 0.692
ENSMUST00000181073 ENSMUST00000180554 ENSMUSG00000037926 Ssh2 −67.2 0.702
ENSMUST00000181073 ENSMUST00000197394 ENSMUSG00000022160 Mettl3 −69.8 0.741
ENSMUST00000181073 ENSMUST00000118679 ENSMUSG00000022498 Txndc11 −83.3 0.758
ENSMUST00000181073 ENSMUST00000200029 ENSMUSG00000032480 Dhx30 −75.2 0.763
NONMMUT107355.1 ENSMUST00000152751 ENSMUSG00000027115 Kif18a −92.1 0.794
ENSMUST00000181073 ENSMUST00000038474 ENSMUSG00000039356 Exosc2 −78.8 0.803
NONMMUT107355.1 ENSMUST00000182164 ENSMUSG00000024073 Birc6 −92.3 0.814
NONMMUT107355.1 ENSMUST00000153936 ENSMUSG00000029578 Wipi2 −91.4 0.817
NONMMUT107355.1 ENSMUST00000027036 ENSMUSG00000025903 Lypla1 −91.3 0.829
ENSMUST00000181073 ENSMUST00000036194 ENSMUSG00000040121 Rep15 −77.6 0.876
ENSMUST00000181073 ENSMUST00000150946 ENSMUSG00000006058 Snf8 −83.4 0.887
ENSMUST00000181073 ENSMUST00000044158 ENSMUSG00000041560 Gltscr2 −77.4 0.899
ENSMUST00000181073 ENSMUST00000144696 ENSMUSG00000027282 Mtch2 −82.8 0.901
NONMMUT107355.1 ENSMUST00000174852 ENSMUSG00000021418 Rpp40 −91.5 0.922
ENSMUST00000181073 ENSMUST00000034392 ENSMUSG00000031917 Nip7 −71.7 0.928
NONMMUT107355.1 ENSMUST00000141208 ENSMUSG00000020220 Vps13d −92.4 0.945
ENSMUST00000181073 ENSMUST00000204594 ENSMUSG00000025758 Plk4 −72.9 0.96
NONMMUT107355.1 ENSMUST00000155824 ENSMUSG00000071866 Ppia −87.3 0.963
ENSMUST00000181073 ENSMUST00000126755 ENSMUSG00000024008 Cpne5 −78.6 0.965
ENSMUST00000181073 ENSMUST00000186897 ENSMUSG00000032555 Topbp1 −81 0.992
NONMMUT107355.1 ENSMUST00000143616 ENSMUSG00000026798 Coq4 −85.5 0.993
ENSMUST00000181073 ENSMUST00000145614 ENSMUSG00000037740 Mrps26 −72.8 0.994
ENSMUST00000181073 ENSMUST00000160484 ENSMUSG00000033400 Agl −76.7 0.566 (Agl1)
ENSMUST00000181073 ENSMUST00000161808 ENSMUSG00000015961 Adss −78.5 6.78e10-6
ENSMUST00000181073 ENSMUST00000021135 ENSMUSG00000020783 1200014J11Rik −80.2 NA
ENSMUST00000181073 ENSMUST00000145859 ENSMUSG00000074578 1500012F01Rik −73.7 NA
ENSMUST00000181073 ENSMUST00000132778 ENSMUSG00000078584 AU022252 −68.8 NA
ENSMUST00000181073 ENSMUST00000194220 ENSMUSG00000033488 BC026585 −80.1 NA
ENSMUST00000181073 ENSMUST00000053033 ENSMUSG00000044768 D1Ertd622e −74 NA
ENSMUST00000181073 ENSMUST00000202707 ENSMUSG00000038456 Dennd2a −84 NA
NONMMUT107355.1 ENSMUST00000060894 ENSMUSG00000044726 Erich5 −90.6 NA
ENSMUST00000181073 ENSMUST00000060009 ENSMUSG00000048647 Exd1 −75.6 NA
ENSMUST00000181073 ENSMUST00000206754 ENSMUSG00000046826 Fam187b −83.7 NA
ENSMUST00000181073 ENSMUST00000118793 ENSMUSG00000081650 Gm16181 −78.7 NA
ENSMUST00000181073 ENSMUST00000185926 ENSMUSG00000096036 Gm21778 −81.1 NA
ENSMUST00000181073 ENSMUST00000194153 ENSMUSG00000034837 Gnat1 −74.3 NA
ENSMUST00000181073 ENSMUST00000198518 ENSMUSG00000067242 Lgi1 −68.1 NA
ENSMUST00000181073 ENSMUST00000132185 ENSMUSG00000020691 Mettl2 −74.4 NA
ENSMUST00000181073 ENSMUST00000178684 ENSMUSG00000020072 Pbld2 −70.1 NA
ENSMUST00000181073 ENSMUST00000126347 ENSMUSG00000032289 Thsd4 −73.8 NA
ENSMUST00000181073 ENSMUST00000049778 ENSMUSG00000051034 Zfp11 −76.9 NA
ENSMUST00000181073 ENSMUST00000075916 ENSMUSG00000029587 Zfp12 −83.5 NA
ENSMUST00000181073 ENSMUST00000168691 ENSMUSG00000025602 Zfp202 −80.5 NA
ENSMUST00000181073 ENSMUST00000108336 ENSMUSG00000037640 Zfp60 −76 NA
[image:17.1191.60.1097.123.1704.2]