Available Online atwww.ijcsmc.com
International Journal of Computer Science and Mobile Computing
A Monthly Journal of Computer Science and Information Technology
ISSN 2320–088X
IJCSMC, Vol. 4, Issue. 12, December 2015, pg.44 – 48
Big Data Visualization: Challenges
and SAS Visual Analytics
Prof. Parinita Chate
1, Mr. Abhijit Karad
2, Prof. Uday Patkar
3 1,2,3Department of Computer Engineering, University of Pune, IndiaBharati Vidyapeeth’s College of Engineering, Lavale, Pune, Maharashtra, India 1 [email protected]; 2 [email protected]; 3 [email protected]
Abstract— The term ‘Big data’ describes any voluminous amount of structured, semi-structured and unstructured data that has the potential to be mined for information [1]. Today, data is generated at a pace never imagined before and every stakeholder wants to gain insights from this data to make better and smarter decisions. One of the best ways to gain insights and make better decisions is through data visualization. The emerging field of visual analytics focuses on handling Big Data by integrating human judgment by means of visual representations and interaction techniques in the analysis process. This paper covers some of the challenges in visualization of Big Data and potential solutions for the same using SAS Visual Analytics.
Keywords— Big Data, Visual Analytics, SAS, Visualization, Tree maps, Word cloud
I. INTRODUCTION
The storage capacity and processing capability of computers has increased at an incredible rate over the last few decades. Data is being produced at a pace never imagined before and our capability to store this data has also increased proportionately. Unfortunately much of the data being stored is not being utilized due our ability to analyze data not increasing in the same proportion. However, the analysis of this massive, inconsistent and huge volume of data (Big Data) is critical for various application domains to extract meaningful information. Most of the data analysis software tools employed today for information analysis still lack the possibilities to interact with the databases containing huge amounts of data.
big data visualization. Real world application examples using SAS Visual Analytics are presented that show how visual analytics can help to turn information overload as generated by today’s applications into useful information.
II. BIG DATA OVERVIEW
Definition – Big data is an evolving term that describes any voluminous amount of structured, semi-structured and unstructured data that has the potential to be mined for information. [1] According to Gartner, Big Data is defined as high-volume, high-velocity and/or high-variety information assets that demand cost-effective, innovative forms of information processing that enable enhanced insight, decision making and process automation. [2]
Dimensions of Big Data (4 Vs) –
III.VISUAL ANALYTICS OVERVIEW
Definition – Visual analytics is the science of analytical reasoning facilitated by interactive visual interfaces. [3]
Visual analytics is a multidisciplinary field with the following main objectives:
let users obtain deep insights that directly support decision making using various analytical reasoning techniques;
let users see, explore, and understand large amounts of information simultaneously through visual representations and interaction techniques;
to support production, presentation, and dissemination of analytical results in the appropriate context to a variety of audiences and
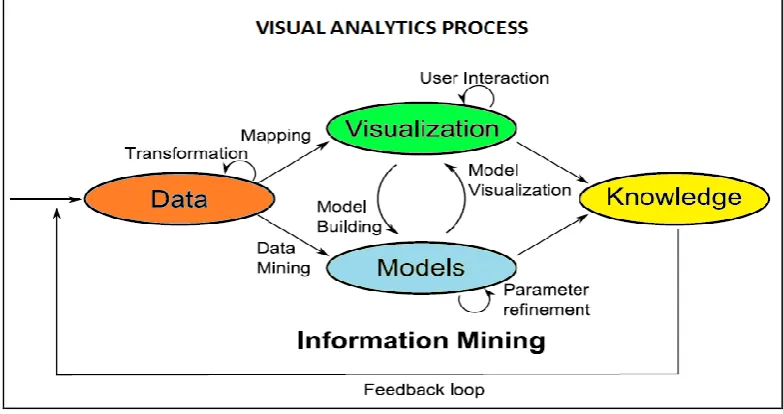
Visual Analytics Process – The visual analytics process involves visual analysis methods combined with human interaction in order to gain knowledge from data. Fig. 1 below [5] shows an abstract overview of the different stages (represented through ovals) and their transitions (arrows) in the visual analytics process.
Fig. 1 Visual Analytics Process: Abstract overview of different stages and their transitions
The first step is often to transform the data through data cleaning, normalization or grouping in order to extract meaningful units of data for further processing. The analyst then chooses a visual analysis method for initial visualization. More often or not human interaction is needed with this visualization to disclose key insights through different views of the data. The findings from this visualization can be used to build a model for automatic analysis. Once a model is created the analyst has the ability to interact with the automatic methods through parameter modification or selection of other types of analysis algorithms. Alternating between visual and automatic methods within the visual analytics process leads to a continuous improvement and confirmation of preliminary results. Misleading results in an intermediate step can thus be discovered and corrected at an early stage, which leads to more confidence in the final results.
In the visual analytics process, knowledge can be gained from visualization, automatic analysis, as well as the preceding interactions between visualizations, models, and the human analysts. The feedback loop stores this knowledge of insightful analyses in the system and contributes to enable the analyst to draw faster and better conclusions in the future.
IV.BIG DATA VISUALIZATION CHALLENGES
Data visualization is becoming an extremely important component of analytics in this era of Big Data. However, there are several challenges related to visualization of Big Data that organizations need to address to take full advantage of Visual Analytics. Given below are some of those key challenges –
a) Data Velocity: Velocity is all about the speed at which data is being generated and consumed by an organization. The ability to access and process varying velocities of data quickly and efficiently is critical. In today’s extremely competitive business environment, companies have to quickly find and analyze the relevant data they need. Visualization helps increase the speed in which organizations perform analyses and make decisions, but the challenge is going through huge volumes of data and accessing the level of detail needed, all at a high speed
b) Data Variety (Semi Structured and Unstructured data): Data variety brings challenges because new visualization techniques need to be adapted to display and get meaning out of semi structured and unstructured data.
c) Data Quality: Data accuracy and timeliness are key factors to ensure decision making is valuable. Ensuring
these is an even greater challenge when it comes to volumes of data involved in big data projects. Companies need to proactively have a good and reliable data governance or information management process in place to ensure the data is clean.
d) Displaying meaningful results: Plotting points on a graph for analysis becomes difficult when dealing with
higher-level view where smaller groups of data become visible. By grouping the data together, or “binning,” you can more effectively visualize the data
e) Dealing with outliers: The graphical representations of data communicate trends and outliers much faster than tables containing numbers and text. Users can easily spot issues that need attention simply by glancing at a chart. Outliers typically represent about 1 to 5 percent of data, but when you’re working with massive amounts of data, viewing 1 to 5 percent of the data is rather difficult. How do you represent those points without getting into plotting issues? Possible solutions are to remove the outliers from the data or to create a separate chart for the outliers.
V. VISUALIZING BIG DATA USING SASVISUAL ANALYTICS
a) Dealing with Data Variety: SAS Visual Analytics provides visualization techniques such as word clouds and network diagrams for visualizing semi structured and unstructured data.
Fig.2 Word Cloud Fig.3 Network Diagram
b) Dealing with Data Velocity: SAS Visual Analytics provides correlation matrix that combines big data and
fast response times to quickly identify which variables among millions and billions are related and also strength of their relationship.
Fig.4 Correlation Matrix
c) Displaying meaningful results: In SAS Visual Analytics, intelligent autocharting produces the best visual based on what data you drag and drop onto the visual palette. When you are first exploring a new data set, autocharts are useful because they provide a quick view of the data.
Fig.5 Auto Forecasting in SAS Visual Analytics VI.FUTURE SCOPE
Data visualization is entering a new era. Promising developments and advances in multidimensional imaging are reshaping the potential value that analytics can provide, with visualization playing an important role. The growing trend towards visualization-based data discovery tools is expected to continue in future, as businesses seek improved and cost-effective ways to derive insights from their big data. Visualization-based data discovery tools provide an immense opportunity to manage the ever increasing data volume, variety, and velocity and to gain value from that data. Using high-powered desktops and mobile devices, and with the help of firm data governance practices and vendors such as SAS, businesses can better understand operations, customers, and the marketplace. And those timely, deeper insights can lead to greater business dexterity and a significant competitive advantage moving forward.
VII. CONCLUSION
Visualizing your data can be both fun and challenging. Like they say, “A picture is equivalent to a thousand words”. Data visualization is becoming a very critical component of analytics in this big data era. The technological advancements in computing and storage capabilities coupled with high-performance analytics are providing a better and quicker way to analyze data. Visual analytics helps organizations extract meaningful information from raw data. However, with the many options available for visualization of data, selecting the correct visualization is a challenge as it is possible that the visual analyst may end up presenting the information using the wrong visualization. If you’re prepared to deal with these hurdles, the opportunity for success with a data visualization strategy is much greater. You can choose the most appropriate visualization by understanding the data and its features, type of information you are trying to convey to your audience, and the type of audience processing that information. Products such as SAS Visual Analytics can help provide the best, fastest visualizations possible and thereby help in overcoming these challenges.
REFERENCES
[1] http://searchcloudcomputing.techtarget.com/definition/big-data-Big-Data
[2] http://www.gartner.com/it-glossary/big-data/
[3] J.J. Thomas and K.A. Cook, eds., Illuminating the Path: The Research and Development Agenda for Visual Analytics, IEEE CS Press, 2005.
[4] James J. Thomas and Kristin A. Cook., IEEE Computer Graphics and Applications, 26(1):10-13, January/February, 2006.
[5] D.A. Keim, J. Kohlhammer, G. Ellis, F. Mannsmann (Eds.), Mastering the Information Age. Solving Problems with Visual Analytics, Eurographics Association, Goslar, 2010.
[6] http://www.analytics-magazine.org/january-february-2015/1196-data-visualization-the-future-of-data-visualization
[7] http://www.sas.com
[8] P. Simon, The Visual Organization: Data Visualization, Big Data, and the Quest for Better Decisions,Harvard Business Review, June 13, 2014, pp. 1-8.
[9] E.Y. Gorodov and V.V. Gubarev, Analytical Review of Data Visualization Methods in Application to Big Data, Journal of Electrical and Computer Engineering, 013, Article ID 969458, pp. 1-7.