Clinical Interventions in Aging
Dove
press
O r I g I n A l r e s e A r C h
open access to scientific and medical research
Open Access Full Text Article
relationship between obesity, metabolic
syndrome, and nonalcoholic fatty liver
disease in the elderly agricultural
and fishing population of Taiwan
hsi-Che shen1–3
Zi-hao Zhao4
Yi-Chun hu2,5,6
Yu-Fen Chen7–9
Tao-hsin Tung4,10,11
1Department of surgery, new Taipei
City hospital, 2school of health
Care Administration, Taipei Medical University, Taipei, 3Department of
healthcare Management, Yuanpei University, hsinchu, 4Faculty of Public
health, school of Medicine, Fu-Jen Catholic University, new Taipei City,
5Oriental Institute of Technology, 6Department of nursing, new Taipei
City hospital, 7Business Place hygiene
Management, Department of health, Taipei City government, 8Institute of
health and Welfare Policy, national Yang-Ming University, 9Department
of nursing, Kang-ning Junior College of Medical Care and Management,
10Department of Medical research
and education, Cheng-hsin general hospital, Taipei, 11Department of
Crime Prevention and Correction, Central Police University, Taoyuan, Taiwan
Correspondence: Tao-hsin Tung Department of Medical research and education, Cheng hsin general hospital, shih-Pai, 112, Taipei, Taiwan
Tel 88 62 2826 4400 ext 7704 Fax 88 62 2826 4550 email ch2876@chgh.org.tw
Background: The purpose of this study was to explore the relationship between obesity, the metabolic syndrome, and nonalcoholic fatty liver disease (NAFLD) in the elderly agricultural and fishing population of Taipei, Taiwan.
Methods: The study participants comprised 6,511 (3,971 male and 2,540 female) healthy elderly subjects voluntarily attending a teaching hospital for a physical check-up in 2010. Blood samples and real-time ultrasound-proven fatty liver sonography results were collected.
Results: The prevalence of NAFLD in this elderly population was 27.2%, including mild NAFLD (16.0%), moderate NAFLD (10.3%), and severe NAFLD (0.9%). The prevalence of moderate or severe NAFLD for metabolic syndrome proved to be substantially greater (P,0.0001, χ2
test) for one or two metabolic factors. Using multinomial logistic regression analysis, age, sex, metabolic syndrome, and higher body mass index had a statistically significant association with mild NAFLD. Age, sex, metabolic syndrome, higher body mass index, and higher alanine aminotransferase were significantly related to moderate NAFLD. In addition, higher body mass index, higher uric acid, and higher alanine aminotransferase levels were significantly related to severe NAFLD. The sensitivity and specificity of body mass index and waist circumference as markers of NAFLD were estimated to be 81% and 84%, respectively, and 77% and 69%, respectively.
Conclusion: The prevalence of mild or moderate NAFLD was related to obesity and metabolic syndrome. Higher body mass index was also related to severe NAFLD but not to metabolic syndrome. Targeting this population for control of obesity and improved metabolic function is important.
Keywords: agriculture, fishing, elderly, metabolic syndrome, nonalcoholic fatty liver disease
Introduction
Nonalcoholic fatty liver disease (NAFLD) consists of the accumulation of fat vacuoles in the cytoplasm of hepatocytes and is characterized by development of hepatic lesions similar to those caused by alcohol in subjects without significant alcohol consumption.1 The prevalence of NAFLD is reported to be 3%–24% in the general population in various countries, and is increasing in parallel with the rising prevalence of obesity.2 However, there is little information on the clinical relevance of this disorder as a health problem in the general population, given that the studies published generally include a limited number of subjects and the diagnosis is established on the basis of clear biochemical changes and liver biopsy.3
Clinical Interventions in Aging downloaded from https://www.dovepress.com/ by 118.70.13.36 on 20-Aug-2020
For personal use only.
Number of times this article has been viewed
This article was published in the following Dove Press journal: Clinical Interventions in Aging
Dovepress
shen et al
Because most individuals with NAFLD are asymptomatic, early detection by routine screening followed by appropri-ate clinical intervention would offer a practical means of preventing the hepatocellular damage associated with this condition. From an evidence-based medicine viewpoint, this disorder matches the Wilson criteria for screening, as it is a significant health problem.4 The Wilson criteria includes: an adequately understood natural history of the disease; a recognizable latent or early symptomatic stage; a test that is easy to perform and interpret which should be devised and should be acceptable, accurate, reliable, sensitive, and specific; accepted treatment for the disease should be recog-nized; said treatment should be more effective the earlier it is applied; there should be a policy on who is treated; diagnosis and treatment are both cost effective; and case-finding should be a continuous process.
The pathogenesis of fatty liver is multifactorial, and it has been suggested that the presence of insulin resistance is an essential requirement for accumulation of hepatocellular fat.5,6 Insulin resistance has been demonstrated to unify NAFLD in the metabolic syndrome, ie, NAFLD may be considered as an additional feature of the metabolic syn-drome, with specific hepatic insulin resistance.7 However, to the best of our knowledge, few evidence-based clinical studies have attempted to determine the possible etiological relationship between the metabolic syndrome and NAFLD in the elderly agricultural and fishing population of Taiwan, which is also faced with the burden of health-related disease. The purpose of this study was to determine the prevalence of obesity, NAFLD, and the metabolic syndrome in the elderly Taiwanese agricultural and fishing population, using a vol-unteer screening program in Taipei, Taiwan.
Materials and methods
study design and data collection
This hospital-based, cross-sectional study was conducted in 6,542 healthy elders (2,553 males and 3,989 females) with an occupational background of agriculture or fishing and voluntarily attending a teaching hospital in northern Taiwan for an annual physical check-up between January 2010 and December 2010. Blood samples and ultrasonography results were collected. After exclusion of subjects without sono-graphy information, the remaining 6,511 (2,540 males and 3,971 females) were enrolled for analysis.
Medical histories and measurements were obtained for the participants by well-trained nurses. Personal and family his-tory of hypertension, type 2 diabetes, cardiovascular disease, and other chronic conditions were obtained by a structured
health interview questionnaire. The study participants were asked to remove their shoes and any other belongings that could possibly add extra weight when they were weighed. Height and weight were evaluated according to body mass index (BMI). Waist circumference was measured to assess abdominal obesity. Blood pressure was measured twice for each subject in the sitting position, with an interval of 15 minutes between measurements, using a standard sphyg-momanometer of appropriate width after a rest period for 30 minutes. Those taking antihypertensive therapy were considered to have known hypertension.8 Fasting blood samples were drawn via venipuncture by clinical nurses. Overnight fasting serum and plasma samples (from whole blood preserved with ethylenediamine tetraacetic acid and sodium fluoride) were kept frozen at −20°C until ready for analysis. All procedures were performed in accordance with the guidelines of the ethics committee at our institution and adhered to the tenets of the Declaration of Helsinki. Ano-nymity of participants and confidentiality of responses were ensured by using numerical codes for questionnaires and destroying the data at the end of study.
Dietary information was derived from a semiquantitative food frequency questionnaire.9 Participants were asked to indicate their average frequency of consumption of typical servings of selected foods during the previous month.
Participants were asked to describe their alcohol intake using a multiple choice format. Beer, wine, and spirits were assessed separately. Current alcohol consumption was assessed by the question “How many cups, glasses, or drinks of these beverages do you usually drink a day or a month, and for how many years?” People who reported drinking alcohol were classified on the basis of the sum of their reported cur-rent consumption of all types of alcoholic beverages. Those who explicitly recorded zero for current consumption of any alcoholic beverage and zero or blank for previous alcohol consumption were deemed to be nondrinkers.10,11
Smoking habits were classified into three groups according to current smoking status, ie, those who had never smoked cigarettes, former smokers, and current smokers. Current smoking was defined as at least one cigarette per day during the preceding years.11,12 Subjects were also divided into three categories according to areca nut use, ie, current chewers, nonchewers (never), and ex-chewers.13 Current areca nut use was defined as use of at least one areca nut per day during the preceding years.
Physical activity was gauged as moderate (60 minutes or more of activities such as brisk walking, domestic chores, car-rying or moving loads up to 20 kg daily) or vigorous (running,
Clinical Interventions in Aging downloaded from https://www.dovepress.com/ by 118.70.13.36 on 20-Aug-2020
Dovepress nonalcoholic fatty liver disease in the elderly population
cycling, swimming, carrying or moving loads over 20 kg). Anything short of moderate physical activity was considered to indicate a sedentary lifestyle.9
Metabolic components, diet, and usual lifestyle habits were recorded from individual records according to age group.
Diagnosis of metabolic syndrome
Metabolic syndrome was diagnosed using the Adult Treat-ment Panel III criteria, according to the presence of at least three of the following five risk factors: central obesity (waist circumference $90 cm in Asian men and $80 cm in Asian women); decreased high-density lipoprotein (HDL) cholesterol (fasting HDL cholesterol ,40 mg/dL or on drug treatment to reduce HDL cholesterol); elevated blood pres-sure (systolic $130 mmHg and/or diastolic $85 mmHg, or antihypertensive drug treatment in a patient with a history of hypertension); hypertriglyceridemia (fasting plasma triglycerides $150 mg/dL or on drug treatment for elevated triglycerides); and hyperglycemia ( fasting glucose level $100 mg/dL or on drug treatment for elevated glucose).8,14,15
Ultrasound examination and diagnosis
Hepatic ultrasonography was performed by two well-trained ultrasonographers using a Nemio SSA-550A probe (Toshiba, Tokyo, Japan). The ultrasonographic criteria used to diag-nose fatty liver included liver and kidney echo discrepancy, increased liver echogenicity, echo penetration into the deeper portion of the liver, and clarity of the liver blood vessel structures.16,17 All outpatients diagnosed by ultrasound as having NAFLD but without a history of Wilson’s disease or intestinal bypass surgery, gluten enteropathy, ingestion of drugs known to cause hepatosteatosis (including metho-trexate, tamoxifen, amiodarone, and nucleoside analogs), positive serology for hepatitis B or C virus, other known liver disease, or excessive alcohol consumption ($30 g/day for males and $20 g/day for females) were enrolled in the study.17,18 The degree of NAFLD on ultrasonography was classified as follows.1. Grade 1 (mild) steatosis: predominantly macrovesicular; involving up to 66% lobules; ballooning occasionally observed in zone 3; scattered mild acute lobular inflam-mation (polymorphonuclear cells) and occasional chronic inflammation (mononuclear cells); mild portal inflamma-tion or no inflammainflamma-tion.
2. Grade 2 (moderate) steatosis: any degree, usually mixed with macrovesicular and microvesicular; ballooning obviously present in zone 3; mild or chronic lobular
inflammation with polymorphonuclear cells possibly noted in association with ballooned hepatocytes, peri-cellular fibrosis; possible mild to moderate portal inflammation.
3. Grade 3 (severe) steatosis: typically involves .66% lobules (panacinar); commonly mixed steatosis; pre-dominantly marked ballooning in zone 3; scattered acute and chronic lobular inflammation, possibly with polymorphonuclear cells concentrated in zone 3; areas of ballooning and perisinusoidal fibrosis; mild to moderate portal inflammation.16–19
Measurements of interobserver
and intraobserver reliability
The Kappa statistic was used to assess agreement of inter-observer and intrainter-observer reliability and ensure consistent diagnosis of NAFLD between specialists. A pilot study was performed using 50 randomly selected healthy subjects who were not the study subjects. For interobserver reliability, the Kappa value for diagnosis of NAFLD was 0.77 (95% confi-dence interval [CI] 0.69–0.88). The intraobserver reliability for diagnosis of NAFLD by one specialist was 0.81 (95% CI 0.76–0.87); for the other specialist, the Kappa value was 0.83 (95% CI 0.73–0.91).
statistical analysis
The statistical analysis was performed using SAS for Win-dows version 9.1 (SAS Institute Inc., Cary, NC, USA). For univariate analysis, the χ2 test was used to assess differences in categorical variables. Multinomial logistic regression is the extension of binary logistic regression when the categorical-dependent outcome has more than two levels.20 This method was also used to provide a set of coefficients for each of the two comparisons of NAFLD and to investigate the indepen-dence of factors associated with the prevalence of NAFLD. Receiver operating characteristic curves were used to explore the characteristics of the diagnostic test by graphing the false positive rate (1-specificity) on the horizontal axis and the true positive rate (sensitivity) on the vertical axis for various cutoff values. A P-value of ,0.05 was considered to represent a statistically significant difference between the test populations.
Results
The overall prevalence of NAFLD in the study population was 27.2% (1,769/6,511), which included mild NAFLD (16.0%), moderate NAFLD (10.3%), and severe NAFLD (0.9%). The prevalence of one or two metabolic risk factors
Clinical Interventions in Aging downloaded from https://www.dovepress.com/ by 118.70.13.36 on 20-Aug-2020
Dovepress
shen et al
and metabolic syndrome was 51.8% and 33.4%, respectively. Figure 1 shows that the prevalence of moderate or severe NAFLD for metabolic syndrome was substantially greater (P,0.0001, χ2 test) for one or two metabolic factors.
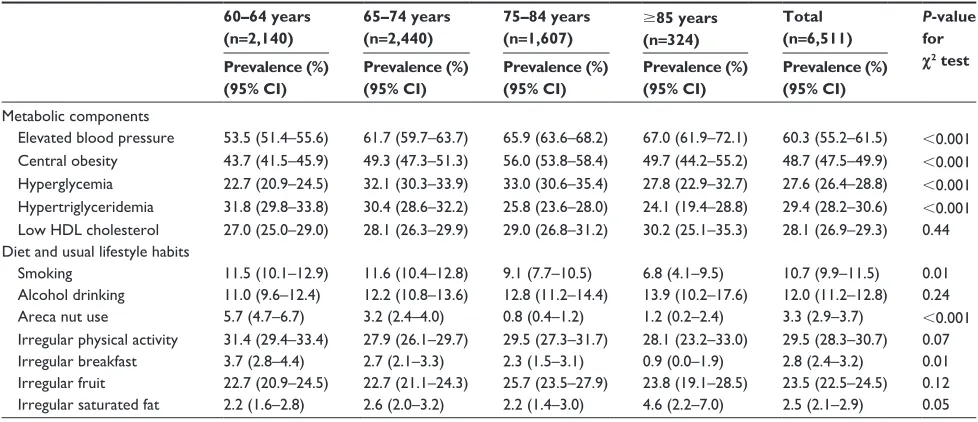
The age-specific prevalence in Chinese elderly subjects with individual metabolic components is shown in Table 1. The most common components in the different age subgroups were elevated blood pressure and central obesity, which was documented in about 60% and 50% of all subjects, respectively. There was a statistically significant difference in prevalence of elevated blood pressure, central obesity, hyperglycemia, and hypertriglyceridemia according to age (P,0.001, χ2 test). Table 1 also shows that younger elderly subjects had a higher prevalence of smoking, areca nut use, and irregular breakfast habits than older elderly subjects.
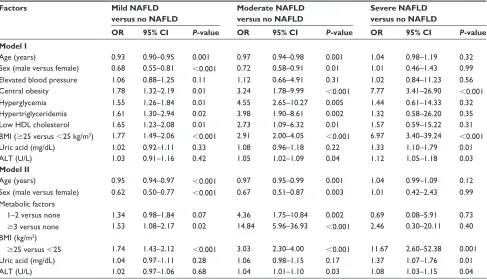
The effect of independent associated risk factors on each type of NAFLD was examined using the
multino-mial logistic regression model. As shown in Table 2, after adjustment for confounding factors, age (odds ratio [OR] 0.93, 95% CI 0.90–0.95), sex (male versus female, OR 0.68, 95% CI 0.55–0.81), central obesity (yes versus no, OR 1.78, 95% CI 1.32–2.19), hyperglycemia (yes versus no, OR 1.55, 95% CI 1.26–1.84), hypertriglyceridemia (yes versus no, OR 1.61, 95% CI 1.30–2.94), low HDL cholesterol (yes versus no, OR 1.65, 95% CI 1.23– 2.08), and higher BMI (yes versus no, OR 1.77, 95% CI 1.49–2.06) appeared to be significantly related to mild NAFLD. Age (OR 0.97, 95% CI 0.94–0.98), sex (male versus female, OR 0.72, 95% CI 0.58–0.91), central obesity (yes versus no, OR 3.24, 95% CI 1.78–9.99), hyperglycemia (yes versus no, OR 4.55, 95% CI 2.65–10.27), hypertriglyceridemia (yes versus no, OR 3.98, 95% CI 1.90–8.61), low HDL cholesterol (yes ver-sus no, OR 2.73, 95% CI 1.09–6.32), higher BMI (yes verver-sus no, OR 2.91, 95% CI 2.00–4.05), and higher alanine amino-transferase (ALT, OR 1.05, 95% CI 1.02–1.09) appeared to be significantly related to moderate NAFLD. Central obesity (yes versus no, OR 7.77, 95% CI 3.41–26.90), higher BMI (yes versus no, OR 6.97, 95% CI 3.40–39.24), higher uric acid (OR 1.33, 95% CI 1.10–1.79), and higher ALT (OR 1.12, 95% CI 1.05–1.18) appeared to be significantly related to severe NAFLD.
In addition, Table 2 shows that age (OR 0.95, 95% CI 0.94–0.97), sex (male versus female, OR 0.62, 95% CI 0.50–0.77), metabolic syndrome (yes versus no, OR 1.53, 95% CI 1.08–2.17), and higher BMI (yes versus no, OR 1.74, 95% CI 1.43–2.12) appeared to be significantly related to mild NAFLD. Age (OR 0.97, 95% CI 0.95–0.99),
Severe Moderate
Mild 10.0
0 20.0 30.0 40.0 50.0 60.0 70.0 80.0
%
0 1–2 3↑
Figure 1 Prevalence of nonalcoholic fatty liver disease with metabolic syndrome factors among elderly screened subjects.
Table 1 Age-specific prevalence of metabolic components, diet, and usual life habits in the study participants
60–64 years (n=2,140)
65–74 years (n=2,440)
75–84 years (n=1,607)
$85 years (n=324)
Total (n=6,511)
P-value for
χ2 test
Prevalence (%) (95% CI)
Prevalence (%) (95% CI)
Prevalence (%) (95% CI)
Prevalence (%) (95% CI)
Prevalence (%) (95% CI)
Metabolic components
elevated blood pressure 53.5 (51.4–55.6) 61.7 (59.7–63.7) 65.9 (63.6–68.2) 67.0 (61.9–72.1) 60.3 (55.2–61.5) ,0.001 Central obesity 43.7 (41.5–45.9) 49.3 (47.3–51.3) 56.0 (53.8–58.4) 49.7 (44.2–55.2) 48.7 (47.5–49.9) ,0.001 hyperglycemia 22.7 (20.9–24.5) 32.1 (30.3–33.9) 33.0 (30.6–35.4) 27.8 (22.9–32.7) 27.6 (26.4–28.8) ,0.001 hypertriglyceridemia 31.8 (29.8–33.8) 30.4 (28.6–32.2) 25.8 (23.6–28.0) 24.1 (19.4–28.8) 29.4 (28.2–30.6) ,0.001 low hDl cholesterol 27.0 (25.0–29.0) 28.1 (26.3–29.9) 29.0 (26.8–31.2) 30.2 (25.1–35.3) 28.1 (26.9–29.3) 0.44 Diet and usual lifestyle habits
smoking 11.5 (10.1–12.9) 11.6 (10.4–12.8) 9.1 (7.7–10.5) 6.8 (4.1–9.5) 10.7 (9.9–11.5) 0.01
Alcohol drinking 11.0 (9.6–12.4) 12.2 (10.8–13.6) 12.8 (11.2–14.4) 13.9 (10.2–17.6) 12.0 (11.2–12.8) 0.24
Areca nut use 5.7 (4.7–6.7) 3.2 (2.4–4.0) 0.8 (0.4–1.2) 1.2 (0.2–2.4) 3.3 (2.9–3.7) ,0.001
Irregular physical activity 31.4 (29.4–33.4) 27.9 (26.1–29.7) 29.5 (27.3–31.7) 28.1 (23.2–33.0) 29.5 (28.3–30.7) 0.07 Irregular breakfast 3.7 (2.8–4.4) 2.7 (2.1–3.3) 2.3 (1.5–3.1) 0.9 (0.0–1.9) 2.8 (2.4–3.2) 0.01 Irregular fruit 22.7 (20.9–24.5) 22.7 (21.1–24.3) 25.7 (23.5–27.9) 23.8 (19.1–28.5) 23.5 (22.5–24.5) 0.12 Irregular saturated fat 2.2 (1.6–2.8) 2.6 (2.0–3.2) 2.2 (1.4–3.0) 4.6 (2.2–7.0) 2.5 (2.1–2.9) 0.05
Abbreviations: CI, confidence interval; HDL, high-density lipoprotein.
Clinical Interventions in Aging downloaded from https://www.dovepress.com/ by 118.70.13.36 on 20-Aug-2020
Dovepress nonalcoholic fatty liver disease in the elderly population
sex (male versus female, OR 0.67, 95% CI 0.51–0.87), metabolic syndrome (1–2 metabolic factors versus none, OR 4.36, 95% CI 1.75–10.84; $3 metabolic factors versus none, OR 14.84, 95% CI 5.96–36.93), higher BMI (yes versus no, OR 3.03, 95% CI 2.30–4.00), and higher ALT (OR 1.04, 95% CI 1.01–1.10) were significantly related to moderate NAFLD. Higher BMI (yes versus no, OR 11.67, 95% CI 2.60–52.38), higher uric acid (OR 1.37, 95% CI 1.07–1.76), and higher ALT (OR 1.08, 95% CI 1.03–1.15) were significantly related to severe NAFLD.
The good sensitivity and specificity of BMI and waist circumference for the diagnosis of severe NAFLD is shown
in Table 3. For BMI, the estimated area under the curve was 0.88 (95% CI 0.82–0.94) for diagnosis of severe NAFLD and the cut-off value estimated as 27.85 kg/m2 with 81% sensitivity and 84% specificity. The area under the curve for waist circumference as an indicator of severe NAFLD was 0.82 (95% CI 0.74–0.89) and the cut-off value, sen-sitivity, and specificity were 90.75 cm, 77%, and 69%, respectively.
Discussion
Undoubtedly, good health and appropriate training are necessary for agricultural and fishing populations. Long
Table 2 Multinomial logistic regression of associated factors for nonalcoholic fatty liver disease (all univariate significant factors were included among elderly screened subjects)
Factors Mild NAFLD
versus no NAFLD
Moderate NAFLD versus no NAFLD
Severe NAFLD versus no NAFLD
OR 95% CI P-value OR 95% CI P-value OR 95% CI P-value Model I
Age (years) 0.93 0.90–0.95 0.001 0.97 0.94–0.98 0.001 1.04 0.98–1.19 0.32
sex (male versus female) 0.68 0.55–0.81 ,0.001 0.72 0.58–0.91 0.01 1.01 0.46–1.43 0.99
elevated blood pressure 1.06 0.88–1.25 0.11 1.12 0.66–4.91 0.31 1.02 0.84–11.23 0.56
Central obesity 1.78 1.32–2.19 0.01 3.24 1.78–9.99 ,0.001 7.77 3.41–26.90 ,0.001
hyperglycemia 1.55 1.26–1.84 0.01 4.55 2.65–10.27 0.005 1.44 0.61–14.33 0.32
hypertriglyceridemia 1.61 1.30–2.94 0.02 3.98 1.90–8.61 0.002 1.32 0.58–26.20 0.35
low hDl cholesterol 1.65 1.23–2.08 0.01 2.73 1.09–6.32 0.01 1.57 0.59–15.22 0.31
BMI ($25 versus ,25 kg/m2) 1.77 1.49–2.06 ,0.001 2.91 2.00–4.05 ,0.001 6.97 3.40–39.24 ,0.001
Uric acid (mg/dl) 1.02 0.92–1.11 0.33 1.08 0.96–1.18 0.22 1.33 1.10–1.79 0.01
AlT (U/l) 1.03 0.91–1.16 0.42 1.05 1.02–1.09 0.04 1.12 1.05–1.18 0.03
Model II
Age (years) 0.95 0.94–0.97 ,0.001 0.97 0.95–0.99 0.001 1.04 0.99–1.09 0.12
sex (male versus female) 0.62 0.50–0.77 ,0.001 0.67 0.51–0.87 0.003 1.01 0.42–2.43 0.99
Metabolic factors
1–2 versus none 1.34 0.98–1.84 0.07 4.36 1.75–10.84 0.002 0.69 0.08–5.91 0.73
$3 versus none 1.53 1.08–2.17 0.02 14.84 5.96–36.93 ,0.001 2.46 0.30–20.11 0.40
BMI (kg/m2)
$25 versus ,25 1.74 1.43–2.12 ,0.001 3.03 2.30–4.00 ,0.001 11.67 2.60–52.38 0.001
Uric acid (mg/dl) 1.04 0.97–1.11 0.28 1.06 0.98–1.15 0.17 1.37 1.07–1.76 0.01
AlT (U/l) 1.02 0.97–1.06 0.68 1.04 1.01–1.10 0.03 1.08 1.03–1.15 0.04
Abbreviations: ALT, alanine aminotransferase; BMI, body mass index; CI, confidence interval; OR, odds ratio; HDL, high-density lipoprotein; NAFLD, nonalcoholic fatty liver disease.
Table 3 receiver operating characteristic results for BMI and waist circumference as markers of nonalcoholic fatty liver disease
Variable Area under curve 95% CI Cut-off value Sensitivity Specificity
Mild nAFlD
BMI 0.61 0.59–0.63 24.75 (kg/m2) 0.65 0.54
Waist circumference 0.57 0.53–0.58 86.25 (cm) 0.57 0.53
Moderate nAFlD
BMI 0.76 0.73–0.78 25.35 (kg/m2) 0.77 0.61
Waist circumference 0.69 0.66–0.71 89.25 (cm) 0.63 0.65
severe nAFlD
BMI 0.88 0.82–0.94 27.85 (kg/m2) 0.81 0.84
Waist circumference 0.82 0.74–0.89 90.75 (cm) 0.77 0.69
Abbreviations: BMI, body mass index; CI, confidence interval; NAFLD, nonalcoholic fatty liver disease.
Clinical Interventions in Aging downloaded from https://www.dovepress.com/ by 118.70.13.36 on 20-Aug-2020
Dovepress
shen et al
and/or irregular working hours may have adverse effects on health. In Taiwan, there are few published population-based studies addressing the prevalence and possible etiology of NAFLD in the elderly Chinese population which, as in other countries, also faces the burden of liver disease. Due to the increased frequency of NAFLD in elderly subjects, it is useful for identifying treatment needs and rehabilitation services, and for planning and implementing comprehensive NAFLD preventive care programs. Preventive health examinations are an important health promotion strategy,21,22 and could help to identify disease at an early stage, delay development of subsequent adverse outcomes, and significantly save health care resources and lives.21
The well-established term “metabolic syndrome” remains the most useful and widely accepted description of the cluster of metabolically related cardiovascular risk fac-tors which also predict a high risk for developing diabetes.23 Previous studies have indicated that the metabolic syn-drome can be viewed as a strong predictor of NAFLD.23–25 Clinical manifestations of NAFLD are usually absent or subtle with abnormal aminotransferase or incidental radiographic findings of fatty liver.26 The pathogenesis of NAFLD is thought to involve a multi-hit process including insulin resistance, oxidative stress, apoptotic pathways, and adipocytokines.26,27 In this study, the metabolic syndrome was significantly related to mild or moderate NAFLD but not to severe NAFLD. More than 80 years have passed since the introduction of the concept of a clustering of metabolic and physiological abnormalities; however, there are still many uncertainties over metabolic syndrome that need to be further unraveled.28 The documented prevalence of NAFLD in this study is clinically significant and a “wake-up call” for government health practitioners and policy makers to be on the alert and also formulate policy to help curtail the impact of NAFLD, especially by measures to reduce the components of metabolic syndrome in view of the association.
BMI and waist circumference are also good predictors of NAFLD.23,29 In this study, higher BMI was associated with an increased risk for NAFLD even after adjusting for other confounding factors. Using the Western criteria for obesity, only 2%–3% of Asian subjects can be identified as obese.29 Asians have a higher proportion of visceral fat and a lower proportion of lean body mass than Caucasians with the same BMI.23 It is of note that we used the receiver operating char-acteristic curve to find the cut-off values for BMI and waist circumference as diagnostic tests for each type of NAFLD. The cut-off values for BMI and waist circumference were
estimated at 27.85 kg/m2 and 90.75 cm, respectively, and imply that a BMI higher than 27.85 kg/m2 or a waist circum-ference greater than 90.75 cm should be considered medium risk for severe NAFLD. In addition, consultation did not suggest a clear BMI cut-off point for overweight or obesity applying to all Asians.30 In this study, public health action may be best targeted to a BMI of 27.85 kg/m2 and stepwise health interventions proposed for the elderly population to prevent severe NAFLD. However, further studies are needed to identify the sensitivity and specificity of clinical markers more accurately in the context of, eg, health screening for the diagnosis of NAFLD.
It is interesting that being elderly and female were significant risk factors for NAFLD in this study. Such a finding would appear to be inconsistent with the results of studies done in the general population or occupational groups elsewhere.16,23,31,32 A possible reason is that the proportion of obesity in males was higher than in females aged ,50 years, but the prevalence of obesity for males proved to be substan-tially greater than for females aged $60 years.33 In Asian countries, the peak age for diagnosis of NAFLD has been reported to be 40–49 years in men and $50 years in women.34 The risk of NAFLD appears to increase with advancing age. Several academic studies using different diagnostic methods have reported similar results.1,5,16,17,23
In addition to obesity metabolic disorders, other risk factors including higher uric acid and higher ALT level for NAFLD were identified in this study. One clinical study showed that a fructose load might lead to a more substan-tial increase in serum uric acid levels in patients suffering chronic hepatitis than would be the case for normal subjects.35 Determination of serum ALT is the most common test used for identification of patients suffering from liver disease, and also acts as a surrogate marker for disease severity and/or an index of hepatic activity.23 The possible mechanism for such a finding may relate to the fact that increased serum ALT concentrations are related to hepatic insulin resistance and suggest that a raised ALT reflects fatty changes in the liver.2 However, we were not able to determine the degree of increase in serum uric acid or ALT levels prior to develop-ment of liver disease because of the cross-sectional nature of our study. Further epidemiological and etiological investiga-tions are needed to clarify the causal relainvestiga-tionship between uric acid, ALT, and NAFLD.
The results of this study indicate a relatively high preva-lence of NAFLD and metabolic syndrome in the elderly Chinese population. An increasing number of people are likely to have a sedentary lifestyle and an energy-dense diet
Clinical Interventions in Aging downloaded from https://www.dovepress.com/ by 118.70.13.36 on 20-Aug-2020
Dovepress nonalcoholic fatty liver disease in the elderly population
as the country becomes more modernized and urbanized.36 Several studies have shown the benefits of dietary modifica-tion, weight loss, and exercise in reducing insulin resistance and in normalization of ALT in patients with NAFLD.37–42 Research also indicates that even small degrees of weight loss of around 5%–10% of total body weight have a clear benefit and suggests that changes in the amount of dietary fat delivered to the liver and subsequent changes in lipid metabolism are as important as weight loss.42
Methodological considerations
This study has several limitations. First, NAFLD was diag-nosed in our elderly study participants by ultrasonography, whereas liver biopsy is the gold standard. However, liver biopsy is an invasive procedure with unpredictable risks, so is ethically unacceptable for use in this type of research.26 Previous reports indicate that ultrasonography has been widely used for detection of NAFLD with high sensitivity (up to 89%) and specificity (up to 93%).43 However, different studies may elect to set slightly different definitions, such that our estimation of what constituted NAFLD could have suffered from some level of misclassification bias. Second, the potential impact on the prevalence and the observed NAFLD-related risk factors in the study were the result of the screening of elderly population from one single area, therefore some estimations were inevitable. However, the study still retained sufficient statistical power to evaluate the various risk factors for NAFLD given its reasonably large sample size. Finally, our measurements were taken at a single point in time, so may not reflect long-term exposure to important environmental or biochemical factors.14
Conclusion
The prevalence of mild or moderate NAFLD was related to obesity and severity of the metabolic syndrome. Higher BMI was related to severe NAFLD but not to the metabolic syndrome. It is important that we target this population for control of obesity and improved metabolic function.
Acknowledgments
This study was supported by the National Science Council (grants NSC-95-2314-B-002-MY3 and NSC-98-2314-B-350-002-MY3) and by New Taipei City Hospital, Taipei, Taiwan.
Disclosure
We certify that all the affiliations with or financial involve-ment in, within the past 5 years and foreseeable future,
any organization or entity with a financial interest in or financial conflict with the subject matter or materials discussed in the manuscript are completely disclosed (eg, employment, consultancies, honoraria, stock ownership or options, expert testimony, grants or patents received or pending, royalties). The authors have no proprietary interest in any aspect of this study. No additional financial support from public or private sources was received for this research.
References
1. Caballería L, Auladell1 MA, Torán P, et al. Risk factors associated with non-alcoholic fatty liver disease in subjects from primary care units. A case-control study. BMC Gastroenterol. 2008;8:44.
2. Chen ZW, Chen LY, Dai HL, Chen JH, Fang LZ. Relationship between alanine aminotransferase levels and metabolic syndrome in nonalcoholic fatty liver disease. J Zhejiang Univ Sci B. 2008;9:616–622.
3. Bedogni G, Bellentani S. Fatty liver: How frequent is it and why? Ann Hepatol. 2004;3:63–65.
4. Chen JY, Tsai ST, Hsu CT, et al. Cost-benefit analysis of screening for gallstone disease among Chinese population in Taiwan. The Open Access Journal of Science and Technology. 2013;1:1–7.
5. Cheng HY, Wang HY, Chang WH, et al. Nonalcoholic fatty liver disease: prevalence, influence on age and sex, and relationship with metabolic syndrome and insulin resistance. Int J Gerontol. 2013;9:194–198. 6. Parekh S, Anania FA. Abnormal lipid and glucose metabolism in obesity:
implications for nonalcoholic fatty liver disease. Gastroenterology. 2007;132:2191–2207.
7. Marchesini G, Brizi M, Bianchi G, et al. Nonalcoholic fatty liver disease: a feature of the metabolic syndrome. Diabetes. 2001;50:1844–1850. 8. Kuo CM, Chien WH, Shen HC, Hu YC, Chen YF, Tung TH. Clinical
epidemiology of reduced kidney function among male elderly fishing and agricultural population in Taipei, Taiwan. Biomed Res Int. 2013;2013:214128.
9. Sachdeva S, Khan Z, Ansari MA, Khalique N, Anees A. Lifestyle and gallstone disease: scope for primary prevention. Indian J Community Med. 2011;36:263–267.
10. Shaper AG, Wannamethee G, Walker M. Alcohol and mortality in British men: explaining the U-shaped curve. Lancet. 1988;2:1267–1273. 11. Chen YF, Hu YC, Shen HC, Chang HT, Tung TH. Clinical implications
in the prevalence and associated cardiovascular factors of elevated serum alanine aminotransferase levels among the elderly agricultural and fishing population in Taipei, Taiwan: experience at a teaching hospital. J Investig Med. 2014;62:88–96.
12. Wang JJ, Tung TH, Yin WH, et al. Effects of moderate alcohol consumption on inflammatory biomarkers. Acta Cardiol. 2008;63:65–72.
13. Tung TH, Chiu YH, Chen LS, Wu HM, Boucher BJ, Chen TH; Keelung Community-based Integrated Screening programme No 2. A population-based study of the association between areca nut chewing and type 2 diabetes mellitus in men (Keelung Community-based Integrated Screen-ing programme No 2). Diabetologia. 2004;47:1776–1781.
14. Jang SY, Kim IH, Ju EY, Ahn SJ, Kim DK, Lee SW. Chronic kidney disease and metabolic syndrome in a general Korean population: the Third Korea National Health and Nutrition Examination Survey (KNHANES III) Study. J Public Health (Oxf). 2010;32:538–546. 15. Grundy SM, Cleeman JI, Daniels SE, et al; American Heart Association;
National Heart, Lung, and Blood Institute. Diagnosis and management of the metabolic syndrome: an American Heart Association/National Heart, Lung, and Blood Institute Scientific Statement. Circulation. 2005;112:2735–2752.
16. Tung T, Chiu W, Lin T, Shih H, Hsu C. An exploration of prevalence and associated factors of nonalcoholic fatty liver disease in the Taiwanese police service. Iran J Public Health. 2011;40:54–62.
Clinical Interventions in Aging downloaded from https://www.dovepress.com/ by 118.70.13.36 on 20-Aug-2020
Clinical Interventions in Aging
Publish your work in this journal
Submit your manuscript here: http://www.dovepress.com/clinical-interventions-in-aging-journal Clinical Interventions in Aging is an international, peer-reviewed journal focusing on evidence-based reports on the value or lack thereof of treat-ments intended to prevent or delay the onset of maladaptive correlates of aging in human beings. This journal is indexed on PubMed Central, MedLine, the American Chemical Society’s ‘Chemical Abstracts
Ser-vice’ (CAS), Scopus and the Elsevier Bibliographic databases. The manuscript management system is completely online and includes a very quick and fair peer-review system, which is all easy to use. Visit http://www.dovepress.com/testimonials.php to read real quotes from published authors.
Dovepress
Dove
press
shen et al
17. Dai HF, Shen Z, Yu CH, Zhang XC, Li YM. Epidemiology of fatty liver in an islander population of China: a population-based case-control study. Hepatobiliary Pancreat Dis Int. 2008;7:373–378.
18. Lin YC, Chou SC, Huang PT, Chiou HY. Risk factors and predictors of non-alcoholic fatty liver disease in Taiwan. Ann Hepatol. 2011;10: 125–132.
19. Sass DA, Chang P, Chopra KB. Nonalcoholic fatty liver disease: a clinical review. Dig Dis Sci. 2005;50:171–180.
20. Chan YH. Multinomial logistic regression. Singapore Med J. 2005;46: 259–269.
21. Chang WC, Lan TH, Ho WC, Lan TY. Factors affecting the use of health examinations by the elderly in Taiwan. Arch Gerontol Geriatr. 2010;50 Suppl 1:S11–S16.
22. Deng BH, Liu HW, Pan PC, Mau LW, Chiu HC. Cost-effectiveness of elderly health examination program: the example of hypertension screening. Kaohsiung J Med Sci. 2007;23:17–24.
23. Tung TH, Chang TH, Chiu WH, et al. Clinical correlation of nonalcoholic fatty liver disease in a Chinese taxi drivers population in Taiwan: experience at a teaching hospital. BMC Res Notes. 2011;4:315. 24. Angulo P, Hui JM, Marchesini G, et al. The NAFLD fibrosis score:
a noninvasive system that identifies liver fibrosis in patients with NAFLD. Hepatology. 2007;45:846–854.
25. Pendino GM, Mariano A, Surace P, et al. Prevalence and etiology of altered liver tests: a population-based survey in a Mediterranean town. Hepatology. 2005;41:1151–1159.
26. Onyekwere CA, Ogbera AO, Balogun BO. Non-alcoholic fatty liver disease and the metabolic syndrome in an urban hospital serving an African community. Ann Hepatol. 2011;10:119–124.
27. Hui JM, Hodge A, Farrell GC, Kench JG, Kriketos A, George J. Beyond insulin resistance in NASH: TNF alpha or adiponectin. Hepatology. 2004;40:46–54.
28. Fan JG, Zhu J, Li XJ, et al. Fatty liver and the metabolic syndrome among Shanghai adults. J Gastroenterol Hepatol. 2005;20:1825–1832. 29. Fan JG, Farrell GC. Epidemiology of non-alcoholic fatty liver disease
in China. J Hepatol. 2009;50:204–210.
30. Misra A, Khurana L. Obesity and the metabolic syndrome in developing countries. J Clin Endocrinol Metab. 2008;93:S9–S30.
31. Ong JP, Younossi ZM. Epidemiology and natural history of NAFLD and NASH. Clin Liver Dis. 2007;11:1–16.
32. Lazo M, Clark JM. The epidemiology of nonalcoholic fatty liver disease: a global perspective. Semin Liver Dis. 2008;28:339–350.
33. Hwang LC, Bai CH, Chen CJ. Prevalence of obesity and metabolic syndrome in Taiwan. J Formo Med Assoc. 2006;105:626–635. 34. Chitturi S, Farrell GC, Hashimoto E, Saibara T, Lau GK, Sollano JD;
Asia-Pacific Working Party on NAFLD. Non-alcoholic fatty liver dis-ease in the Asia-Pacific region: definitions and overview of proposed guidelines. J Gastroenterol Hepatol. 2007;22:778–787.
35. Loguercio C, Nardone G, Sicolo P, Cuomo R, Del Vecchio C, Budillon G. Intravenous load of fructose and fructose 1,6-diphosphate: effects on uricemia in patients with nonalcoholic liver disease. Am J Gastroenterol. 1996;91:559–564.
36. Liu M, Wang J, Bin J, et al. Increasing prevalence of metabolic syndrome in a Chinese elderly population: 2001–2010. PLoS One. 2013;8:e66233.
37. Ueno T, Sugawara H, Sujaku K, et al. Therapeutic effects of restricted diet and exercise in obese patients with fatty liver. J Hepatol. 1997;27: 103–107.
38. Kugelmas M, Hill DB, Vivian B, Marsano L, McClain CJ. Cytokines and NASH: a pilot study of the effects of lifestyle modification and vitamin E. Hepatology. 2003;38:413–419.
39. Schafer S, Kantartzis K, Machann J, et al. Lifestyle intervention in individuals with normal versus impaired glucose tolerance. Eur J Clin Invest. 2007;37:535–543.
40. Hickman IJ, Jonsson JR, Prins JB, et al. Modest weight loss and physical activity in overweight patients with chronic liver disease results in sustained improvements in alanine aminotransferase, fasting insulin, and quality of life. Gut. 2004;53:413–419.
41. Vajro P, Mandato C, Franzese A, et al. Vitamin E treatment in pediatric obesity-related liver disease: a randomized study. J Pediatr Gastroenterol Nutr. 2004;38:48–55.
42. Huang MA, Greenson JK, Chao C, et al. One-year intense nutritional counseling results in histological improvement in patients with nonalcoholic steatohepatitis: a pilot study. Am J Gastroenterol. 2005;100:1072–1081.
43. Li H, Wang YJ, Tan K, et al. Prevalence and risk factors of fatty liver disease in Chengdu, Southwest China. Hepatobiliary Pancreat Dis Int. 2009;8:377–382.
Clinical Interventions in Aging downloaded from https://www.dovepress.com/ by 118.70.13.36 on 20-Aug-2020