Scholarship@Western
Scholarship@Western
Electronic Thesis and Dissertation Repository
7-25-2011 12:00 AM
Dynamic and Static Performance of Large-Capacity Helical Piles
Dynamic and Static Performance of Large-Capacity Helical Piles
in Cohesive Soils
in Cohesive Soils
Mohamed A. ElkasabgyUniversity of Western Ontario
Supervisor
M. Hesham El Naggar
The University of Western Ontario
Graduate Program in Civil and Environmental Engineering
A thesis submitted in partial fulfillment of the requirements for the degree in Doctor of Philosophy
© Mohamed A. Elkasabgy 2011
Follow this and additional works at: https://ir.lib.uwo.ca/etd
Part of the Geotechnical Engineering Commons
Recommended Citation Recommended Citation
Elkasabgy, Mohamed A., "Dynamic and Static Performance of Large-Capacity Helical Piles in Cohesive Soils" (2011). Electronic Thesis and Dissertation Repository. 193.
https://ir.lib.uwo.ca/etd/193
This Dissertation/Thesis is brought to you for free and open access by Scholarship@Western. It has been accepted for inclusion in Electronic Thesis and Dissertation Repository by an authorized administrator of
DYNAMIC AND STATIC PERFORMANCE OF LARGE-CAPACITY
HELICAL PILES IN COHESIVE SOILS
(Spine title: Performance of Large-Capacity Helical Piles)
(Thesis format: Monograph)
by
Mohamed Adel Elkasabgy
Graduate Program in Engineering Science Department of Civil and Environmental Engineering
A thesis submitted in partial fulfillment of the requirements for the degree of
Doctor of Philosophy
The School of Graduate and Postdoctoral Studies The University of Western Ontario
London, Ontario, Canada
ii
THE UNIVERSITY OF WESTERN ONTARIO School of Graduate and Postdoctoral Studies
CERTIFICATE OF EXAMINATION
Supervisor
______________________________ Dr. M. Hesham El Naggar
Supervisory Committee
______________________________ Dr. Timothy Newson
______________________________ Dr. Maged Youssef
Examiners
______________________________ Dr. Kwan Y. Lo
______________________________ Dr. Wenxing Zhou
______________________________ Dr. Robert A. Schincariol
______________________________ Dr. Peijun Guo
The thesis by
Mohamed Adel Elkasabgy
entitled:
Dynamic and Static Performance of Large-Capacity Helical Piles
in Cohesive Soils
is accepted in partial fulfillment of the requirements for the degree of
Doctor of Philosophy
iii
ABSTRACT
Large-capacity helical piles can provide immense construction and performance advantages over the conventional concrete and steel piles. Nowadays, there is significant interest in using large-capacity helical piles to support foundations that would be subjected to both dynamic and static loading.
The main objectives of this thesis are to: investigate the dynamic response and impedances of large-capacity helical piles; develop an analysis methodology for their dynamic response; and investigate their static axial compression and lateral behaviour, considering installation effects on their dynamic and static performances. The thesis presents the first full-scale vertical and horizontal dynamic field testing program executed on large-capacity helical piles, which involved 190 full-scale field load tests on nine instrumented large-capacity helical piles and two driven steel piles with different geometrical configurations installed in cohesive soils. Six piles were tested two weeks after installation and four piles were tested after allowing a recovery period of nine months following installation.
One hundred and seventy six field experiments were conducted to evaluate the dynamic response characteristics of single helical piles and driven piles under different levels of vertical and horizontal harmonic excitations. The effects of various parameters, namely: pile length, number of helix plates and inter-helix spacing, excitation intensity, and soil thixotropy on the dynamic response were investigated. The experimental results were compared to the theoretical predictions of the continuum theory considering linear and nonlinear approaches. Reasonable match was found between the predicted response using the nonlinear approach and the measured response for both vertical and horizontal vibrations. The results demonstrated the significant effects of pile installation on forming weak soil zone around the pile, which stiffened with time following installation. This stiffening was manifested in an average increase in pile stiffness of about 43% and in pile damping of 25 to 90% within a nine month period. In addition, the dynamic response of the helical piles was similar to that of the driven piles.
iv
that corresponds to pile head movement equal to the pile elastic deformation plus 3.5% of helix diameter. The helical piles displayed a superior axial performance with capacities higher than driven pile by about 17 to 85% based on pile configurations.
The effects of attached helices and inter-helix spacing were found to be negligible on the pile lateral capacity and performance. The lateral pile load tests were examined numerically using the p-y approach incorporated in LPILE program. The mobilized soil shear strength parameters and soil moduli of subgrade reaction were back-calculated.
v
CO-AUTHORSHIP
This thesis has been prepared in accordance with the regulation of monograph format stipulated by the school of Graduate and Postdoctoral Studies at the University of Western Ontario. Substantial parts of this thesis were either published in or submitted for publication to peer-reviewed technical journals and conferences. All field work, data analysis, modelling process and writing of initial version of all publications listed below were carried out by the candidate himself. His research advisor and any other co-author, if applicable, revised the documents and contributed to the final version of the publications:
1. Elkasabgy, M.A., and El Naggar, M.H. 2011. Dynamic response of vertically loaded helical and driven steel piles. Canadian Geotechnical Journal, Under Review.
2. Elkasabgy, M.A., El Naggar, M.H., Sakr, M. 2010. Full-scale vertical and horizontal dynamic testing of a double helix screw pile. Proceedings of the 63rd Canadian Geotechnical Conference, Calgary, Alberta, 12-16 Sept., pp. 352-359, Published.
vi
D E D IC A TIO N
D E D IC A TIO N
D E D IC A TIO N
D E D IC A TIO N
To:
To:
To:
To:
M y father A del (G od bless his soul)
M y father A del (G od bless his soul)
M y father A del (G od bless his soul)
M y father A del (G od bless his soul)
M y M other M ona,
M y M other M ona,
M y M other M ona,
M y M other M ona,
M y Sister N erm een, and
M y Sister N erm een, and
M y Sister N erm een, and
M y Sister N erm een, and
vii
ACKNOWLEDGEMENTS
The author would like to express his sincere appreciation and gratitude to his supervisor, Dr. M. Hesham El Naggar for his consistent guidance, advice, encouragement, and support throughout the course of this research. His mentorship and patience are highly appreciated. The author is indebted to the University of Western Ontario, the Natural Sciences and Engineering Council of Canada (NSERC), and the province of Ontario through the Ontario Graduate Scholarship Program (OGS) for financially supporting the research. In addition, sincere appreciation is due to Almita Manufacturing Ltd. for their financial and technical support throughout the field testing.
Special thanks are due to Dr. Mohammed Sakr from Worley Parsons Canada for his assistance and support during the pile testing program. The author would like also to thank all the technical and administrative staff at the Department of Civil and Environmental Engineering, the University of Western Ontario, for their continuous help. Special thanks are extended to Mr. Wilbert Logan for his technical advises during the preparation of the testing apparatuses and equipments.
The author would like to express his deep thanks to his fellow graduate students and friends (Yasser Abdelghany, Muhammad Khan, and Alper Turan) for their assistance and positive spirit. Also, the author would like to genuinely acknowledge the help of Mr. Erden Ertorer in preparing the data acquisition system.
viii
TABLE OF CONTENTS
CERTIFICATE OF EXAMINATION... ii
Abstract... iii
Co-Authorship... v
Dedication... vi
Acknowledgements... vii
Table of Contents... viii
List of Tables... xiii
List of Figures... xv
Notations... xxv
CHAPTER ONE INTRODUCTION 1.1 GENERAL... 1
1.2 OBJECTIVES OF THE THESIS... 2
1.3 TESTING PROGRAM ... 2
1.4 ORGANIZATION OF THE THESIS... 3
CHAPTER TWO BACKGROUND INFORMATION AND LITERATURE REVIEW 2.1 DIFINITION ... 5
2.2 HISTORICAL BACKGROUND... 5
2.3 GEOMETRY AND INSTALLATION... 6
2.4 DESIGN OF SINGLE PILES UNDER COMPRESSION LOADS... 8
2.4.1 End Bearing Capacity ... 9
2.4.2 Skin Friction Capacity ... 13
2.4.2.1 The α method... 13
ix
2.4.3 Direct Approaches: Capacity by Cone Penetrometer ... 18
2.4.3.1 Bustamante and Gianeselli method (LCPC method) ... 18
2.4.3.2 De Ruiter and Beringen method ... 19
2.5 DESIGN OF HELICAL PILES UNDER COMPRESSION LOADS ... 21
2.5.1 Cylindrical Shear Method ... 22
2.5.1.1 Piles in cohesive soils ... 22
2.5.1.2 Piles in cohesionless soils ... 23
2.5.2 Individual Plate Bearing Method ... 24
2.6 DYNAMIC ANALYSIS OF PILES ... 26
2.6.1 Theoretical Studies... 26
2.6.1.1 Continuum approach... 26
2.6.1.5 Finite element method... 31
2.6.2 Dynamic Response of Pile Foundations: Experimental Study ... 33
2.6.2.1 Full scale field test ... 33
2.6.2.2 Small scale model field test ... 35
2.6.2.3 Small scale laboratory test ... 37
CHAPTER THREE PILES DEVELOPMENT AND TESTING PROGRAM 3.1 INTRODUCTION ... 38
3.2 PILES CHARACTERISTICS AND INSTALLATION... 38
3.3 PILES INSTRUMENTATION... 40
3.4 TEST SITE LAYOUT ... 49
3.5 DYNAMIC TESTS... 50
3.6 STATIC TESTS... 50
3.6.1 Loading System ... 50
3.6.2 Displacement Measurements ... 51
3.6.3 Axial Compression Test Reaction System... 51
3.6.4 Lateral load Test Reaction System ... 52
x
CHAPTER FOUR
TEST SITE INVESTIGATION
4.1 SITE LOCATION AND SURFICIAL GEOLOGY ... 62
4.2 SUBSURFACE INVESTIGATION PROGRAM ... 62
4.2.1 Cone Penetration Testing Apparatus and Procedures ... 63
4.3 SUMMARY OF SUBSURFACE CONDITIONS ... 67
4.3.1 Stratigraphy... 67
4.3.2 Cone Penetration Profiles ... 68
4.3.3 Index Properties ... 69
4.3.4 Shear Strength Parameters and Stress History... 84
4.3.5 Body Wave Velocities ... 91
4.3.6 Deformation Parameters ... 93
4.3.6.1 Small-strain stiffness... 93
4.3.6.2 Large-strain stiffness... 95
4.3.7 Summary of Soil Parameters ... 98
CHAPTER FIVE EXPERIMENTAL AND THEORETICAL DYNAMIC INVESTIGATION 5.1 INTRODUCTION ... 115
5.2 EXPERIMENTAL SETUP... 115
5.2.1 Test Piles... 116
5.2.2 Test Body Mass... 116
5.2.3 Excitation Mechanism ... 117
5.2.4 Instrumentation ... 118
5.3 TEST PROCEDURES ... 120
5.3.1 Steady-state test ... 120
5.3.2 Free vibration test ... 121
5.4 DYNAMIC RESPONSE OF PILES... 122
xi
5.4.2 Steady-state vertical vibration... 124
5.4.3 Steady-state horizontal vibration ... 126
5.5 THEORETICAL ANALYSIS ... 143
5.5.1 Linear Analysis ... 143
5.5.2 Nonlinear Analysis... 144
5.6 COMPARISON OF THEORETICAL AND EXPERIMENTAL RESULTS ... 146
5.6.1 Comparison with Linear Analysis ... 148
5.6.1.1 Vertical vibration ... 148
5.6.1.2 Horizontal vibration ... 149
5.6.2 Comparison with Nonlinear Analysis ... 154
5.6.2.1 Vertical vibration ... 154
5.6.2.2 Horizontal vibration ... 164
5.6.3 Load Transfer Mechanism ... 170
5.6.4 Pile Stiffness and Damping... 171
5.6.4.1 Vertical vibration ... 171
5.6.4.2 Horizontal vibration ... 172
5.6.5 Separation between Pile and Soil... 173
5.6 SUMMARY AND CONCLUSIONS ... 182
CHAPTER SIX AXIAL COMPRESSIVE PILE LOAD TESTING AND ANALYSIS 6.1 INTRODUCTION ... 185
6.2 AXIAL COMPRESSION LOAD TEST RESULTS ... 185
6.2.1 Load-Settlement Curves... 187
6.2.2 Settlement-Time Response ... 203
6.2.3 Distribution of Axial Load along Helical Piles... 208
6.2.4 Bearing Pressure of Helices Compared to CPT Resistance... 216
6.2.5 Inferred Shaft Resistance Mobilized by Helical Piles ... 217
xii
CHAPTER SEVEN
LATERAL PILE LOAD TESTING AND ANALYSIS
7.1 INTRODUCTION ... 230
7.2 PILE LATERAL LOAD TESTS ... 233
7.2.1 Lateral Capacity of Tested Helical Piles... 233
7.2.2 Lateral Performance of Tested Helical Piles ... 238
7.3 ANALYSIS OF TEST RESULTS USING LPILE PROGRAM ... 243
7.3.1 First Approach ... 243
7.3.2 Second Approach ... 245
7.4 SUMMARY AND CONCLUSIONS ... 251
CHAPTER EIGHT CONCLUSIONS AND RECOMMENDATIONS252 8.1 SUMMARY... 252
8.2 CONCLUSIONS... 253
8.3 RECOMMENDATIONS FOR FUTURE RESEARCH... 258
REFERENCES... 259
xiii
LIST OF TABLES
Table 3.1. Test and reaction piles geometrical properties... 39
Table 3.2. Conducted dynamic and static tests ... 54
Table 4.1. Undrained shear strength of clay... 86
Table 4.2. Drained shear strength and stress history of silty sand and silt layers ... 91
Table 4.3. Soil properties ... 99
Table 5.1. Material properties of the test piles ... 117
Table 5.2. Properties of test body, oscillator, and pile cap ... 117
Table 5.3. Nonlinear analysis parameters for vertical vibration ... 156
Table 5.4. Experimental and theoretical vertical vibration response for 6.0 m helical piles and 49 plate test body... 163
Table 5.5. Experimental and theoretical vertical vibration response for driven piles and 59 plate test body ... 163
Table 5.6. Nonlinear analysis parameters for horizontal vibration ... 164
Table 5.7. Experimental and theoretical vertical vibration response for 9.0 m helical piles and 59 plate test body... 168
Table 5.8. Experimental and theoretical horizontal vibration response for 9.0 m helical piles tested nine months after installation ... 169
Table 5.9. Experimental and theoretical horizontal vibration response for driven piles and 59 plate test body ... 170
Table 6.1. Test piles geometrical properties ... 186
Table 6.2. Pile notations... 187
Table 6.3. Load test data ... 188
Table 6.4. Ultimate pile capacity established from different criteria... 195
xiv
Table 6.6. Percentage of load transferred by different sections of piles ... 212
Table 6.7. Unit shaft adhesion for all piles along the upper 4.0 m ... 223
Table 6.8. Back-calculated shear strength mobilized by pile SS11 ... 224
Table 6.9. Back-calculated shear strength mobilized by pile SD11... 224
Table 6.10. Back-calculated shear strength mobilized by pile SD21... 225
Table 6.11. Back-calculated shear strength mobilized by pile SD31... 225
Table 6.12. Back-calculated shear strength mobilized by pile LS12 ... 226
Table 6.13. Back-calculated shear strength mobilized by pile LD12 ... 226
Table 7.1. Pile notations for lateral load tests ... 233
Table 7.2. Lateral load test results... 236
xv
LIST OF FIGURES
Figure 2.1. Geometrical configurations of a helical pile... 7
Figure 2.2. Helical pile installation... 8
Figure 2.3. Adhesion factor for driven piles by Tomlinson (1957) ... 17
Figure 2.4. Adhesion factor for driven piles in till by Weltman and Healy (1978)... 17
Figure 2.5. Average adhesion factor by CFEM (2006)... 17
Figure 2.6. Combined shaft resistance factor for piles in sand by Meyerhof (1976)... 17
Figure 2.7. CPT method to determine equivalent cone resistance at pile base (after Bustamante and Gianeselli, 1982) ... 19
Figure 2.8. CPT method by De Ruiter and Beringen (1979): a) predicting pile capacity; b) correction for overconsolidated sand ... 20
Figure 2.9. Failure modes: a) cylindrical shear method; b) individual plate method .. 25
Figure 3.1. Dimensions of piles; a) SS1; b) LS1 ... 42
Figure 3.2. Dimensions of piles; a) SD1; b) LD1 ... 43
Figure 3.3. Dimensions of piles; a) SD2; b) LD2 ... 44
Figure 3.4. Dimensions of piles; a) SD3; b) LD3 ... 45
Figure 3.5. Installation process of pile SD2 ... 46
Figure 3.6. Installation process of driven piles ... 46
Figure 3.7. Strain gauges installation and protection on pile shaft outer surface ... 46
Figure 3.8. Strain gauges installation and protection on pile shaft inner surface ... 47
Figure 3.9. Wires protected by fibreglass insulation ... 47
Figure 3.10. Pile assembly at manufacturer’s machine shop ... 48
Figure 3.11. Pile after assembly... 48
xvi
Figure 3.13. Site layout ... 54
Figure 3.14. Load cell calibration chart ... 55
Figure 3.15. Setup for linear displacement transducers, dial gauges, and reference beams for axial compression test ... 55
Figure 3.16. Setup for linear displacement transducers and reference beam for lateral test ... 56
Figure 3.17. Compression test setup for helical piles ... 56
Figure 3.18. Compression test setup for driven piles... 57
Figure 3.19. Load a test pile during a compression test... 57
Figure 3.20. A schematic layout of the axial compression test of helical piles ... 58
Figure 3.21. A schematic layout of the axial compression test of driven piles ... 59
Figure 3.22. Lateral load test setup ... 60
Figure 3.23. Lateral load test connection at the test pile... 60
Figure 3.24. A schematic layout of the Lateral load test ... 61
Figure 4.1. Location of the test site... 64
Figure 4.2. Drill rig used for soil sampling and SPT tests ... 65
Figure 4.3. Cone truck used to perform SCPT tests... 65
Figure 4.4. Seismic CPT cone... 66
Figure 4.5. Shear and compression waves source... 66
Figure 4.6. a) shear wave generation; b) compression wave generation ... 67
Figure 4.7. Soil stratigraphy-cross section along the centreline of the 6.0 m piles ... 73
Figure 4.8. Soil stratigraphy-cross section along the centreline of the 9.0 m piles ... 74
Figure 4.9. Cone penetration profile for SCPT1... 75
xvii
Figure 4.11. Cone penetration profile for SCPT3... 77
Figure 4.12. Soil classification results based on Robertson et al. (1986): a) SCPT1; b) SCPT2; c) SCPT3... 78
Figure 4.13. Soil classification results based on Robertson (1990): a) SCPT1; b) SCPT2; c) SCPT3... 79
Figure 4.14. Index properties ... 80
Figure 4.15. Grain size distribution for the clayey silt soil... 81
Figure 4.16. Grain size distribution for the silty sand soil ... 82
Figure 4.17. Relative density for silty sand based on Baldi et al. (1986) ... 82
Figure 4.18. Profiles of the measured and estimated SPT N values ... 83
Figure 4.19. Profiles of clay shear strength estimated from CPT based correlations .. 100
Figure 4.20. Profiles of clay shear strength estimated from SPT based correlations .. 101
Figure 4.21. Variation of Shear strength and strength ratio with depth... 102
Figure 4.22. Profiles of over-consolidation ratio and coefficient of lateral earth pressure for clayey soils... 103
Figure 4.23. Estimated peak effective angle of internal friction, φ', using Robertson and Campanella (1983) method ... 104
Figure 4.24. Estimated peak effective angle of internal friction, φ', using De Mello (1971) method... 104
Figure 4.25. Profiles of seismic wave velocities and Poisson’s ratio for SCPT1 ... 105
Figure 4.26. Profiles of seismic wave velocities and Poisson’s ratio for SCPT2 ... 106
Figure 4.27. Profiles of seismic wave velocities and Poisson’s ratio for SCPT3 ... 107
Figure 4.28. Profiles of small-strain shear modulus, Gmax... 108
Figure 4.29. Distribution of shear modulus to strength ratio ... 109
xviii
Figure 4.31. Measured and predicted axial response for: a) pile SS1; b) pile LS1... 110
Figure 4.32. Modulus degradation in terms of mobilized load for pile SS1 and pile LS1... 110
Figure 4.33. Distribution of the secant Young’s modulus ... 111
Figure 4.34. Profiles of undrained secant modulus of clayey soil to strength ratio... 112
Figure 4.35. Profiles of rigidity index... 113
Figure 4.36. Normalized pore pressure dissipation at -14.25 m at SCPT1... 114
Figure 5.1. Schematic diagram of dynamic test setup ... 119
Figure 5.2. View for test setup: a) vertical vibration; and b) horizontal vibration .... 119
Figure 5.3. Location of accelerometers... 120
Figure 5.4. Free vibration test results of Pile SD21 ... 122
Figure 5.5. Free vibration test results of Pile LD12... 123
Figure 5.6. Free vibration test results of Pile LD22... 123
Figure 5.7. Free vibration test results of Pile DL1... 123
Figure 5.8. Vertical vibration amplitudes for: a) SS11; b) SD11; c) SD21; and d) SD31 ... 128
Figure 5.9. Vertical vibration amplitudes: a) LS11; b) LD11; c) LD21; and d) LD31 ... 129
Figure 5.10. Vertical vibration amplitudes: a) DS1; and b) DL1 ... 130
Figure 5.11. Dimensionless vertical response curves for: a) DS1; and b) DL1... 130
Figure 5.12. Dimensionless vertical response curves for: a) SS11; b) SD11; c) SD21; and d) SD31 ... 131
Figure 5.13. Dimensionless vertical response curves for: a) LS11; b) LD11; c) LD21; and d) LD31 ... 132
xix
Figure 5.15. Dimensionless vertical response curves for: a) LS12; b) LD12; c) LD22; and d) LD32 ... 134
Figure 5.16. Horizontal vibration amplitudes (49 plate test body) for: a) SS11; b) SD11; c) SD21; and d) SD31 ... 135
Figure 5.17. Horizontal vibration amplitudes (59 plate test body) for: a) SS11; b) SD11; c) SD21; and d) SD31 ... 136
Figure 5.18. Horizontal vibration amplitudes (59 plate test body) for: a) LS11; b) LD11; c) LD21; and L) SD31... 137
Figure 5.19. Horizontal vibration amplitudes (59 plate test body) for: a) DS1; and b) DL1 ... 138
Figure 5.20. Dimensionless horizontal response curves (59 plate test body) for: a) DS1; and b) DL1... 138
Figure 5.21. Horizontal vibration amplitudes (29 plate test body) for: a) LS12; b) LD12; c) LD22; and d) LD32... 139
Figure 5.22. Horizontal vibration amplitudes (59 plate test body) for: a) LS12; b) LD12; c) LD22; and d) LD32... 140
Figure 5.23. Dimensionless horizontal response curves (29 plate test body) for: a) LS12; b) LD12; c) LD22; and d) LD32... 141
Figure 5.24. Dimensionless horizontal response curves (59 plate test body) for: a) LS12; b) LD12; c) LD22; and d) LD32... 142
Figure 5.25. Schematic diagram for the nonlinear analysis model ... 146
Figure 5.26. Distribution of shear wave velocity for: a) SS1; b) SD1; c) SD2; d) SD3; e) LS1; f) LD1, DS, and DL; g) LD2; and h) LD3 ... 147
Figure 5.27. Experimental versus linear analysis vertical response curves (49 plate test body) for: a) SS11; b) SD11; c) SD21; and d) SD31 ... 150
Figure 5.28. Experimental versus linear analysis vertical response curves (59 plate test body) for: a) LS11; b) LD11; c) LD21; and d) LD31 ... 151
Figure 5.29. Experimental versus linear analysis vertical response curves (59 plate test body) for: a) LS12; and b) LD12... 152
xx
Figure 5.31. Experimental versus linear analysis horizontal response curves (29 plate test body) for: a) LS12; and b) LD12... 153
Figure 5.32. Experimental versus linear analysis horizontal response curves (59 plate test body) for: a) LS12; and b) LD12... 153
Figure 5.33. Experimental versus linear analysis horizontal response curves (59 plate test body) for: a) DS1; and b) DL1 ... 154
Figure 5.34. Distribution of weak zone shear modulus ratio, Gm/Go, and damping ratio, Dm, (vertical-49 plate test body) for: a) SS11; b) SD11; c) SD21; and d) SD31 ... 157
Figure 5.35. Distribution of weak zone shear modulus ratio, Gm/Go, and damping ratio, Dm, (vertical-59 plate test body) for: a) LS11; b) LD11; c) LD21; and d) LD31 ... 158
Figure 5.36. Distribution of weak zone shear modulus ratio, Gm/Go, and damping ratio, Dm, (vertical-59 plate test body) for: a) LS12; and b) LD12... 159
Figure 5.37. Distribution of weak zone shear modulus ratio, Gm/Go, and damping ratio, Dm, (vertical-59 plate test body) for: a) DS1; and b) DL1 ... 159
Figure 5.38. Experimental versus nonlinear analysis vertical response curves (49 plate test body) for: a) SS11; b) SD11; c) SD21; and d) SD31 ... 160
Figure 5.39. Experimental versus nonlinear analysis vertical response curves (59 plate test body) for: a) LS11; b) LD11; c) LD21; and d) LD31 ... 161
Figure 5.40. Experimental versus nonlinear analysis vertical response curves (59 plate test body) for: a) LS12; and b) LD12... 162
Figure 5.41. Experimental versus nonlinear analysis vertical response curves (59 plate test body) for: a) DS1; and b) DL1 ... 162
Figure 5.42. Distribution of weak zone shear modulus ratio, Gm/Go, and damping ratio, Dm, (horizontal-29 plate test body) for: a) LS12; and b) LD12... 165
Figure 5.43. Distribution of weak zone shear modulus ratio, Gm/Go, and damping ratio, Dm, (horizontal-59 plate test body) for: a) LS12; and b) LD12... 165
xxi
Figure 5.45. Experimental versus nonlinear analysis horizontal response curves (29 plate test body) for: a) LS12; and b) LD12... 166
Figure 5.46. Experimental versus nonlinear analysis horizontal response curves (59 plate test body) for: a) LS12; and b) LD12... 167
Figure 5.47. Experimental versus nonlinear analysis horizontal response curves (59 plate test body) for: a) DS1; and b) DL1 ... 167
Figure 5.48. Experimental versus nonlinear analysis dynamic load in piles: a) SS11; b) SD11; c) SD21; and d) SD31 ... 174
Figure 5.49. Experimental versus nonlinear analysis dynamic load in piles: a) LS11; b) LD11; c) LD21; and d) LD31... 175
Figure 5.50. Experimental versus nonlinear analysis dynamic load in piles: a) LS12; and b) LD12, and nonlinear analysis dynamic load in piles: c) DS1; and d) DL1... 176
Figure 5.51. Experimental bending moment distribution in pile LS12 (29 plate test body) ... 177
Figure 5.52. Nonlinear versus linear vertical impedances for: a) LS11; and b) LD11 ... 178
Figure 5.53. Nonlinear versus linear vertical impedances for: a) LS12; and b) LD12 ... 179
Figure 5.54. Nonlinear versus linear vertical impedances for: a) DS1; and b) DL1 ... 180
Figure 5.55. Nonlinear versus linear horizontal impedances for pile LD12 (59 plate test body)... 181
Figure 5.56. Nonlinear versus linear horizontal impedances for pile DL1 (59 plate test body)... 181
Figure 5.57. Theoretical relationships between pile separation and maximum
vibration amplitude: a) vertical vibration; and b) horizontal vibration... 182
Figure 6.1. Axial compression load test results for the 6.0 m helical piles ... 188
Figure 6.2. Axial compression load test results for the 9.0 m helical piles ... 189
xxii
Figure 6.4. a) Typical load-settlement curves for drilled foundations and b) regions of load-settlement curve... 196
Figure 6.5. Load-settlement curve for pile SS11 ... 197
Figure 6.6. Load-settlement curve for pile SD11... 197
Figure 6.7. Load-settlement curve for pile SD21... 198
Figure 6.8. Load-settlement curve for pile SD31... 198
Figure 6.9. Load-settlement curve for pile LS12 ... 199
Figure 6.10. Load-settlement curve for pile LD12 ... 199
Figure 6.11. Load-settlement curve for pile DS1... 200
Figure 6.12. Load-settlement curve for pile DL1 ... 200
Figure 6.13. Load capacities interpreted from different criteria for the 6.0 m helical piles ... 201
Figure 6.14. Load capacities interpreted from different criteria for the 9.0 m helical piles and the 6.0 m and 9.0 m driven piles... 201
Figure 6.15. Normalized load-settlement curves for the 6.0 m helical piles ... 202
Figure 6.16. Normalized load-settlement curves for the 9.0 m helical piles ... 202
Figure 6.17. Normalized load-settlement curves for the driven piles ... 203
Figure 6.18. Time-dependent settlement (creep) for selected load increments (Pile SS11)... 204
Figure 6.19. Time-dependent settlement (creep) for selected load increments (Pile SD11) ... 205
Figure 6.20. Time-dependent settlement (creep) for selected load increments (Pile SD21) ... 205
Figure 6.21. Time-dependent settlement (creep) for selected load increments (Pile SD31) ... 206
xxiii
Figure 6.23. Time-dependent settlement (creep) for selected load increments (Pile LD12)... 207
Figure 6.24. Time-dependent settlement (creep) for selected load increments (Pile DS1)... 207
Figure 6.25. Time-dependent settlement (creep) for selected load increments (Pile DL1) ... 208
Figure 6.26. Load distribution curves for: a) SS11; b) SD11; c) SD21; and d) SD31 ... 210
Figure 6.27. Load distribution curves for: a) LS12; and b) LD12 ... 211
Figure 6.28. Loads transferred to soil from pile SS11 ... 213
Figure 6.29. Loads transferred to soil from pile SD11 ... 214
Figure 6.30. Loads transferred to soil from pile SD21 ... 214
Figure 6.31. Loads transferred to soil from pile SD31 ... 215
Figure 6.32. Loads transferred to soil from pile LS12... 215
Figure 6.33. Loads transferred to soil from pile LD12 ... 216
Figure 6.34. Bearing pressures at failure generated by helices and pile toe compared to SCPT tip resistance profiles... 222
Figure 7.1. Lateral load test results for the 6.0 m helical piles ... 236
Figure 7.2. Lateral load test results for the 9.0 m helical piles ... 237
Figure 7.3. A gap formed behind test pile during lateral loading ... 237
Figure 7.4. Load-rotation curves for piles SD11 and LD12 ... 238
Figure 7.5. Distribution of bending moment at different lateral displacements for piles: a) SD11; and b) LD12 ... 241
Figure 7.6. Distribution of soil resistance at different lateral displacements at point load for piles: a) SD11; and b) LD12... 241
xxiv
Figure 7.8. a) p-y curves; and b) subgrade reactions at location of maximum
moment ... 242
Figure 7.9. Measured versus predicted Lateral load-displacement curves for pile SD11 ... 247
Figure 7.10. Measured versus predicted Lateral load-displacement curves for pile LD12 ... 247
Figure 7.11. Measured versus predicted (first approach): a) distribution of bending moment; b) pile shaft deflection for pile SD11 ... 248
Figure 7.12. Measured versus predicted (first approach): a) distribution of bending moment; b) pile shaft deflection for pile LD12 ... 248
Figure 7.13. P-Y curves for piles SD11 and LD12 for: a) layer 1; b) layer 2; c) layer 3; and d) layer 5 ... 249
Figure 7.14. Measured versus predicted (second approach): a) distribution of
bending moment; b) pile shaft deflection for pile SD11... 250
Figure 7.15. Measured versus predicted (second approach): a) distribution of
xxv
NOTATIONS
a Equal to 1.5 times pile diameter
A Area of pile cross section
ac Penetration cone rod radius
Ah Area of the helix plate
ao Dimensionless frequency
As Area of the pile shaft
At Area of the pile toe
b Foundation base inclination factor
B Minimum footing width/diameter
BH Mechanical borehole
c Viscous damping coefficient
C Soil cohesion
C′ Effective soil cohesion
Cc Soil compression index
CD Borehole diameter correction factor = 1.0
CE Rod energy correction factor = 0.92
C.G. Centre of gravity
ch Coefficient of horizontal consolidation
CIFECM Consistent infinitesimal finite element cell method
CN Overburden correction factor
CPT Cone penetration test
CR Rod length correction factor = 1.0
CS Liner correction factor = 1.0
Cu Undrained shear strength of cohesive soil
Cu1 Real part of the dimensionless complex horizontal soil stiffness at
pile toe
Cu2 Imaginary parts of the dimensionless complex horizontal soil
stiffness at pile toe
xxvi
(Cu/σ'vo)NC In-situ strength ratio in a normally consolidated state
Cv1 Real part of the dimensionless complex vertical soil stiffness at
pile toe
Cv2 Imaginary parts of the dimensionless complex vertical soil stiffness
at pile toe
1
vv
c Pile damping constant
dc, dq, dγ Depth factors
d Pile shaft diameter/toe diameter
D Helix plate diameter
Dm Damping ratio of soil in the weak boundary zone
Do Material damping
Dr Relative density
Ds Dimensionless damping constant or damping ratio
D.S.F. Damping safety factor
e Void ratio
eo Initial void ratio
E Young’s modulus of soil
E/Ei Soil Young’s modulus degradation factor
Eds Drained secant modulus of soil
Ei Initial Young’s modulus
Eib Initial Young’s modulus at the pile base
Ep Young's modulus of pile
Es Secant Young’s modulus
Eui Initial-tangent undrained Young’s modulus
Eus Undrained secant Young’s modulus of soil
Eus/Cu Secant undrained Young’s modulus to strength ratio
E50 Axial strain at 50% of the undrained strength of the site soils
F Length factor
FEA Finite element analysis
xxvii
fmu1and fmu2 Dimensionless horizontal stiffness and damping constants of the
composite medium
fmv1 and fmv2 Dimensionless vertical stiffness and damping constants of the composite medium
fmψ1 and fmψ2 Dimensionless rocking stiffness and damping constants of the composite medium
Fr Normalized friction ratio
fres Resonant frequency
fs Cone sleeve friction
fum1 and fum2 Dimensionless horizontal stiffness and damping parameters of pile
in composite medium
ƒv1 Dimensionless stiffness parameter of pile
ƒv2 Dimensionless damping parameter of pile
fvm1 and fvm2 Dimensionless vertical stiffness and damping parameters of pile in
composite medium
g Ground inclination factor
G Soil shear modulus
Gm small-strain shear modulus of soil weak boundary zone
Gmax Small-strain shear modulus of soil
Gm/Go shear modulus ratio
Go Small-strain shear modulus of soil around the weakened zone
Gos and Got Small-strain shear modulus of soil along pile shaft and toe, respectively
Gs Soil specific gravity
Gs Secant shear modulus
H Helical pile embedment depth or the foundation depth
Hc Pile critical depth
Hc/d Pile critical embedment ratio
H/d Pile embedment ratio
Heff Effective length of the shaft of helical pile
xxviii
Hn Depth to bottom helix
Hres Amplitude of horizontal vibration at resonant
Hshaft Length of the shaft section corresponding to a certain soil layer
I Moment of inertia of pile
ic, iq, iγ Load inclination factors
Ic Soil behaviour type index
If Influence factor for pile settlement calculation
IL Soil liquidity index
IP Soil plasticity index
IR Rigidity index which is calculated using soil shear modulus
Irr Reduced rigidity index
k Factor that varies between 0.2 and 0.4
K Modulus of subgrade reaction
Kc End bearing coefficient
Kmu Total stiffness of single pile for horizontal vibration
Kmv Total stiffness of single pile for vertical vibration
Kmψ Total stiffness of single pile for rocking vibration
Ko At-rest coefficient of lateral earth pressure
Ks Coefficient of lateral earth pressure
Ku Complex impedance function for horizontal vibration
ku1 and ku2 Horizontal dynamic stiffness and damping impedances
Kum Total horizontal stiffness of pile in the composite medium
kum1 and kum2 Horizontal stiffness and damping impedances of pile in composite
medium
kus Dynamic soil reaction along pile shaft for horizontal vibration
kut Dynamic soil reaction at pile toe for horizontal vibration
Kv Complex impedance function for vertical vibration
kv1 and kv2 Vertical dynamic stiffness and damping impedances
Kvm Total vertical stiffness of pile in the composite medium
xxix
kvs Dynamic soil reaction along pile shaft for vertical vibration
kvt Dynamic soil reaction at pile toe for vertical vibration
1
vv
k Pile stiffness constant
l Pile-soil separation length
L Pile length
Lc Distance between top and bottom helices
LDT Linear displacement transducers
me Oscillator eccentric rotating masses
me e Excitation intensity of the Lazan mechanical oscillator
Mi Bending moment at strain gauges level i
(m/me.e).V Dimensionless vertical amplitude
M.P.F. Mass participation factor
N Number of blows from standard penetration test/0.3m
Nc, Nq and Nγ Bearing capacity factors
Nk Cone factor
Nkt Cone factor defined as (qt-σvo)/Cu
N(60) Corrected standard penetration test N values for the rod energy
N1(60) Corrected N values for the effect of the overburden pressure
OCR Overconsolidation ratio of soil
p Lateral soil resistance
Pd Dynamic force
Q Applied load on pile
qb Unit end bearing capacity
Qb Pile toe ultimate end bearing capacity
Qbearing Bearing resistance of the bottom plate
qc Measured (uncorrected) cone tip resistance
qca Average cone tip resistance
q'ca Mean cone tip resistance along a distance between +a and –a
measured from the pile toe
Qcylinder Frictional resistance along the cylindrical failure surface
xxx
Q/Qult Applied load to ultimate load ratio of pile
qs Unit skin friction capacity
Qs Ultimate skin friction resistance mobilized along the pile shaft
Qshaft Frictional resistance along the pile shaft
qt Corrected cone tip resistance
Qt Normalized cone resistance
qt-σvo Net cone resistance
Qult Ultimate compression load capacity
Q upper-helix Ultimate end bearing capacity of the upper helix
R Pile radius
Rf Cone frictional ratio
t
R Pile toe radius
Sc, Sq, Sγ Shape factors
s Inter-helix spacing
SCPT Seismic cone penetration test
S/D Inter-helix spacing ratio
SF Spacing ratio factor
SG Strain gauge
Sj1 and Sj2 Real and imaginary parts of the dimensionless complex stiffness in
direction j
Sp Pile settlement
SPT Standard penetration test
Su1 Real part of the dimensionless complex soil horizontal stiffness
along pile shaft
Su2 Imaginary part of the dimensionless complex soil horizontal
stiffness along pile shaft
Sv1 Real part of the dimensionless complex soil vertical stiffness along
pile shaft
Sv2 Imaginary part of the dimensionless complex soil vertical stiffness
along pile shaft
xxxi
T Soil consolidation modified time factor
tm Thickness of soil weak boundary zone
U Normalized excess pore pressure
Umax Maximum horizontal vibration amplitude
UU Unconsolidated-undrained triaxial test
x
U&& and U&&x+1 Acceleration peaks in two successive cycles
u2 Pore pressure measured immediately behind the cone tip
∆ui Initial excess pore pressure at time t = 0
∆ut Excess pore pressure at any time t
V Measured vertical vibration amplitude
Vmax Maximum vertical vibration amplitude
Vp Compression wave velocity of soil
Vres Amplitude of vertical vibration at resonant
Vs Shear wave velocity of soil
Vt Shear wave velocity in the lowest layer of soil at the pile toe
WLL Soil liquid limit
WPL Soil plastic limit
x Depth below ground surface
y Pile shaft deflection
Zc Height of centre of gravity of the oscillator, body mass, and pile
Cap measured from the bottom surface of the pile cap plate Ze Height of excitation above centre of gravity
a, b, c, d, f, g, and h Curve-fitting constants
j and n Integration constants
2D Two dimensional
3D Three dimensional
Λ Factor = 0.8
α Adhesion factor
αLCPC Friction coefficient
β Combined shaft resistance factor
xxxii
γ' Soil effective unit weight
γs Shear strain
δ Soil-pile interfacial friction angle
εi Bending strain at level i
εic and εit Strain values on the opposite sides of the pile shaft at level i
εv Volumetric strain
ζcd Depth factor
ζcr Rigidity factor
ζcs Shape factor
ζqd Depth factor
ζqr and ζγr Rigidity factors
ζqs Shape factor
θ Pile head rotation
ν Poisson’s ratio
νd Drained Poisson’s ratio
νm Poisson’s ratio of soil weak boundary zone
νs Soil Poisson’s ratio
ρ Mass density of soil
σatm Atmospheric pressure (100 kPa)
σ'ho Soil effective lateral stress
σ'p preconsolidation pressure of soil
σ'vo Effective overburden pressure
φ' Effective angle of internal friction
ψ Angle of plastification
CHAPTERONE
INTRODUCTION
1.1 GENERAL
Helical anchors and piles are used as a foundation system for many inland and offshore engineering applications including: transmission towers, pipelines, and supporting retaining structures (Adams and Klym, 1972; Carville and Walton, 1995; Zhang, 1999; El Naggar and Abdelghany, 2007a,b). Helical piles are cost effective, easy to install, can provide superior performance in certain soil profiles compared to the conventional piling systems. Helical piles are mostly designed to sustain static loading, especially for uplift conditions. Recently, there has been an increasing trend to use helical piles and especially large-capacity ones, to support foundations subjected to dynamic loads such as machine foundations and foundations in seismic zones (Sakr, 2009a; Elkasabgy et al., 2010). Up to date, a few researches have been conducted to better understand the compressive behaviour of large-capacity helical piles (e.g. Zhang, 1999), but no studies of their dynamic behaviour.
1.2 OBJECTIVES OF THE THESIS
The objective of the current study is to investigate the performance characteristics of large-capacity helical piles in comparison with driven steel piles under axial compression and lateral static loads and dynamic (harmonic) loads in cohesive soils. Special emphasis is placed on exploring the effect of pile geometrical configurations on its static and dynamic performance. The specific objectives of this study are:
1. To establish reliable and practical test setup and test procedure for the dynamic loading of helical piles.
2. To investigate the dynamic performance of large-capacity helical piles and driven steel piles subjected to dynamic vertical and horizontal vibrations and free vibrations. 3. To evaluate the dynamic parameters (stiffness and damping) of helical and driven
piles, understand the load-transfer mechanism under dynamic loads, and provide design recommendations.
4. To evaluate the applicability of the available linear theoretical approaches for evaluating the dynamic performance of helical piles and driven piles.
5. To investigate the performance of large-capacity helical piles under axial compressive and lateral static loads in typical Alberta, Canada cohesive soils and to establish their load-transfer mechanism.
1.3 TESTING PROGRAM
1.4 ORGANIZATION OF THE THESIS
The thesis is organized into 8 chapters that address the different thesis objectives. Chapter 1 introduces the research topic and describes the thesis structure. Chapter 2 provides a literature review on helical piles including historical development, typical configurations, installation procedure, and available design methodologies. In addition, Chapter 2 summaries relevant theoretical investigations on conventional piles subjected to harmonic vibrations.
Chapter 3 presents the static full-scale test program, test site layout, test piles’ geometrical and material characteristics, pile instrumentation and measurement devices, and pile installation technique, as well as the test setup and procedure.
Chapter 4 outlines the site characterisation program. It presents the components of the extensive site investigation that includes field seismic cone penetration tests (SCPT), standard penetration tests (SPT), boreholes, laboratory testing to obtain the index, strength, and stiffness properties of the site soil at low and large strain levels.
Chapter 5 discusses the design of the test setup and the adopted procedure of the dynamic loading. In addition, it provides the measured responses of the test piles subjected to harmonic vertical and horizontal vibrations as well as free vibration tests. The measured responses of the helical and driven piles are analyzed to establish their dynamic parameters using the linear and nonlinear theoretical approaches, taking into account the effect of pile installation process. Also, an empirical relationship between the pile-soil separation length and maximum vibration amplitude is proposed.
Chapter 6 provides the results of the axial compression static load tests conducted on both helical and driven test piles. The ultimate axial load capacities are interpreted from the load-settlement curves and an ultimate load criterion is proposed for large-capacity helical piles. The ultimate axial load large-capacity components (skin friction and end bearing) are determined. The effect of pile installation and pile-soil setup is investigated along a nine month period and the mobilized shear strength parameters by the different sections of helical piles are back-calculated.
develop p-y curves for piles tested two weeks after installation and nine months after installation. Two models are developed using the LPILE program (ENSOFT INC., 2005) in order to simulate the lateral test results and investigate the effect of soil remoulding due to pile installation on its lateral performance.
CHAPTERTWO
BACKGROUND INFORMATION AND LITERATURE REVIEW
2.1 DIFINITION
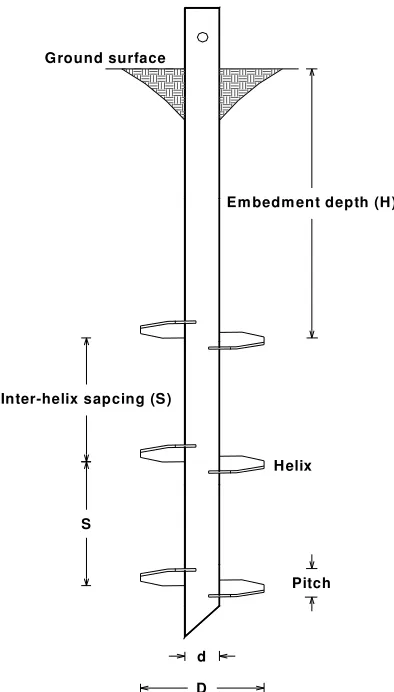
A helical (screw) pile consists of one or more helical shaped circular plate(s) affixed to a steel central shaft (Figure 2.1). Based on geometrical and design considerations, two helical pile categories can be identified, namely: small-diameter helical piles and large-diameter helical piles. A large-large-diameter helical pile is formed of a large large-diameter steel pipe with a hollow circular cross-section.
2.2 HISTORICAL BACKGROUND
The first use of helical anchors can be probably traced back to the foundations of the Maplin Sands light house in the Thames estuary in 1838 (Little, 1961). However, it was not until the nineteen forties when the helical piles emerged as a feasible piling option. During this period, helical piles were used as foundations for wharfs and jetties (Wilson, 1950). In the 1960’s, helical piles have been used successfully for mast and tower foundations in the U.S.S.R., Canada, and other countries (Trofimnekov and Mariupolskii, 1965). Robinson and Taylor (1969) reported the use of helical piles in the construction of the guyed towers of two transmission lines extending a length more than 869 km in British Columbia. Helical piles were also used in the construction of the conventional four legged and guyed type towers for transmission lines in Ontario (Adams and Klym, 1972). Taylor et al. (1979) and Valent et al. (1979) discussed the use of helical anchors as anchorage for pipelines in marine environments. Carville and Walton (1995) reported the use of helical piles in the underpinning and restoration of old and damaged foundations and as tieback or soil nails to retain structures and slope sides.
mainly on the uplift capacity of helical piles as a result of their numerous applications that require resistance of tensile forces. Moreover, most research programs and design schemes were developed for small shaft diameter helical piles.
2.3 GEOMETRY AND INSTALLATION
Helical piles can be manufactured in different geometrical configurations. There is a wide variety of shaft diameters that may range between 89 and 200 mm for axially loaded piles and up to 273 mm for laterally loaded piles (Hoyt and Clemence, 1989). With the continuing advancement in pilling industry, the diameters of helical pile shafts continue to grow. The number of helices may vary from one to four helices upon the load capacity required (Bradka, 1997). The pitch and the spacing between helices can be varied so that the upper helix follows the lower one during pile installation. The pitch may be defined as the distance from the top of an anchor helix to the bottom of the same helix along the shaft. The helical pile may be manufactured in single pitch or in multi-helix with equal and variable pitches (Ghaly and Hanna, 1991).
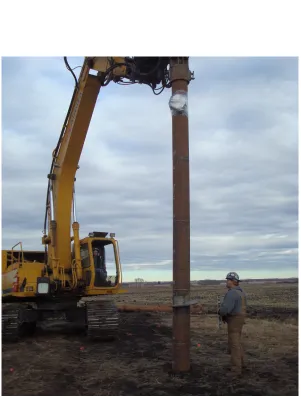
Figure 2.2 depicts a typical setup for helical pile installation. The pile is installed into soil by applying a clockwise turning moment (torque) to the pile shaft, by using a hydraulic torque head, while sustaining a constant rate of penetration of the pile helices at one pitch per revolution (Bobbitt and Clemence, 1987). An axial compressive force may be applied to the shaft to prevent the pile rotation in place without penetrating the soil and to maintain the specified penetration rate which minimizes any soil disturbance during installation.
Helical piles have several advantages. They are easily installed using minimal equipment, and can be removed and reused. Furthermore, they allow immediate loading upon installation. In addition, in the case of high ground water level, helical piles save dewatering and/or pumping of the construction site (Bobbitt and Clemence, 1987). Helical screw piles are light in weight and don’t require very heavy drilling rigs, thus they are more convenient to be installed in weak soil conditions.
Inter-helix sapcing (S)
D d S
Pitch H elix Ground surface
Em bedm ent depth (H)
Figure 2.2. Helical pile installation
2.4 DESIGN OF SINGLE PILES UNDER COMPRESSION LOADS
Generally, the ultimate compression load capacity, Qult, of a single pile consists of two components. One is due to the end bearing generated at the pile toe, Qb, and the other is due to the skin friction resistance mobilized along the pile shaft, Qs, i.e.
Qult =Qb +Qs =qbAt +qsAs (2.1)
qs = unit skin friction capacity
At = area of the pile toe
As = area of the pile shaft
The following sections will provide the indirect methods to calculate ultimate end bearing and skin resistance as well as the direct methods using the in-situ soil test results.
2.4.1 End Bearing Capacity
The bearing capacity of pile foundations are estimated using the same bearing capacity theories established for shallow foundations (Terzaghi, 1943; Skempton, 1951; Meyerhof, 1963; Vesic, 1975). Terzaghi (1943) used the theory of plasticity to compute the bearing capacity for a strip footing presuming that the foundation base is rough, the footing is laid at depth, H, which is less than or equal to the minimum footing width, B, and the shear strength of the underlying soil is governed by the Mohr-Coulomb failure criterion. In addition, Terzaghi neglected the shear strength of the soil above the base of the footing. Terzaghi proposed the following equation for the bearing capacity:
qb =CNc +γ′HNq +0.5γ′BNγ (2.2)
where: C = soil cohesion
γ' = soil unit weight
Nc, Nq and Nγ = bearing capacity factors
For deep foundations, Terzaghi considered the side shear resistance along the surface of the pile plus the end bearing of the pile toe. The following expression represents the bearing capacity of a circular base deep foundation, where B is pile diameter:
Hansen (1970) proposed the general bearing capacity case, which represents an extension of the earlier Meyerhof (1951) work. Hansen equation includes correction factors to account for the shape of the footing, depth effect, load inclination, load eccentricity, and foundation slope:
qb =CNcScdcic +γ′HNqSqdqiq +0.5γ′BNγSγdγiγ (2.4)
where: Sc, Sq, Sγ = shape factors
dc, dq, dγ = depth factors
ic, iq, iγ = load inclination factors
Vesic (1973) proposed a similar procedure with some differences in calculating, Nγ, and introduced load inclination factors, i, ground inclination factors, g, and foundation base inclination factors, b. Meyerhof (1976) extended Terzaghi’s theory for bearing capacity by considering an extended failure surface above the foundation level. The bearing capacity factors, Nc and Nq, proposed by Meyerhof are close to those derived by Terzaghi for shallow foundations, but the difference is significant at larger embedment ratios, H/d, defined as the depth to pile bearing level to pile diameter, d. The ultimate end bearing of piles in homogeneous cohesionless or cohesive soils is calculated as follows, where drained condition is assumed for cohesionless soils and undrained condition is assumed for cohesive soils:
Cohesionless soils qb =γ′HNq (2.5)
Cohesive soils qb =CuNc (2.6)
where: Cu = undrained shear strength of cohesive soil
approximately one-half of the critical embedment ratio Hc/d. The critical depth, Hc, is the depth below which the unit end bearing capacity and the unit skin friction resistance practically remain constant in a homogenous soil due to soil compressibility, crushing, arching, etc. If pile is installed to a depth larger than the critical depth in cohesionless soils, the unit end bearing is, then, independent of the overburden pressure and it depends to a limiting value, ql. The value of ql corresponds to a limiting effective vertical stress at the pile toe at failure from about 25 kPa in loose sand to 50 kPa in dense sand:
ql =0.5Nqtanφ′ (2.7)
where: ql = limit unit end bearing resistance in tons per square foot (100 kPa)
Nq = bearing capacity factor for H < Hc
φ' = effective angle of internal friction
In saturated homogeneous clay under undrained conditions, Meyerhof (1976) stated that Nc below the critical depth varies from 5 for very sensitive brittle normally consolidated clay to 10 for insensitive stiff overconsolidated clay. However, a value of 9 is frequently used for bearing capacity calculations for driven and bored piles in clay. On the other hand, the Canadian Foundation Engineering Manual, CFEM (2006), recommends Ncof 9 for pile toe diameter d < 0.5, Nc = 7 for d between 0.5 and 1.0 m, and
Nc = 6 for d > 1.0 m.
Vesic (1975) proposed a method for estimating the unit end bearing capacity based on the spherical cavity expansion theory. According to this theory, the unit end bearing capacity of the pile can be computed using bearing capacity factors which are estimated based on the angle of internal friction and the reduced rigidity index, Irr:
R v R rr
I I I
ε
+ =
1 (2.8)
φ γ′ ′ +
=
tan H C
G
IR (2.9)
εv = volumetric strain
When undrained condition exists, Irr can be taken equal to IR. Bowles (1996) provided some practical ranges for IR. In addition, Baldi et al. (1981) suggested a formulation to estimate IR from the friction ratio, Rf, of the cone penetration test results:
f R
R
I =170 (2.10)
Janbu (1976) proposed an equation for calculating bearing capacity factor Nq as a function of φ' and an angle ψ, termed as angle of plastification. The angle ψ varies from 60ofor soft clays to 105o for dense sandy soils.
Kulhawy (1984) extended Vesic (1975) bearing capacity solution based on cavity expansion method. Kulhawy presented bearing capacity factors, shape factors, and depth factors that depend on the effective angle of internal friction and the rigidity index of the foundation soil. For undrained loading condition in cohesive soils (φ' = 0.0) the following formulation was proposed to estimate unit end bearing:
qb =CuNcζcrζcsζcd (2.11)
where, Ncis equal to 5.14; ζcr is the rigidity factor; ζcs is the shape factor; and ζcd is the depth factor. Kulhawy mentioned that for rigidity index of 8 or more the value of Nc ζcr ζcs ζcd is constant. In addition, the correction factor (Nc ζcr ζcs ζcd) changes insignificantly for embedment ratio (H/d) ≥ 5. Thus, it was recommended by Kulhawy that assuming the correction factor equals to 9 is a reasonable assumption for deep foundations.
qb =γ′HNqζqrζqsζqd +0.3γ′dζγr (2.12)
where, ζqr and ζγr are the rigidity factors; ζqs is the shape factor; and ζqd is the depth factor. Kulhawy mentioned that the second term in the equation is significantly small compared to the first term as the embedment ratio (H/d) increases. It was concluded that for piles with H/d > 4 to 5, the second term in equation was found to be less than 10% of the first term. Thus, the second term could be safely neglected.
2.4.2 Skin Friction Capacity
The displacement required to mobilize the maximum skin friction is quite small and is relatively independent of the foundation or soil type (Kulhawy, 1984). The required displacement is of the order of only 0.3 to 1.0% of the pile diameter (Tomlinson, 1994) or in the range of 5 to 10 mm (Kulhawy, 1984). Resistance to applied loads from skin friction along the shaft increases with depth to a maximum, then remains almost constant toward the toe. Side friction is hard to accurately estimate, especially for foundations constructed in augered or partially jetted holes or foundations in stiff, fissured clays (U.S. Army Corps of Engineers, 1992). This is ascribed to pile installation effect on reducing shear strength of soil to the remoulded strength especially in sensitive clays. The skin
friction capacity can be computed using the α method (total stress method) for cohesive
soils or the β method (effective stress method) for either cohesionless or cohesive soils.
2.4.2.1 The αααα method
The general method for computing the skin resistance along pile’s shaft was proposed by Tomlinson (1971), which can be simplified in the form of adhesion resistance along pile shaft, i.e.
qs =αCu (2.13)
reasonable adhesion factor for cohesive soils, especially for stiff, fissured clays, local experience with existing soils and load test results should be used to estimate appropriate
α value. There are many methods proposed in the literature to estimate the adhesion
factor in cohesive soils. Some of these methods are described below:
Driven piles:
1. Based on the analysis of load test data of driven piles installed in soft to very stiff clay, Tomlinson (1957) recommended that the adhesion be expressed as a percentage of the undisturbed cohesion of the clay falls from about 100 in case of very soft clays to 20 in very stiff clays. Tomlinson ascribed the loss in adhesion in stiff to very stiff clays to the loss of the shear strength by remoulding and the presence of a partial gap between the driven pile and the soil. Figure 2.3 presents the relationship proposed by Tomlinson (1957) to estimate adhesion. Tomlinson (1994) proposed design curves and tabulated guidelines for the adhesion factors for displacement piles carrying light to moderate loading driven into stiff clays. Most of the data used to develop the curves and guidelines were derived from loading tests on piles of solid section or closed-end tubular piles. The method is not applicable to tubular piles driven with a projecting base plate or an external stiffening ring.
2. Weltman and Healy (1978) provided design curves to estimate the adhesion factor based on load tests conducted on driven and cast-in-place piles installed in glacial till. In addition, a curve for the case of bored piles was proposed (Fig. 2.4).
3. Randolph and Wroth (1982) showed that the undrained cohesion to effective overburden pressure ratio, Cu/σ'vo, could be correlated with the adhesion factor, and Semple and Rigden (1984) proposed a correlation based on pile load tests on open-end piles either plugged with soil or concrete. A length factor, F, was proposed in order to
reduce the values of α in order to account for the effect of pile flexibility and slenderness ratio:
4. API (1984) reported ranges for α for different ranges of Cu:
α = 1.0 (Cu≤ 25 kPa) (2.15a)
α = 0.5 (Cu≥ 70 kPa) (2.15b)
α = 1.0 – [(Cu-25)/70] (25 ≤Cu≤ 70 kPa) (2.15c)
5. Canadian Foundation Engineering Manual, CFEM (2006) proposed a design chart for estimating the adhesion factor α. The proposed curve is quite similar to that proposed by Tomlinson (1957) for driven concrete piles. Figure 2.5 depicts the CFEM proposed chart, in which for Cu< 100 kPa, α varies between 0.5 and 1.0.
Drilled shafts:
1. Stewart and Kulhawy (1981) suggested α be estimated based on the soil plasticity index, 15 < IP < 80, and stress history represented in the form of overconsolidation ratio, OCR, i.e.
Overconsolidated: α = 0.7 – 0.01 IP (2.16a)
Slightly overconsolidated (OCR ≤ 2): α = 0.9 – 0.01IP (2.16b)
Normally consolidated: α = 0.9 – 0.004IP (2.16c)
2. O’Neill and Reese (1999) provided a procedure and guidelines to obtain the adhesion factor for both straight-sided shaft piles and for belled piles. For the upper 1.5 m (5 ft) of
the shaft, the researchers neglected the skin resistance (α = 0.0). Also, in the case of compression loading, the adhesion was neglected along a distance of one shaft diameter from the pile toe in case of straight-sided shafts and one shaft diameter from the top of the bell in the belled shafts. For the other zone of the shaft the adhesion factor is:
α = 0.55 for Cu≤ 150 kPa (2.17a)