187 |
P a g e
www.ijarse.com
OPTIMIZATION OF PROCESS PARAMETERS OF
METAL INERT GAS WELDING BY TAGUCHI
METHOD ON CRC STEEL IS 513 GR D
Sudesh Verma
1,Rajdeep Singh
21
Research Scholar,
2Associate Professor
Mechanical Departments, JCDCOE, Sirsa, Haryana (India)
ABSTRACT
GMAW (Gas Metal Arc Welding) was developed during the early 1940’s and technology was taken from the TIG
welding process that was already around at the time. MIG (Metal Inert Gas) welding, also known as MAG (Metal
Active Gas) and in the USA as GMAW is a welding process that is now widely used for welding a variety of
materials, ferrous and non ferrous. Gas metal arc welding is one of the conventional and traditional methods to join
materials. In this work we presents Optimization of process parameters of metal inert gas welding by Taguchi
method on Bead width and Bead height on CRC steel IS 513 GR ‘D’ material. A plan of experiments based on
Taguchi technique has been used. An Orthogonal array (L9), signal to noise (S/N) ratio and analysis of variance
(ANOVA) are employed to study and optimize the welding parameters. The result computed is in form of
contribution from each parameter, through which optimal parameters are identified for Bead width and Bead
height.
Keywords: ANOVA (Analysis of Variance), GMAW, Optimization, S/N Ratio, Taguchi Method
1 INTRODUCTION
Gas metal arc welding is one of the conventional and traditional methods to join materials. A wide range of
materials may be joined by Gas metal arc welding—similar metals, dissimilar metals, alloys, and nonmetals. In the
present scenario demand of the joining of similar materials continuously increases due to their advantages, which
can produce high yield strength, deeper penetration, continuous welding at higher speed and small welding defects.
The essential feature of the process is in which a continuous and consumable wire electrode and a shielding gas are
feed through a welding gun. A constant voltage, direct current power source is most commonly used with GMAW,
but constant current systems, as well as alternating current, can be used [1].
There are four primary methods of metal transfer in GMAW, Each of which has distinct properties and
corresponding advantages and limitations.
188 |
P a g e
www.ijarse.com
GMAW is the most common industrial welding process, preferred for its versatility, speed and the relative ease of
adapting the process to robotic automation. The automobile industry in particular uses GMAW welding almost
exclusively. Unlike welding processes that do not employ a shielding gas, such as shielded metal arc welding, it is
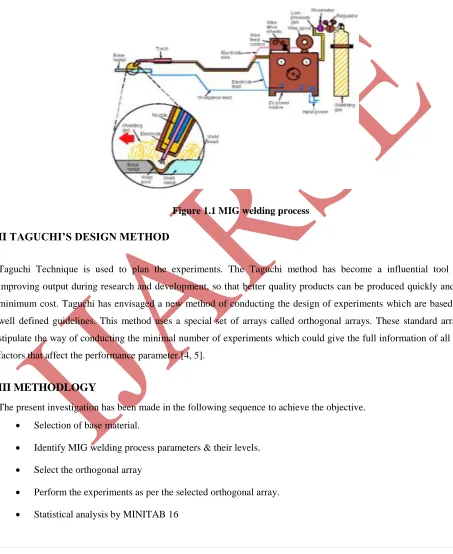
rarely used outdoors[2,3].Principle working of MIG welding process as shown in figure1.1.
Figure 1.1 MIG welding process
II TAGUCHI’S DESIGN METHOD
Taguchi Technique is used to plan the experiments. The Taguchi method has become a influential tool for
improving output during research and development, so that better quality products can be produced quickly and at
minimum cost. Taguchi has envisaged a new method of conducting the design of experiments which are based on
well defined guidelines. This method uses a special set of arrays called orthogonal arrays. These standard arrays
stipulate the way of conducting the minimal number of experiments which could give the full information of all the
factors that affect the performance parameter.[4, 5].
III METHODLOGY
The present investigation has been made in the following sequence to achieve the objective.
Selection of base material.
Identify MIG welding process parameters & their levels.
Select the orthogonal array
Perform the experiments as per the selected orthogonal array.
189 |
P a g e
www.ijarse.com
After performing GMAW operation, the specimens were cut from the welded plate to carry out various tests. The
following are the tests carried out to achieve the objective:
Bead height Test
Bead width Test
IV EXPERIMENTATION
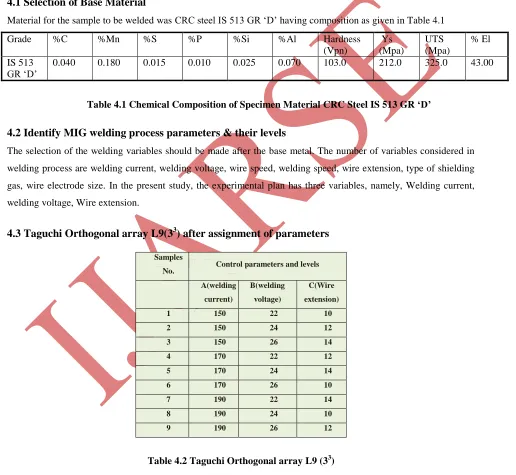
4.1 Selection of Base Material
Material for the sample to be welded was CRC steel IS 513 GR „D‟ having composition as given in Table 4.1
Grade %C %Mn %S %P %Si %Al Hardness
(Vpn)
Ys (Mpa)
UTS (Mpa)
% El
IS 513 GR „D‟
0.040 0.180 0.015 0.010 0.025 0.070 103.0 212.0 325.0 43.00
Table 4.1 Chemical Composition of Specimen Material CRC Steel IS 513 GR ‘D’
4.2 Identify MIG welding process parameters & their levels
The selection of the welding variables should be made after the base metal. The number of variables considered in
welding process are welding current, welding voltage, wire speed, welding speed, wire extension, type of shielding
gas, wire electrode size. In the present study, the experimental plan has three variables, namely, Welding current,
welding voltage, Wire extension.
4.3 Taguchi Orthogonal array L9(3
3) after assignment of parameters
Samples
No. Control parameters and levels A(welding
current)
B(welding voltage)
C(Wire extension)
1 150 22 10
2 150 24 12
3 150 26 14
4 170 22 12
5 170 24 14
6 170 26 10
7 190 22 14
8 190 24 10
9 190 26 12
190 |
P a g e
www.ijarse.com
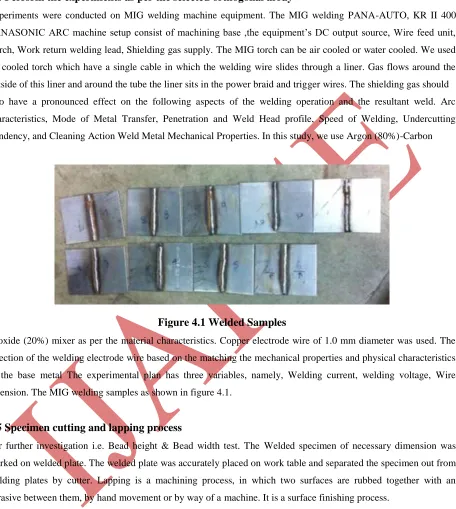
4.4 Perform the experiments as per the selected orthogonal array
Experiments were conducted on MIG welding machine equipment. The MIG welding PANA-AUTO, KR II 400
PANASONIC ARC machine setup consist of machining base ,the equipment‟s DC output source, Wire feed unit,
Torch, Work return welding lead, Shielding gas supply. The MIG torch can be air cooled or water cooled. We used
air cooled torch which have a single cable in which the welding wire slides through a liner. Gas flows around the
outside of this liner and around the tube the liner sits in the power braid and trigger wires. The shielding gas should
also have a pronounced effect on the following aspects of the welding operation and the resultant weld. Arc
characteristics, Mode of Metal Transfer, Penetration and Weld Head profile, Speed of Welding, Undercutting
Tendency, and Cleaning Action Weld Metal Mechanical Properties. In this study, we use Argon (80%)-Carbon
Figure 4.1 Welded Samples
Dioxide (20%) mixer as per the material characteristics. Copper electrode wire of 1.0 mm diameter was used. The
selection of the welding electrode wire based on the matching the mechanical properties and physical characteristics
of the base metal The experimental plan has three variables, namely, Welding current, welding voltage, Wire
extension. The MIG welding samples as shown in figure 4.1.
4.5 Specimen cutting and lapping process
For further investigation i.e. Bead height & Bead width test. The Welded specimen of necessary dimension was
marked on welded plate. The welded plate was accurately placed on work table and separated the specimen out from
welding plates by cutter. Lapping is a machining process, in which two surfaces are rubbed together with an
abrasive between them, by hand movement or by way of a machine. It is a surface finishing process.
V RESULT & DISCUSION
The aim of the experimental plan is to find the optimize parameters those are influencing the Bead height and bead
width of weldment. The experiments were developed based on an orthogonal array, with the aim of relating the
191 |
P a g e
www.ijarse.com
5.1 Results of Statistical Analysis of Experiments
The results for various combinations of process parameters were obtained by conducting the experiment as per the
orthogonal array (L9). The measured results were analyzed using the software MINITAB 16 specially used for the
design of experiment applications. To measure the quality characteristics, the experimental values are transformed
into signal to noise ratio. The influence of control parameters such as Welding Current, Welding Voltage & Wire
extension on Bead height and width has been analyzed using Response table for signal to noise ratio.
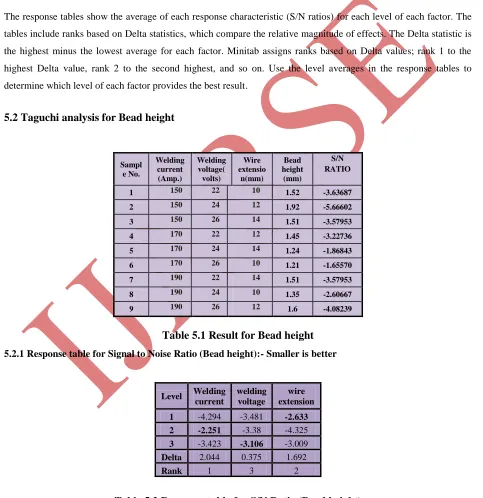
The response tables show the average of each response characteristic (S/N ratios) for each level of each factor. The
tables include ranks based on Delta statistics, which compare the relative magnitude of effects. The Delta statistic is
the highest minus the lowest average for each factor. Minitab assigns ranks based on Delta values; rank 1 to the
highest Delta value, rank 2 to the second highest, and so on. Use the level averages in the response tables to
determine which level of each factor provides the best result.
5.2 Taguchi analysis for Bead height
Table 5.1 Result for Bead height
5.2.1 Response table for Signal to Noise Ratio (Bead height):- Smaller is better
Level Welding current
welding voltage
wire extension
1 -4.294 -3.481 -2.633
2 -2.251 -3.38 -4.325
3 -3.423 -3.106 -3.009
Delta 2.044 0.375 1.692
Rank 1 3 2
Table 5.2 Response table for S/N Ratio (Bead height)
Sample No.
Welding current (Amp.)
Welding voltage(
volts)
Wire extensio
n(mm)
Bead height
(mm)
S/N RATIO
1 150 22 10 1.52 -3.63687
2 150 24 12 1.92 -5.66602
3 150 26 14 1.51 -3.57953
4 170 22 12 1.45 -3.22736
5 170 24 14 1.24 -1.86843
6 170 26 10 1.21 -1.65570
7 190 22 14 1.51 -3.57953
8 190 24 10 1.35 -2.60667
192 |
P a g e
www.ijarse.com
Table 5.2 shows the experimental analysis for Bead height. In our experimental analysis, the ranks indicate that
welding current has the greatest influence on the S/N ratio. For S/N ratio, wire extension has the next greatest
influence and welding voltage has least influence. Here, because our aim is to smaller the bead height, we want
factor levels that produce the highest S/N Ratio. Taguchi experiments, we always want to maximize the S/N ratio.
The level averages in the response tables show that the S/N ratio were maximized when the welding current was 170
amps, the Welding voltage was 26 volts and the wire extension was 10 mm. So, the optimal parameters combination
of bead height for CRC steel 513 GR „D‟ was welding current 170 amps, the Welding voltage 26 volts and the wire
extension 10 mm.
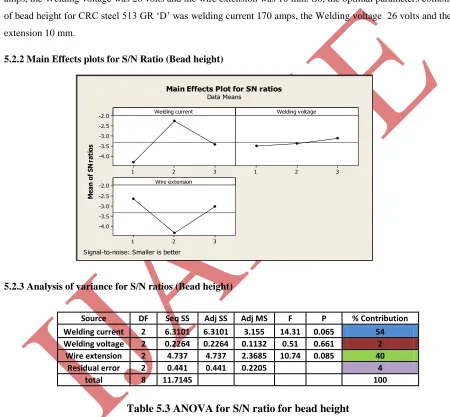
5.2.2 Main Effects plots for S/N Ratio (Bead height)
5.2.3 Analysis of variance for S/N ratios (Bead height)
Source DF Seq SS Adj SS Adj MS F P % Contribution
Welding current 2 6.3101 6.3101 3.155 14.31 0.065 54
Welding voltage 2 0.2264 0.2264 0.1132 0.51 0.661 2
Wire extension 2 4.737 4.737 2.3685 10.74 0.085 40
Residual error 2 0.441 0.441 0.2205 4
total 8 11.7145 100
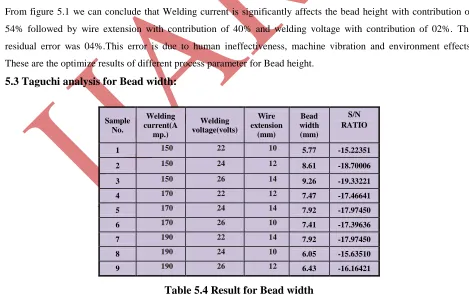
Table 5.3 ANOVA for S/N ratio for bead height
Table 5.3 shows the result of the analysis of variance (ANOVA) for the bead height. The main purpose of analysis
of variance is to investigate the influence of the design parameters on bead height by indicating that which
parameters is significantly affected the quality characteristics.
3 2
1 -2.0 -2.5 -3.0 -3.5 -4.0
3 2
1
3 2
1 -2.0 -2.5 -3.0 -3.5 -4.0
Welding current
M
ea
n
of
S
N
ra
ti
os
Welding voltage
Wire extension
Main Effects Plot for SN ratios
Data Means
193 |
P a g e
www.ijarse.com
5.2.4 Pie Chart for %age Contribution of Different Parameters for bead height
The purpose of ANOVA is to investigate which welding process parameters significantly affect the quality
characteristics. This is accomplished by separating the total variability of the S/N Ratios, which is measured by the
sum of squared deviations from the total mean of the S/N ratio, into contributions by each welding process
parameter and the error. The percentage contribution by each of the welding process parameters in the total sum of
the squared deviations can be used to evaluate the importance of the process parameter change on the quality
characteristic.
Figure 5.1 %age Contribution of each factor for bead height
From figure 5.1 we can conclude that Welding current is significantly affects the bead height with contribution of
54% followed by wire extension with contribution of 40% and welding voltage with contribution of 02%. The
residual error was 04%.This error is due to human ineffectiveness, machine vibration and environment effects.
These are the optimize results of different process parameter for Bead height.
5.3 Taguchi analysis for Bead width:
Table 5.4 Result for Bead width
SampleNo.
Welding current(A mp.)
Welding voltage(volts)
Wire extension
(mm)
Bead width (mm)
S/N RATIO
1 150 22 10 5.77 -15.22351
2 150 24 12 8.61 -18.70006
3 150 26 14 9.26 -19.33221
4 170 22 12 7.47 -17.46641
5 170 24 14 7.92 -17.97450
6 170 26 10 7.41 -17.39636
7 190 22 14 7.92 -17.97450
8 190 24 10 6.05 -15.63510
194 |
P a g e
www.ijarse.com
5.3.1 Response table for Signal to Noise Ratio (Bead width):- Smaller is better
Level Welding current
welding voltage
wire extension
1 -17.75 -16.89 -16.08
2 -17.61 -17.44 -17.44
3 -16.59 -17.63 -18.43
Delta 1.16 0.74 2.34
Rank 2 3 1
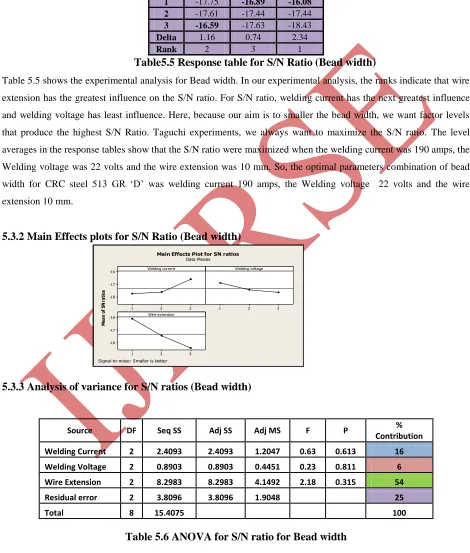
Table5.5 Response table for S/N Ratio (Bead width)
Table 5.5 shows the experimental analysis for Bead width. In our experimental analysis, the ranks indicate that wire
extension has the greatest influence on the S/N ratio. For S/N ratio, welding current has the next greatest influence
and welding voltage has least influence. Here, because our aim is to smaller the bead width, we want factor levels
that produce the highest S/N Ratio. Taguchi experiments, we always want to maximize the S/N ratio. The level
averages in the response tables show that the S/N ratio were maximized when the welding current was 190 amps, the
Welding voltage was 22 volts and the wire extension was 10 mm. So, the optimal parameters combination of bead
width for CRC steel 513 GR „D‟ was welding current 190 amps, the Welding voltage 22 volts and the wire
extension 10 mm.
5.3.2 Main Effects plots for S/N Ratio (Bead width)
5.3.3 Analysis of variance for S/N ratios (Bead width)
Table 5.6 ANOVA for S/N ratio for Bead width
Source DF Seq SS Adj SS Adj MS F P %
Contribution
Welding Current 2 2.4093 2.4093 1.2047 0.63 0.613 16
Welding Voltage 2 0.8903 0.8903 0.4451 0.23 0.811 6
Wire Extension 2 8.2983 8.2983 4.1492 2.18 0.315 54
Residual error 2 3.8096 3.8096 1.9048 25
Total 8 15.4075 100
3 2 1 -16 -17 -18 3 2 1 3 2 1 -16 -17 -18 Welding current M ea n of S N ra tio s Welding voltage Wire extension
Main Effects Plot for SN ratios
Data Means
195 |
P a g e
www.ijarse.com
Table 5.6 shows the result of the analysis of variance (ANOVA) for the bead width. The main purpose of analysis of
variance is to investigate the influence of the design parameters on bead width by indicating that which parameters
is significantly affected the quality characteristics.
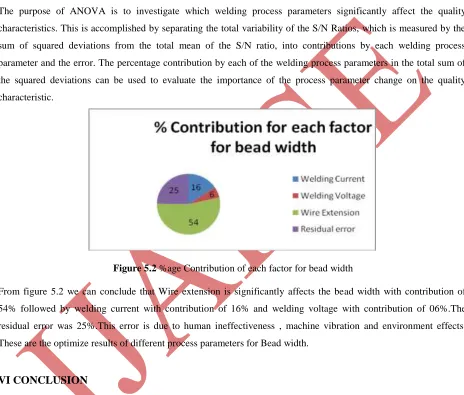
5.3.4 Pie Chart for %age Contribution of Different Parameters for bead width
The purpose of ANOVA is to investigate which welding process parameters significantly affect the quality
characteristics. This is accomplished by separating the total variability of the S/N Ratios, which is measured by the
sum of squared deviations from the total mean of the S/N ratio, into contributions by each welding process
parameter and the error. The percentage contribution by each of the welding process parameters in the total sum of
the squared deviations can be used to evaluate the importance of the process parameter change on the quality
characteristic.
Figure 5.2 %age Contribution of each factor for bead width
From figure 5.2 we can conclude that Wire extension is significantly affects the bead width with contribution of
54% followed by welding current with contribution of 16% and welding voltage with contribution of 06%.The
residual error was 25%.This error is due to human ineffectiveness , machine vibration and environment effects.
These are the optimize results of different process parameters for Bead width.
VI CONCLUSION
The following conclusions can be drawn based on the experimental results of this research work:
1. So, the optimal parameters combination of bead height for CRC steel 513 GR „D‟ was welding current 170 amps,
the Welding voltage 26 volts and the wire extension 10 mm.
Welding current is significantly affects the bead height with contribution of 54% followed by wire extension with
contribution of 40% and welding voltage with contribution of 02%. These are the optimized results of different
196 |
P a g e
www.ijarse.com
2. So, the optimal parameters combination of bead width for CRC steel 513 GR „D‟ was welding current 190 amps,
the Welding voltage 22 volts and the wire extension 10 mm. Wire extension is significantly affects the bead width
with contribution of 54% followed by welding current with contribution of 16% and welding voltage with
contribution of 06%. These are the optimized results of different process parameters for Bead width.
VII FUTURE SCOPE
Gas metal arc welding is one of the conventional and traditional methods to join materials. A wide range of
materials may be joined by Gas metal arc welding—similar metals, dissimilar metals, alloys, and nonmetals. In the
present scenario demand of the joining of similar materials continuously increases due to their advantages, which
can produce high yield strength, deeper penetration, continuous welding at higher speed and small welding defects.
Thus Design of experiments by Taguchi method was successfully used to find the optimum welding parameters for
Bead width and Bead height of CRC steel IS 513 GR „D‟. An Orthogonal array (L9), signal to noise (S/N) ratio and analysis of variance (ANOVA) are employed to study and optimize the welding parameters.
So, for future further work in MIG Welding , we will optimized other process parameters like Welding speed, type
of shielding gas, size of electrode, gas flow rate, electrode angle etc. which are not used in present analysis and the
optimization will be carried out for different materials by same method or by other optimization techniques.
Confirmation tests shall also be conducted to validate the optimum parameter settings.
REFERENCES
[1] S.V. Sapakal1, M.T. Telsang2“parametric optimization of MIG welding using taguchi design method”. Vol. 1/
Issue 4th/ july-sept, 2012/28-30
[2]J.F. Lancaster. The physics of welding. pergamon press, 1984.
[3] N.B. Mostafa, M.N. Khajavi, “Optimization of welding parameters for weld penetration in FCAW”
achievements in material and Manufacturing Engineering Vol. 16 ISSUE 1-2 May-June 2006.
[4] Her-Yueh Huang, “Effect of activating flux on welding characteristics in GMAW”, ELSEVIER, 31 (2010) 2488– 2495, Nov’2009
[5]G. Haragopal, P V R Ravindra Reddy, G Chandra Mohan Reddy, J V Subrahmanyam, " Parametric design for
MIG welding of Al- 65032 alloy using Taguchi Method ", Journal of Scientific and Industrial Research, Vol. 70,
pp.844 - 850, October 2011.
[6]Abbasi.K, Alam.S, Khan.M.I, “An experimental study on effect of increased pressure on MIG welding arc ”,
197 |
P a g e
www.ijarse.com
[7] V.M. Radhakrishnan, welding technology & design (second edition2005), New Age International Publishers,
New Delhi.
[8]Nishant, Ashok Kumar Mishra, Dr. B.K.Roy, “Parameters Optimization For Gas Metal Arc Welding of Mild Steel Using Taguchi’s Technique”International journal of innovative technology and creative
engineering(ISSN:2045-8711) Vol.3 No.3 March 2013.
[9] S. R. Patel, C. A. Waghmare, “Optimization of mig welding parameters for improving strength of welded joints”
Int. J. Adv. Engg. Res. Studies / II/ IV/July-Sept., 2013/14-16.
[10] P. Sreeraj, T. Kannan, Subhashis Maji, “Optimization of GMAW Process Parameters Using Particle Swarm Optimization” Hindawi Publishing Corporation ISRN Metallurgy Volume 2013, Article ID 460651.
[11] Dinesh Mohan Arya,Vedansh Chaturvedi , Jyoti Vimal “Parametric optimization of mig process parameters using taguchi and grey taguchi analysis” IJREAS Volume 3, Issue 6 (June 2013) ISSN: 2249-3905.
[12] S.R. Meshram , N.S. Pohokar” Optimization of Process Parameters of Gas Metal Arc Welding to Improve
Quality of Weld Bead Geometry” IJEBEA 13-213;© 2013, IJEBEA All Rights Reserved.
[13] Ajit Hooda, Ashwani Dhingra and Satpal Sharma,” Optimization of mig welding process parameters to predict
maximum yield strength in aisi 1040” ISSN 2278 – 0149 www.ijmerr.com Vol. 1, No. 3, October 2012 © 2012
IJMERR. All Rights Reserved.
[14] Joseph I. Achebo,” Optimization of GMAW Protocols and Parameters for Improving Weld Strength Quality
Applying the Taguchi Method” Proceedings of the World Congress on Engineering 2011 Vol I WCE 2011, July 6
- 8, 2011, London, U.K.
[15] M. Aghakhani, E. Mehrdad, and E. Hayati,” Parametric Optimization of Gas Metal Arc Welding Process by
Taguchi Method on Weld Dilution” International Journal of Modeling and Optimization, Vol. 1, No. 3, August
2011.
[16] Manoj Singla, Dharminder Singh, Dharmpal Deepak,” Parametric Optimization of Gas Metal Arc Welding Processes by Using Factorial Design Approach”, Journal of Minerals & Materials Characterization &