with and without speech difficulties
Elizabeth Nathan
Department of Human Communication Science
University College London
Thesis submitted for the degree of Doctor of Philosophy
in Human Communication Science
Children with developmental speech disorder of no known aetiology constitute a heterogeneous group, both in their presenting difficulties, which can include additional language and speech perception difficulties, and in the developmental course of the disorder. This thesis examines this heterogeneity from a developmental and psycholinguistic perspective.
Using a longitudinal design, speech processing and language skills are explored over three years in a group of children with speech difficulties (n=47) and an age- and nonverbal IQ-matched longitudinal control group (n=47), mean age 4;06 - 6;07. Other measures were of developmental history, family history, psychosocial status and therapy input.
Key areas of investigation were: the proportion of children whose speech later resolves; uncovering the 'resolving' and 'persisting' profile; the role of input processing in speech development, in particular, the role of accent variability; and the occurrence of dissociable speech processing patterns on matched word/nonword repetition and on speech input tasks. Group characteristics were examined through an analysis of patterns of dissociation on tasks across the group and an examination of patterns of association on speech and language measures (in comparison to the control group) in order to establish the developmental relationships between different aspects of speech processing. Thus concurrent and longitudinal relationships were examined using descriptive statistics, prospective and retrospective subgroup analyses and multiple regression analyses.
A 'persisting' speech profile was identified as a pervasive speech processing and language difficulty and/or more severe speech output problems. A 'resolved' profile was confined to early, moderate, specific speech difficulties. Apart from nonword repetition, there was no evidence that speech outcome was related to different rates of speech or language development.
Using evidence from normal and atypical development, an interactive view of speech development is outlined. Despite the need to understand development as interactive, speech output performance is argued to be the main factor mediating and constraining change between the ages of 4-6 in children with speech difficulties.
Page
Title page
1
Abstract
2Table of contents
3List of tables
13List of figures
19Acknowledgements
21Dedication
23Chapter 1: Speech disorder and heterogeneity
241.1. Overview of speech disorder 24
1.2. Speech disorder: a linguistic perspective 26
1.3. Speech disorder and motor programming deficits 27
1.4. The development of speech perception 28
1.5. Speech disorder and speech input difficulties 32
1.5.1. The relationship between speech output and speech input skills 32
1.5.2. Speech input deficits in children with speech difficulties 33
1.5.3. Measuring speech input skills in children with speech difficulties 36
1.6. Heterogeneity 38
1.6.1. Heterogeneity and subgrouping 38
1.6.2. Heterogeneity related to additional language difficulties 41
1.7. Development of the speech problem 43
79
79
Chapter 2: Speech processing skills
482.1. Relationship between speech processing skills 48
2.2.The influence of stored representations on speech production 50
2.2.1. Single case studies 50
2.2.2. Group studies 54
2.2.3. Interpretation of task comparisons 56
2.3. The influence of stored representations on speech input performance 59
2.4. Speech variability 60
2.5. Dissociations and associations 63
2.6. Continued outline of the thesis 66
Chapter
3:Introduction to the longitudinal study
68and its methodology
3.1. Introduction 68
3.2. Rationale for the study 68
3.2.1. Speech processing perspective 68
3.2.2. Language skill 70
3.2.3. Other measures 70
3.2.4. Longitudinal design 71
3.2.5. Rationale for the age range studied 71
3.2.6. Aims of the study 72
3.3. Participants 74
3.3.1. Children with speech difficulties 74
3.3.2. Control sample 75
3.4. Tests and Materials 76
3.4.1. Nonverbal tests: Wechsler Preschool and Primary Scale of 79
Intelligence - Revised (WPSSI-R; Wechsler, 1990) and Wechsler Intelligence Scale for children - 3' Edition (WISC-III';
Wechsler, 1992) 3.4.2. Receptive language tests
3.4.2.1. Test for the Reception of Grammar - (TROG Bishop, 1983:
3.4.2.2. British Picture Vocabulary Scale - BPVS (Dunn, Dunn, Whetton & Pintilie, 1982) 3.4.3. Expressive language tests
3.4.3.3. Naming (after Snowling, van Wagtendonk and Stafford,
1988)
3.4.4. Speech processing tasks 80
3.4.4.1. Speech output tasks 3.4.4.1.1. Word repetition 3.4.4.i.ii. Nonword repetition 3.4.4.2. Speech input tasks
3.4.4.2.i. Auditory discrimination: picture task (after Locke,
1980)
3.4.4.2.11. Auditory discrimination: ABX task
3 .4.4.2.iii. Auditory discrimination: same/different task (from Bridgeman and Snowling, 1988)
3.4.5. Item analysis 84
3.4.6. Further speech processing tasks 85
3.4.6.1. Further speech output tasks
3.4.6.1. i. Low Frequency word repetition 3.4.6.1. ii. Low Frequency nonword repetition 3.4.6.1. iii. Articulator)' naming
3.4.6.2. A further speech input task
3.4.7. Transformation of speech input scores 87
3.5. Procedure for test battery 87
3.6. Feedback 89
3.7. Questionnaire data 89
3.7.1. Developmental questionnaire 89
3.7.2. Family questionnaire 90
3.7.3. Therapy questionnaire 91
3.7.4. Psychosocial information 92
3.7.5. Questionnaire response rates 92
3.8. Summary 92
Chapter 4: Development of speech processing
94and language skills over time
4.1. Introduction 94
4.2. Results 97
4.2.1. Descriptive statistics 97
4.2.2.1. Speech output tasks 4.2.2.2. Speech input tasks
4.2.2.3. Standardised assessments
4.2.2.3.i. Reliability of standardised assessments 4.2.2.3.ii. Standardised scores
4.2.3. Comparison of mean scores of a selection of speech output 103
and speech input tasks of the control group at T2 with a normative sample collected by Broadbent (2000)
4.2.4. Analysis of Speech output skills 104
4.2.4.1. Distribution of scores
4.2.4.2. Lexicalisations on nonword repetition tasks 4.2.4.3. Articulatory naming
4.2.4.4. Word/nonword tasks T1/T2
4.2.4.5. Word/nonword repetition T2iT3
4.2.4.6. Rate of change across tasks
4.2.5. Speech input skills 111
4.2.5.1. AD: picture task
4.2.5.2. AD: same/different task 4.2.5.3. AD: ABX task
4.2.5.4. Summary of speech input changes over time
4.2.6. Language tasks 114
4.2.6.1. The Bus Story
4.2.6.2. Renfrew Action Picture Test 4.2.6.3. Naming test
4.2.6.4. Test for Reception of Grammar (TROG)
4.2.6.5. British Picture Vocabulary Scale (BPVS)
4.2.7. Nonverbal measures 117
4.3. Discussion 118
4.3.1. Methodological issues 118
4.3.2. Task design 118
4.3.2.1. Speech output
4.3.2.2. Speech input 4.3.2.3. Language
4.3.3. Normal development 120
4.3.3.1. Speech output
4.3.3.2. Speech input skills 4.3.3.3. Language
4.3.4. Group differences over time 124 4.3.4.1. Speech output
4.3.4.2. Speech input
4.3.4.3. Language
4.3.4.4. Nonverbal skills
4.3.5. Summary 127
Chapter 5: Supplementary data collected through
128questionnaires: Birth order, developmental history,
family history, psychosocial status and therapy
5.1.
Introduction 1285.1.1. Research questions
5.2.
Group differences between the Speech disordered and the Control group 1295.2.1. Birth order 129
5.2.2. Developmental history 130
5.2.3. Family history data 131
5.2.4. Psychosocial data 134
5.3.
Therapy data: Speech disordered group 1355.4.
The relationship between speech output and developmental measures, 136psychosocial measures and amount of therapy received
5.5.
Discussion 1405.5.1. Birth order and developmental history 140
5.5.2. Family history of speech/literacy difficulties 141
5.5.3. Psychosocial skills 142
5.5.4. Therapy provision 142
5.5.5. Caveat 143
Chapter 6: Exploring heterogeneity
1446.1.
Introduction 1446.1.1. Research questions
6.2. Results 145
6.2.1. Range of speech severity, language difficulty and speech Input
difficulties 145
6.2.1.1. Speech severity
Page
6.2.1.3. Language deficits
6.2.2. Speech/Language Subgroup analyses 155
6.2.2.1. Speech processing measures 6.2.2.2. Language skills
6.2.2.3. Stability of subgroup membership at T3
6.2.2.4. Relationship between speech/language subgroup and speech outcome
6.3. Discussion 173
6.3.1. Heterogeneity 173
6.3.2. Speech/language analysis 174
6.3.3. Profiles of performance of the Speech/language subgroup 175
Chapter 7: Identification of speech outcome through
179retrospective subgroup analysis
7.1. Introduction 179
7.1.1. Research questions
7.2. Results 181
7.2.1. Speech, language and nonverbal markers of children with resolved 181 or persisting speech skills
7.2.i.i. Speech processing skills
7.2.1.2. Language skills
7.2.1.3. Nonverbal skills
7.2.2. Classification of Speech Outcome groups 189
7.2.3. Summary of speech processing, language and nonverbal 189
markers of speech outcome
7.2.4. Developmental, family and therapy markers of speech outcome 190
7.2.5. Psychosocial information 196
7.2.6. Rate of change as a developmental marker of speech outcome 197
7.2.7. Word/nonword discrepancy: changes over time 201
7.2.8. Establishing a severity threshold on speech output tasks 202
7.2.9. Pervasive difficulty as a clinical marker of speech outcome 204
7.2.10. Specific speech difficulties: resolved vs. persisting 207
7.2.11. Specific vs. pervasive difficulties: word/nonword performance 207
over time
7.2.12. Word length effects on LF wordlnonword repetition 211
7.2.13. Examination of subgroups through Cluster analysis 213
7.3.1. Defining resolved and persisting speech problems 217
7.3.2. Deficits of the persisting speech subgroup 218
7.3.2.1. Speech output, speech input and language measures
7.3.2.2. Developmental questionnaire data
7.3.2.3. Therapy questionnaire data 7.3.2.4. Psychosocial questionnaire data
7.3.3. Rate of speech and language development 223
7.3.4. Severity of speech difficulty 224
7.3.5. Pervasiveness or severity hypothesis? 225
7.3.6. Motor programming deficit 229
7.3.7. Subgroup analysis 232
7.3.8. Cluster analyses 233
7.3.9. Summary 235
Chapter 8: Psycholinguistic analysis of speech output
237and speech input tasks
8.1.
Introduction 2378.1.i. Dissociations on speech input tasks 239
8.1.2. Dissociations on speech output tasks 240
8.1.3. Patterns of dissociation over time and the relationship of these 241
patterns to outcome
8.1.4. Examining predicted associations between tasks 242
8.1.5. Research questions 244
8.2.
Results 2478.2.1. Patterns of performance on phonological recognition and 247
phonological representations
8.2.2. Performance on word and nonword repetition 248
8.2.3. Stability of category membership according to word/nonword 253
discrepancy
8.2.4. What is the relationship between word/nonword profile and speech
performance? 253
8.2.s. The relative contribution of AD: ABX task and AD: picture task to 257
speech output skills: Concurrent relationship
8.2.6. The relative contribution of AD: ABX task and AD: picture task to 263 speech output skills: Longitudinal relationship
8.3.
Discussion 2728.3.2. Performance on word and nonword repetition 273 8.3.3. The relationship of skills at the level of 'phonological recognition' 275
and 'phonological representation' with speech output skills
8.3.4. The developing system 278
Chapter 9: Speech processing skills: the relationship between
280tasks of speech output, speech input and language ability
9.1.
Introduction 2809.1.1. Research questions
9.2. Results 283
9.2.1. Relationships between the speech output tasks 283
9.2.2. Relationships between the speech input tasks 292
9.2.3. Relationships between speech output and speech input tasks 292
9.2.4. Developmental relationship between speech input and speech output293
9.2.5. Predicting speech output and speech input performance 300
9.2.5.1. Procedure for hierarchical regression
9.2.5.2. Predicting speech output
9.2.5.3. Predicting speech input
9.2.6. Relationships between speech processing and language skill 310
9.2.7. Relative contribution of speech processing skills and language 320
skills to speech output
9.2.8. Relative contribution of speech processing measures to 325
expressive language skills
9.2.9. The role of nonverbal ability and maturation 327
9.3. Discussion 330
9.3.1. Relationship between speech output tasks and relationship between 330 speech input tasks
9.3.2. The relationship between speech input skills and speech output 330
skills in normally developing children and children with speech difficulties
9.3.3. The predictive relationship between speech output skills and 332
speech input skills
9.3.4. Predictive role of language skills, nonverbal ability and age 335
10.1. Introduction 337
10.1.1. Discussion of previous findings on speech input tasks 337
10.1.2. Accent variation 338
10.1.3. Accent auditory lexical decision task 341
10.2. Method 343
10.2.1. Participants 343
10.2.2. Accent auditory lexical decision task 344
10.2.2.1. Design and stimuli.
10.2.2.2. Procedure
10.3. Results 346
10.3.1. Accent auditory lexical decision task 347
10.3.2. Error analysis 347
10.3.3. Performance on other speech input measures 348
10.4. Discussion 351
10.5. Summary 356
Chapter 11: Discussion and conclusions
357Part 1: Association and dissociation: psycholinguistic perspectives 357
11.1.i. Psycholinguistic profiling 357
11.1.2. Profiling by speech output tasks 358
11.1.3. Profiling by speech input tasks 361
11.1.4. Implications of the profiling technique 361
11.1.5. Dissociation of input, output skills and language 364
11.1.6. Exploring dissociation through multivanate analysis 365
11.1.7. Exploring association through multivariate analysis 366
11.1.8. Converging evidence from examination of associations and dissociations 368
Part 2: Course of speech development and causes of speech difficulties 369
11.2.1. The course of normal speech development 369
11.2.1.1. Rate of speech/language development
11.2.1.2. Relationships between speech processing and language skills
11.2.2. The course of atypical speech development 371
11.2.2.1. Interactive system or downstream effect of input deficits? 11.2.2.2. Pervasiveness or severity?
11.2.4. Changes in nonword repetition as a marker of a core, persisting difficulty 379
11.2.5. Delayed onset of speech? 384
Part 3: Wider theoretical contexts: making connections and 385
future directions
11.3.1. Motor programming 385
11.3.2. Phonology 387
11.3.3. A psycholinguistic approach 387
11.3.4. 'A model ofpredictive risk' (Law et al., 2000) 388
11.3.5. Methodological limitations to the study 389
11.3.6. Future directions 393
11.3.7. Summary and conclusions 394
References
396Appendices
4141. Note on scoring speech output tasks
2. Word and nonword repetition (original version): List of stimuli
3. Low frequency word and nonword repetition (extension): List of stimuli 4. Articulatory naming task: List of stimuli
5. Auditory discrimination: same/different task: List of stimuli 6. Auditory discrimination: ABX task: List of stimuli
7. Auditory discrimination: picture task (original version): List of stimuli 8. Auditory discrimination: picture task (Extension task): List of stimuli 9. Accent auditory lexical decision task: List of stimuli
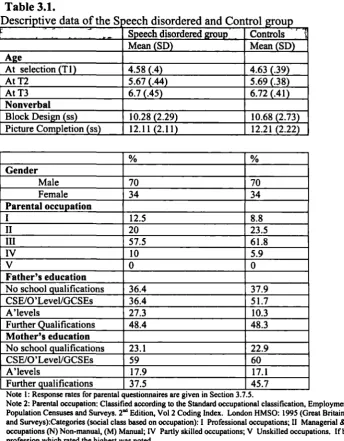
Table 3.1. Table 3.2. Table 3.3. Table 4.1. Table 4.2. Table 4.3. Table 4.4. Table 4.5. Table 4.6. Table 4.7. Table 4.8. Table 4.9. Table 4.10. Table 4.11.
Descriptive data of the Speech disordered and Control group Ranking of the 4 Local Education Authorities (LEAs) from whom the majority of participants were receiving education
Test Batteries at Times 1, 2 and 3
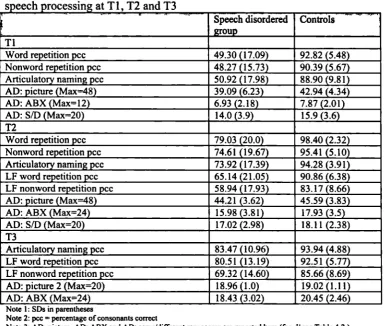
Mean performance and SDs of the Speech disordered group and Controls on tests of speech processing at Ti, T2 and T3
Mean d' performance and SDs of the Speech disordered group and Controls on tests of speech input
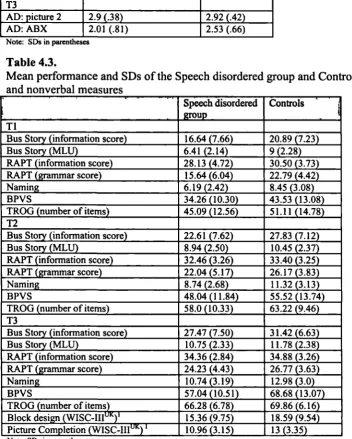
Mean performance and SDs of the Speech disordered group and Controls on language and nonverbal measures
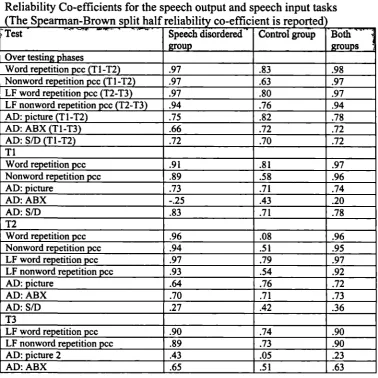
Reliability Co-efficients for the speech output and speech input tasks (The Spearman-Brown split half reliability co-efficient is reported) Reliability Co-efficients of standardised assessments as reported in test manuals (Only relevant ages are shown)
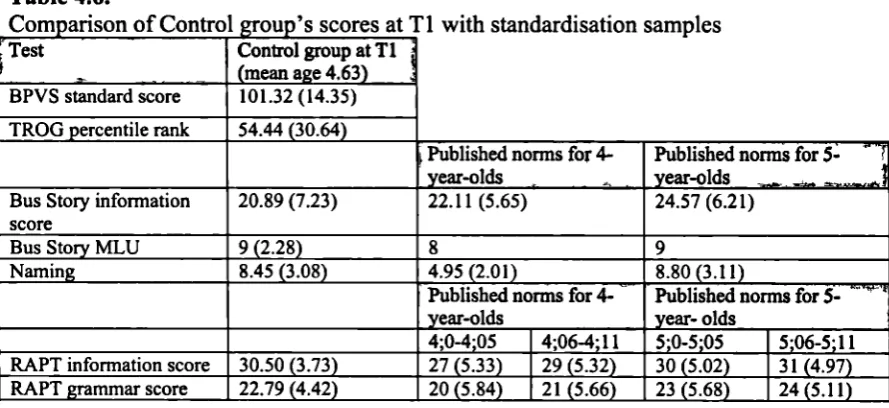
Comparison of Control group's scores at Ti with standardisation samples Comparison of mean scores of a selection of speech output and speech input tasks of the Control group at T2 with a normative sample collected by Broadbent (2000)
Percentage of participants scoring more than 95% correct or scoring 100% correct on measures of speech output at Ti, T2 and T3
Means and SDs of the Speech disordered group and the Control group on lexicalisations in nonword repetition tasks
The Speech disordered group's pattern of change compared to the Control group's rate of change: percentage of children obtaining a similar rate of change, a greater rate of change or a slower rate of change compared to Controls
Percentage of participants scoring at a chance level, more than 95%
correct or scoring 100% correct on measures of speech input at Ti, T2 and T3
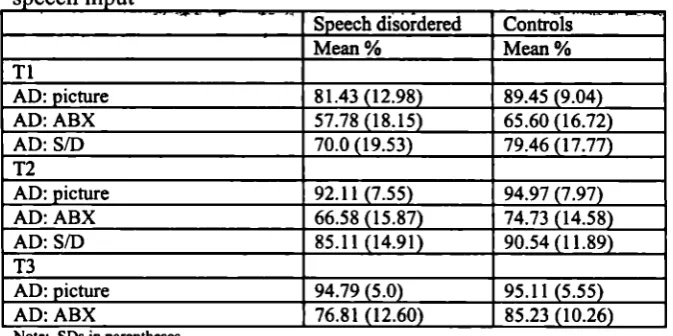
Table 4.12. Mean percentage performance of the Speech disordered group and Controls on tests of speech input
Table 4.13. Means and SDs on nonverbal tasks by group: standard scores
Table 5.1. Number of siblings and birth order data for the Speech disordered and
Control groups
Table 5.2. Developmental information of the Speech disordered and Control group
Table 5.3. Percentage of the Speech disordered and Control groups with a family
Table 5.5. Table 5.6. Table 5.7. Table 5.8. Table 5.9. Table 5.10. Table 6.1. Table 6.2. Table 6.3. Table 6.4. Table 6.5. Table 6.6. Table 6.7. Table 6.8. Table 6.9.
Means and SDs of ratings on Strengths and Difficulties Questionnaire (SDQ) scales by Speech disordered and Control groups
Therapy data: Average session times and percentage of children by type of therapy
Therapy data: Average session times of children attending clinic at Ti Spearman Correlations of amount of therapy and psychosocial measures with speech output tasks (Speech disordered group)
Spearman Correlations of psychosocial measures with speech output tasks (Control group)
Spearman Correlations of developmental measures with speech output tasks (Speech disordered group)
Ranges of speech difficulties of the Speech disordered group at Ti, T2 and T3
Ranges of speech difficulties of the Speech disordered group at Ti, T2 and T3 by speech output task
Range of language and speech input skills of the Speech disordered group at Ti, T2 and T3
Percentage of the Speech disordered group showing deficits on the 3 speech input tasks
Percentage of children showing deficits on the language measures Percentage of children showing deficits on any of the language measures Mean performance of the Clinical Subgroups and Controls on tests of speech processing
Mean performance of the Clinical Subgroups and Controls on language measures
Percentage of children by speech/language subgroup according to speech outcome at 13
Table 7.1. Mean performance of the Speech outcome subgroups and Controls on
measures of speech processing
Table 7.2. Mean performance of the Speech outcome subgroups and Controls on language tasks
Table 7.3. Mean performance of the Speech outcome subgroups and Controls on nonverbal tasks
Table 7.4. Summary table showing the pattern of performance on the test battery according to speech outcome subgroup difference
Table 7.8. Table 7.9. Table 7.10. Table 7.11. Table 7.12. Table 7.13. Table 7.14. Table 7.15. Table 7.16. Table 7.17. Table 7.18. Table 7.19. Table 7.20. Table 7.21. Table 7.22. Table 7.23. Table 7.24. Table 7.25. Table 7.26. Table 8.1.
Therapy questionnaire data by Speech outcome subgroup: Average session times of children reported to be attending a community clinic up till Ti Z-scores on composite output measure of 3 children attending Language Units
Mean performance on Strengths and Difficulties Questionnaire (SDQ) scales by Speech outcome subgroup
Classification on Strengths and Difficulties Questionnaire (SDQ) scales by percentage of children in Speech outcome subgroups
Mean changes and SDs over time on word and nonword repetition and Articulatory naming by Speech outcome subgroup
Changes over time on language and nonverbal tasks by Speech outcome subgroup: T-test results
Changes over time on speech input tasks by Speech outcome subgroup: T-test results
Comparison of rates of change of the Speech outcome subgroups in relation to the Control group on speech output tasks
Means and SDs of word/nonword discrepancies by Speech outcome subgroups
Relationship between pervasiveness and severity at Ti and speech
outcome at T3: Percentage of children with resolved and persisting speech problems according to pervasive/specific difficulties and according to severe/less severe difficulties at Ti
Severity threshold by Speech outcome subgroup
Profiles of speech/language performance at Ti and their relationship to Speech outcome subgroup
Profiles of speechlianguage performance at Ti and their relationship to speech severity at T3
Comparison of children with isolated speech difficulties at Ti that resolved and children with isolated speech difficulties or pervasive difficulties at Ti that persisted
Means and SDs of LF nonword repetition by syllable length: Resolved specific speech subgroup
Means and SDs of LF nonword repetition by syllable length: Persisting specific speech subgroup
Means and SDs of LF nonword repetition by syllable length: Persisting pervasive speech subgroup
Cluster sizes at each testing phase following K-means cluster analysis Proportions of children by Speech outcome subgroups classified according to cluster
Table 8.3. Table 8.4. Table 8.5. Table 8.6. Table 8.7. Table 8.8. Table 8.9. Table 8.10.
Means and SDs of nonword repetition subtracted from word repetition (percentage of consonants correct)
Word/nonword discrepancy subgroups at Ti and T2 (original version) Word/nonword discrepancy subgroups at T2 and T3 (extension task) Means and SDs of word and nonword repetition by word/nonword discrepancy subgroups
Percentage of children in each word/nonword discrepancy subgroup by Speech outcome subgroup
Percentage of children whose speech had resolved at T3 by word/nonword discrepancy subgroup
Hierarchical multiple regression of Ti measures predicting speech output measures at Ti
Hierarchical multiple regression of T2 measures predicting speech output measures at T2
Table 8.11. Hierarchical multiple regression of T3 measures predicting speech output measures at T3
Table 8.12. Hierarchical multiple regression ofT! measures predicting speech output measures at T2
Table 8.13. Hierarchical multiple regression of Ti measures predicting speech output measures at T3
Table 8.14. Hierarchical multiple regression of T2 measures predicting speech output measures at T3
Table 9.1. Table 9.2. Table 9.3. Table 9.4. Table 9.5. Table 9.6. Table 9.7. Table 9.8. Table 9.9. Table 9.10. Table 9.11.
Correlations of the speech output and speech input tasks: Ti (Speech disordered group)
Correlations of the speech output and speech input tasks: T2 (Speech disordered group)
Correlations of the speech output and speech input tasks: T3 (Speech disordered group)
Correlations of the speech output and speech input tasks: Ti (Control group) Correlations of the speech output and speech input tasks: T2 (Control group) Correlations of the speech output and speech input tasks: T3 (Control group) Fisher's z-score showing differences between the correlations of the
Speech disordered group and the Control group: Ti
Fisher's z-score showing differences between the correlations of the Speech disordered group and the Control group: T2
Fisher's z-score showing differences between the correlations of the Speech disordered group and the Control group: T3
Orthogonally rotated factor matrices for the speech processing measures for the Speech disordered group and the Control group
Table 9.13. Table 9.14. Table 9.15. Table 9.16. Table 9.17. Table 9.18. Table 9.19. Table 9.20. Table 9.21. Table 9.22. Table 9.23. Table 9.24. Table 9.25. Table 9.26. Table 9.27. Table 9.28. Table 9.29. Table 9.30. Table 9.31. Table 9.32. Table 9.33.
Correlations of the speech output and speech input tasks: Tl-T3 (Speech disordered group)
Correlations of the speech output and speech input tasks: Ti-T2 (Control group)
Correlations of the speech output and speech input tasks: T2-T3 (Control group)
Correlations of the speech output and speech input tasks: Ti-T3 (Control group)
Hierarchical multiple regression of Ti measures predicting speech output measures at T2
Hierarchical multiple regression of Ti measures predicting speech output measures at T3
Hierarchical multiple regression of T2 measures predicting speech output measures at T3
Hierarchical multiple regression of Ti measures predicting speech input measures at T2
Hierarchical multiple regression of Ti measures predicting speech input measures at T3
Hierarchical multiple regression of T2 measures predicting speech input measures at T3
Correlations of composites of speech output, speech input with expressive and receptive language tasks: Ti (Speech disordered group)
Correlations of composites of speech output, speech input with expressive and receptive language tasks: T2 (Speech disordered group)
Correlations of composites of speech output, speech input with expressive and receptive language tasks: T3 (Speech disordered group)
Longitudinal correlations of composites of speech output, speech input, expressive and receptive language tasks (Speech disordered group)
Correlations of composites of speech output, speech input with expressive and receptive language tasks: Ti (Control group)
Correlations of composites of speech output, speech input with expressive and receptive language tasks: T2 (Control group)
Correlations of composites of speech output, speech input with expressive and receptive language tasks: T3 (Control group)
Longitudinal correlations of composites of speech output, speech input, expressive and receptive language tasks (Control group)
Orthogonally rotated factor matrices for the speech processing and language measures for the Speech disordered group
Orthogonally rotated factor matrices for the speech processing and language measures for the Control group
Hierarchical multiple regression of Ti measures predicting speech output at T2
Table 9.36.
Table 9.37.
Table 9.38.
Table 9.39.
Table 9.40.
Table 9.41.
Table 10.1. Table 10.2.
Table 10.3.
Table 10.4.
Table 10.5.
Table 10.6.
Table 10.7.
Hierarchical multiple regression of Ti measures predicting expressive language at T2
Hierarchical multiple regression of Ti measures predicting expressive language at T3
Hierarchical multiple regression of T2 measures predicting expressive language at T3
Hierarchical multiple regression of TI measures of age and nonverbal ability predicting speech output at T2
Hierarchical multiple regression of Ti measures of age and nonverbal ability predicting speech output at T3
Hierarchical multiple regression of measures of age at T2 and nonverbal ability at Ti predicting speech output at T3
Means and SDs of age, nonverbal ability and word repetition skill by group Means and SDs of the Speech disordered group and the Control group on language measures
Means, SDs and ranges of scores of the two conditions of the accent auditory lexical decision task by group (d' and bias (c) scores)
Means and SDs of types of errors by group on the accent auditory lexical
decision task (d' score)
Means, SDs and ranges of scores of the AD: same-different task and the AD: ABX task (d' score)
Correlations of the two accent tasks with other auditory measures (Speech disordered group)
Figure 4.1. Bar Chart of Articulatory naming over Time and according to group Figure 4.2. Bar Chart of Word and Nonword repetition at TI and T2 by group Figure 4.3. Bar Chart of LF Word/Nonword repetition T2 and T3 by group Figure 4.4. Stackhouse and Wells' speech processing model (1997): speech input
processing Figure 6.1. Figure 6.2. Figure 6.3. Figure 6.4. Figure 6.5. Figure 6.6. Figure 6.7.
Box Plot of composite scores at TI by group Box Plot of composite scores at T2 by group Box Plot of composite scores at T3 by group
Bar Chart of subgroup differences: Word repetition task at Ti Bar Chart of subgroup differences: Nonword repetition task at Ti Bar Chart of subgroup differences: Articulatory naming task at TI
Bar Chart of subgroup differences: Auditory Discrimination Picture task at Ti
Figure 6.8. Bar Chart of subgroup differences: Word repetition task at T2 Figure 6.9. Bar Chart of subgroup differences: Nonword repetition task at T2 Figure 6.10. Bar Chart of subgroup differences: LF Word repetition task at T2 Figure 6.11. Bar Chart of subgroup differences: LF Nonword repetition task at T2 Figure 6.12. Bar Chart of subgroup differences: Articulatory naming task at T2 Figure 6.13. Bar Chart of subgroup differences: Auditory Discrimination ABX task at
T3
Figure 6.14. Bar Chart of subgroup differences: LF Nonword repetition task at T3 Figure 6.15. Bar Chart of subgroup differences: LF Word repetition task at T3 Figure 6.16. Bar Chart of subgroup differences: RAPT (grammar) at Ti Figure 6.17. Bar Chart of subgroup differences: Bus Story (information) at Ti Figure 6.18. Bar Chart of subgroup differences: RAPT (grammar) at T2
Figure 7.1. Figure 7.2. Figure 7.3. Figure 7.4. Figure 7.5. Figure 7.6. Figure 7.7.
Venn Diagram showing patterns of deficits at Ti and their relationship to speech outcome at T3
Bar Chart of mean scores of Word repetition T2 vs. T3 by resolved and persisting speech difficulties
Bar Chart of mean scores of Nonword repetition T2 vs. T3 by resolved and persisting speech difficulties
Cluster Profiles for the two-cluster solution at Ti (Z-scores of control data)
Cluster Profiles for the two-cluster solution at T2 (Z-scores of control data)
Cluster Profiles for the two-cluster solution at T3 (Z-scores of control data)
Figure 8.2.
Figure 8.3.
Figure 8.4.
Figure 8.5.
Figure 8.6.
Figure 8.7.
Figure 8.8.
Figure 9.1
Figure 9.2.
Figure 9.3.
Stackhouse and Wells' speech processing model (1997): Word and nonword repetition routes
Pie Chart showing proportion with stable/changing word/nonword profile between Ti and T3: Resolved speech subgroup
Pie Chart showing proportion with stable/changing word/nonword profile between Ti and T3: Persisting speech subgroup
Summary of unique predictors in multiple regression analyses: Concurrent relationships between input tasks and the three output tasks for the Speech disordered group
Summary of unique predictors in multiple regression analyses: Concurrent relationships between input tasks and the three output tasks for the Control group
Summary of unique predictors in multiple regression analyses:
Longitudinal relationships between input tasks and the three output tasks for the Speech disordered group
Summary of unique predictors in multiple regression analyses:
Longitudinal relationships between input tasks and the three output tasks for the Control group
Summary of unique predictors in multiple regression analyses: Relationships between components of the speech processing system (Speech disordered group)
Summary of unique predictors in multiple regression analyses: Relationships between components of the speech processing system (Control group)
Summary of unique predictors in multiple regression analyses:
Relationships between components of the speech processing system and expressive language (Speech disordered group)
Figure 10.1. Stackhouse and Wells' speech processing model (1997): speech input processing
Professor Bill Wells (University of Sheffield) is thanked for being a great supervisor,
first, when I was an Msc student and now, during my PhD studies. He has had a huge
influence on my thinking, his comments are astute and thought-provoking, and he has
gently guided and developed my work. He is always generous with his time and with his
ideas, and I appreciate this greatly.
Professor Joy Stackhouse (University of Sheffield) is thanked for her nurturing role,
gentle guidance, enthusiasm, friendship, support and for her inspiring ideas. Joy has had a
formative influence on my life and career, from when I first was taught by her as an Msc
student in 1992 and particularly as her research fellow from 1995-1999 and this influence
continues. She has enabled me to achieve things I would never have believed possible.
Thanks go to Dr. Chris Donlan (University College London) for taking on a supervisory
role at a late stage in the completion of this thesis, for his insightful comments on some
draft chapters and for his enthusiasm and support that saw me through the final stages of
the write-up.
During my time as a research fellow, Professor Maggie Snowling's (University of York)
input has been invaluable: directed, insightful and inspiring.
Many colleagues at the Department of Human Communication Science are thanked for
their help: Dr. Nata Goulandris, for support and encouragement over many years. I
thank Dr. Maggie Vance and Rachel Rees and the Developmental Research Team from
whom I have learnt a lot. Their support during my write-up is greatly appreciated. Dr.
Jane Maxim has supported my thesis write-up in very practical ways for which I am
very grateful. Sarah Alleemudder has also been unfailingly helpful in practical matters.
Marcin Szczerbinski, a fellow PhD student (now of the University of Sheffield), has
been a great friend during our PhD careers at UCL. Our conversations during periods of
also thanked.
Thanks to Dr. John Adams (Department of Psychology, University of Durham) for help
in the scoring of the Strengths and Difficulties Questionnaire (Goodman, 1997).
North Thames Regional Health Authority is acknowledged for ftinding the collection
of data analysed in this thesis through a Research and Development Grant (1995-1999)
on which I was research fellow.
Thanks to all the speech and language therapists from Camden and Islington
Community Health Care Services NHS Trust, Barnet Health Care NHS Trust,
Enfield Community Care NHS Trust, The Nuffield Hearing and Speech Centre who
supported this work by referring children to the study and completing questionnaires.
Many headteachers, SENCOs and teachers from over 50 schools co-operated with the
study and welcomed me to their schools. This is very much appreciated.
Sincere thanks are offered to the children and their families who participated in the
study.
I would like to thank my parents for their help and assistance over the years.
Thanks to Joanne for some emergency last-minute proof-reading.
Else Nathan
who completed her PhD in 1929
at the University of Albertus, Kd nigsberg, Prussia.
Chapter 1
Speech disorder and heterogeneity
1.1. Overview of speech disorder
Childhood speech disorders are one of the most frequent types of communication
problem that speech and language therapists are likely to encounter (Enderby & Philipp,
1986). Whilst some speech disorders are attributable to hearing loss, structural or
physiological abnormalities like cleft palate and cerebral palsy, and cognitive
impairments, the majority of children with speech difficulties have no recognisable
aetiology.
Children with speech difficulties are likely to have a variety of co-existing
problems, including additional language problems (e.g. St. Louis, Ruscello & Lundeen,
1992; Shriberg, Tomblin & McSweeny, 1999) and are also more at risk than the general
population for problems with phonological awareness and the development of literacy
skills (Bird, Bishop & Freeman, 1995; Larrivee & Catts, 1999; Lewis, Freebairn &
Taylor, 2000b). Those whose intelligibility is affected will have problems making
themselves understood which will influence their ability to communicate effectively.
Focus is often placed on the educational sequelae of early speech problems and the
long-term consequences for people who are less intelligible and articulate than the general
population (Hodson, 1994). It is also important to emphasise the wider social
consequences of a speech difficulty. One study has reported that children with speech
difficulties are two-to-three times more likely to have some type of psychosocial disorder
(e.g. an attention deficit disorder or emotional disorder) than the general population
(Cantwell & Baker, 1987) and links have been made between speech and language
problems and psychosocial problems such as low self-esteem (Nash, Stengelhofen,
Toombs et al., 2001). Whilst very young children with speech difficulties are often
accepted by their peers, older children with persisting speech difficulties may experience
some negative responses from those with whom they interact. Additionally, a
phonological and/or phonetic difficulty will necessarily affect the extent to which a child
degree of membership of a social network is seen as related to the extent of use of certain
sociolinguistic variables (Chambers & Trudgill, 1980), with younger children particularly
adept at accommodating to new accents and dialects (Payne, 1980; Kerswill & Williams,
2000). Hence, difficulty with speech development could hamper social relationships
within a social network, and the ability to accommodate to the accent of new social
groups.
Prevalence estimates for the disorder vary quite widely. A study conducted by
Kirkpatrick and Ward (1984) of prevalence of speech disorder in Australia gives a figure
of 4.6%. Shriberg and Kwiatowski (1994) quote an estimate of 2-3% of developmental
phonological disorders in 3-11 year-olds in a series of studies conducted in the USA. In a
later study (Shriberg, Tomblin & McSweeney, 1999), the figure is revised to 3.8%.
However, the reported range of prevalence is wide, with some studies finding up to
10-15% of the normal school population may have speech difficulties (Ingram, 1972 as cited
in Enderby & Philipp, 1986; Elliot, 1978, as cited in Enderby & Philipp, 1986). A
systematic review of the literature reports an overall range of 2.3-24.6% (Law, Boyle,
Harris et al., 2000).
Diverse estimates of prevalence rates reflect the diverse way in which the disorder
is defined, assessed and identified, and even the label that is used. This problem of
definition and classification is commonly recognised (Shriberg Ct a!., 1999; Dodd, 1995;
Stackhouse & Wells, 1997). Terms that have been used to describe speech difficulties
are: dyslalia, developmental verbal dyspraxia, articulation disorder, speech disorder,
phonological disorder, phonological difficulty, phonological delay, speech impairment,
phonological impairment, phonetic disorder and speech processing difficulty. Each label
is associated with certain theoretical assumptions that draw on linguistic, medical and
psycholinguistic terminology. This, and the next, chapter will explore the evidence
associated with some of these levels of explanation. Discussion will focus on how the
heterogeneity of performance is seen to defy a single causal factor and how current
theories of speech disorder address this issue through sub-classification systems or
1.2. Speech disorder: a linguistic perspective
In the 1970s and 1980s, through the publication of texts such as Ingram's
Phonological disability in children (1976) and Grunwell's Clinical Phonology (1982),
the study of phonology revolutionised the assessment and treatment of speech disorder.
Speech development was seen as a process of learning a contrastive system of speech
sounds (Grunwell, 1987) rather than simply movements of the articulators. The term
'phonological disorder' was coined to describe a speech difficulty that resulted from a
breakdown at a cognitive level of linguistic knowledge compared to a 'phonetic
disorder', which is more peripheral in nature. Emphasis was placed on identifying
patterns in the speech data of a particular child and comparing these patterns with those
identified in normal development. According to Grunwell (1987), a child with a
phonological disorder might exhibit the following: persisting normal processes,
chronological mismatch (i.e. co-occurrence of early with age-appropriate phonological
processes), unusual processes (though Grunwell emphasises that it is likely to be difficult
to classify normal versus abnormal processes), variable use of processes (variability can
occur within the same word or across words), and systematic sound preference.
Stoel-Gammon (1991) adds a further characteristic: limited word and syllable shapes. These
characteristics are based on assumptions about the timing of normal phonological
development and thus an individual child's divergence from this normal development.
While our knowledge of normal phonological development indicates that children pass
through a relatively fixed and sequential order of acquisition, it has been observed that
small group studies often show a large degree of individual variation in early language
development (Stoel-Gammon, 1991). Larger studies of normal development actually
present generalisations that mask the inherent variability of the data. Making precise
judgements about what constitutes atypical performance is thus problematic.
The distinction between phonetic and phonological disorders has also been called
into question by the use of instrumental techniques such as electropalatography (EPG)
and instrumental acoustic analysis of speech. Weismer (1984), in a review of temporal
and spectral studies, describes how children who appear to a listener not to be making a
particular phonological contrast, e.g. voicing, may indeed be signalling a distinction
onset time (V.O.T.) might reveal that the child is making a phonological contrast that is
measurable through burst amplitude or a difference in fundamental frequency
immediately following the release of the sound. The implication here is that the child
does not have a phonological deficit as such but is failing to make a sufficient contrast for
a naïve listener to hear, possibly due to a constraint at a phonetic level, i.e. the difficulty
actually arises at a motor speech level.
A further difficulty with the phonological approach is what Kent terms "a clinical
means and ends rolled into one" (p.13, Kent, 1996). Describing a child's phonological
simplification processes becomes a label in itself (e.g. "this child fronts") and, by
extension, an explanation of the disorder ("fronting") as well as an indicator of how to
proceed with intervention ("work on the fronting problem"). However, this approach is
not explanatory and does not directly address how a particular speech problem might
develop. It has been suggested that identifying typical vs. atypical phonological processes
could give an indication of prognosis (i.e. typical processes are delays in development
and are less a cause for concern than atypical or disordered development). However,
there is little evidence that such processes explain or predict the course of the disorder,
not just at an individual level, but also at a group/population level. The strength of the
approach lies in offering a framework within which to make a detailed analysis of the
surface speech errors of an individual child. One can identify patterns that are occurring
across that child's speech that can be related and compared to the phonological patterns
that have been identified in normal development.
1.3. Speech disorder and motor programming deficits
Before the linguistics revolution's influence on the study of speech disorders,
there was an assumption that a child's difficulties were at an articulatory or motor
co-ordination level (Lambert & Waters, 1995). Indeed many children with speech
difficulties can have motor deficits that are associated with or causally related to the
speech disorder. Children with a label of developmental verbal dyspraxia are considered
to have, amongst other deficits, a problem with co-ordinating the fine motor movements
While the term dyspraxia remains controversial (Crary, 1993; Shriberg, Aram &
Kwiatkowski, 1997), motor difficulties have been noted in children with speech
difficulties (not necessarily limited to those with a dyspraxic label). Others have also
noted that some young children with speech difficulties do have poorer speech motor
control as measured by diadochochinetic rates (Henry, 1990) and by mean articulation
rates in spontaneous connected speech (Cohen & Waters, 1999). Pre-school children with
speech disorders have also been found to use less controlled gestures on lingual and labial
stop consonants, e.g. they were less able to manoeuvre jaw and tongue body separately
(Edwards, Fourakis, Beckman et al., 1999). Ozanne (1995), in a study of 100 children
with specific speech and/or language impairment aged 3;0 - 5;06, found quite a high
incidence of motor programming difficulties in this group. Although it was not reported
how many children exhibited no motor programming difficulties, a continuum of motor
programming difficulties was reported.
The implication of this study is that some motor programming behaviours are
exhibited in children attending speech and language therapy, with a range of severity,
who have not been diagnosed with developmental verbal dyspraxia. This argument is also
supported by McCabe, Rosenthal & McLeod (1998) who conducted a retrospective
analysis of 50 cases of children with articulation/phonology problems, aged 2-8 years,
who displayed behaviours commonly associated with developmental verbal dyspraxia.
However, Bradford and Dodd (1996) argue that motor programming/planning deficits are
not found in all children with speech difficulties. They found that it was children who
made inconsistent errors or who were defined as having developmental verbal dyspraxia
that performed more poorly on some oro-motor tasks.
Thus some evidence exists that the motor system is implicated in childhood
speech disorder and that it is necessary to think beyond the purely cognitive framework
that is suggested by a phonological approach.
1.4. The development of speech perception
Before reviewing the literature on speech input in the context of speech disorder,
a brief review of the development of speech perception is given. The continued
There is accumulating research evidence from the last thirty years that
demonstrates the sophistication of infants' speech perception skills. Infants are able to
discriminate between many phonetic contrasts used in different languages. These
discrimination skills are in place at infancy (Eimas, Siqueland, Jusczyk & Vigorito, 1971)
and within the first year of life these perceptual capacities have become attuned to the
native language. Indeed, between 7 and 10 months, there is a decline in infants' abilities
to detect some foreign contrasts (Werker & Tees, 1984; Best, 1994), suggesting the
beginnings of the development of language-specific phonetic recognition (Juszyck, 1992;
Kent & Miolo, 1995). There is even some neurophysiological evidence for the
development of language-specific memory traces in the brain before the age of 12 months
(Cheour, Ceponiene, Lehtokoski, Luuk et a!., 1998).
Whilst this body of work has increased our insight into the very early
development of speech perception, it is also clear that these skills continue to develop
through middle childhood or later (Locke, 1993). Infants may have an acoustic capacity
that is aligned to the demands of speech, but further development is required for a
language-specific phonetic and phonological system. Evidence from second language
learning, that children are better than adults at learning foreign languages with a
native-like accent, suggests that there is a degree of plasticity within the speech system
throughout middle childhood (Walley & Flege, 1999). Exploration of the continued
development of speech perception skills and the phonological system has been a
relatively neglected area in the literature until recently (Walley, 1993).
Locke (1993) describes three processes that occur in the development of speech
perception: maintenance, learning and loss, i.e. through exposure to one's native
language, a child maintains some perceptual biases but alters others and loses others from
the system. The child's speech perception system undergoes refinement as relevant
acoustic properties are integrated and irrelevant properties minimised. Burnham (1986)
describes two distinct periods when some speech perception abilities are lost. After a
period in infancy, a second period of loss occurs between the ages of four and eight. In
this period, the loss of the ability to perceive phonetic contrasts that are phonemically
irrelevant to the child's language occurs and is related to the increasing experience the
Another theory proposed by Nittrouer and colleagues describes a 'developmental
weighting shift' which occurs gradually. This theory emerged from consideration of the
problem of co-articulation. Co-articulation makes it difficult to recover and isolate the
underlying phonetic segments in a syllable or across syllables. Nittrouer,
Studdert-Kennedy & McGowan (1989) found that younger children performed less well than older
children and adults on differentiating between the two fricatives Is! and IjY, i.e. at a
phonemic level. The younger children also showed greater effects of co-articulation of
these fricatives with their accompanying vowels. This production task was taken as
evidence that younger children tend to organise their articulatory gestures at the level of
the syllable, rather than the phoneme. Perceptual experiments have backed up this finding
(Nittrouer & Studdert-Kennedy, 1987; Nittrouer, 1992): earlier on, their weightings are
different from adults', with more emphasis on dynamic cues, that signal syllabic rather
than phonetic segments. It is acknowledged that children are poorer at auditory
processing tasks as well (e.g. Elliott, Hammer & Scholl, 1989; Sussman, 1993). But there
is not sufficient evidence to show that these differences in auditory sensitivity can
account for the age-related differences found in these labelling/categorisation tasks
(Nittrouer & Crowther, 1998).
This process of a weighting shift is said to continue up to the age of 7 years and
represents a transition from larger units (whether they be words or utterances) to smaller
units (phonemes) (Fowler, 1991; Walley, 1993). As well as contextual effects (e.g.
co-articulation), children's speech errors have been cited as evidence for the use of larger
units early on. Children are often able to use a phonetic form accurately in one word, but
not in another, suggesting that they do not generalise the phonetic form across words but
instead store a larger, unanalysed form (Studdert-Kennedy, 1987). Additionally, children
may produce the same word differently on different occasions. The different attempts
might show similarities in the types of gestures used (e.g. lip closure) but the ordering
and inclusion of gestures may vary, suggesting that phonetic segments have not been
sequentially stored (Studdert-Kennedy, 1987). Other experimental evidence has shown
that there is a developmental change in children's categorical perception of consonants up
to the age of 6 (Burnham, Earnshaw & Clark, 1991); still further refinement up to the age
Hammer & Evan (1987) used a gating paradigm to show that young children needed to
be exposed to a larger part of a word compared to teenagers in order to identify it
correctly. This was taJen as evidence that they required more of a word's constituents to
respond. Because their perceptions of the words were more global, they found it harder to
respond to single phonemes.
This shift from larger to smaller units entails the reorganisation of the speech
perception system, resulting in the development of an adult-like phonological system.
This shift is driven by vocabulary development. As the size and diversity of children's
vocabularies grow, a reorganisation must take place so lexical items can be stored and
retrieved accurately. As Locke (1993) puts it:
"We should expect that phonemes fall out of words, that is, they are made possible by the child's knowledge of words" (p.95).
There is now consensus that, as a result of this shift, the unit of the phoneme
emerges rather than the previously held belief that phonemic segments were the unit of
organisation in the infants' system. As well as this impetus from lexical development,
Nittrouer and Crowther (1998) suggest that the development of speech production skills
could also play a part. Children must learn to extract information from the speech signal
that will enable them to create adequate articulatory instructions. With an increasing
vocabulary, there will be a greater need for speech output to become more accurate, and
so the information that is extracted from the input must be more detailed.
As Walley and Flege (1999) observe, beyond infancy, perceptual ability is
increasingly influenced or "contaminated" (p.308) by higher level cognitive factors,
including memory and language skills. There is some evidence to show how different
cognitive factors and different levels of linguistic processing will interact with perceptual
skills. Ganong (1980) reported that lexical representations can affect one's perception of
speech. In what was subsequently termed the 'Ganong effect', he found that a
phonemically ambiguous segment in a spoken string was likely to be perceived as being
part of a known word, e.g. the same phonemically ambiguous segment is interpreted as
Id] in the context of—ash, but as itt in the context of—ask.
The development of speech perception skills thus necessarily becomes bound up
influences is as important as the study of bottom-up phonetic information (Vihman,
1996).
1.5. Speech disorder and speech input difficulties
1.5.1. The relationship between speech output and speech input skills
It is the case that children with profound hearing loss are likely to develop a poor
phonological system, and the logic that an auditory component is influential in language
development has led to research looking at the role of mild and fluctuating hearing loss or
otitis media with effusion in speech disorder (e.g. Mody, Schwartz, Gravel & Ruben,
1999; Shriberg, Flipsen, Thielke et a!., 2000; Shriberg, Fnel-Patti, Flipsen & Brown,
2000). Findings in this area are complex: children with speech difficulties do not always
have a history of hearing problems. Conversely, some otherwise normally developing
children do have bouts of otitis media (Dodd, 1995) but have no subsequent speech
difficulties.
Whilst the evidence for links of this kind are complex, subtle auditory processing
difficulties not necessarily associated with otitis media have been proposed as an
explanation of the disorder. An auditory explanation for speech difficulties would
propose that children with speech problems have impaired perceptual difficulties and that
these difficulties exert a causal influence on speech development (Bird & Bishop, 1992).
Such causal hypotheses have been put forward as explanations of specific language
impairment (Tallal, 2000) although they remain an area of controversy (Bishop, Canyon,
Deeks & Bishop, 1999). While there has been no firm evidence that auditory skills play a
causal role in speech disorder, there is evidence to show that some children with speech
difficulties can have auditory perceptual difficulties.
Evidence for a one-to-one relationship between children's speech production
errors and their speech perception is equivocal. However, associations between input and
output skills have been found. A study by Marquardt and Saxman (1972) found
significant correlations between measures of speech output and the Wepman Auditory
Discrimination Test in a group of 30 children identified with significant speech
difficulties, as well as some who had language deficits. Raaymakers and Crul (1988)
Groenen, Maassen, Crul & Thoonen (1996) noted a relationship between perception and
production skills in a group of children with dyspraxia. The latter study found a
significant correlation between auditory processing skill and the frequency of place of
articulation substitutions in these children's production. However, there is little firm
evidence of a substantial or linear relationship. One reason for this could be
methodological: the difficulty in measuring the relationship between perception and
production (Locke, 1980).
Bird and Bishop (1992) addressed this by individually designing sets of words for
their auditory discrimination tasks for each of 14 participants aged five-and-a-half by
including phonemes that the child either omitted or produced incorrectly. However, even
with this method, they were unable to conclude a strong relationship between production
and discrimination. The children could discriminate some sounds they could not produce,
ruling out a one-to-one relationship. Overall severity of the speech impairment did
correlate with real word auditory discrimination. However, it did not correlate
significantly with nonword auditory discrimination. The authors make the important
point that performance is influenced by task design. It is also possible that the differing
relationship of word and nonword discrimination with speech output reflects the role of
stored representations and top-down influences in speech development which may come
into play with a real word, but not a nonword task.
1.5.2. Speech input deficits in children with speech difficulties
While the relationship between perception and production is debated, it is the case
that a growing number of studies have found that a proportion of children with speech
difficulties do show auditory processing deficits. Bird and Bishop (1992), in the same
study described above, identified deficits in auditory discrimination of words and
nonwords and phoneme discrimination tasks in their group of 14 children with speech
difficulties, although deficits were not apparent for all the children. Broen, Strange,
Doyle & Heller (1983) found differences between a group of 3-year-old children with
delayed speech and a group of 3-year-old children with normally developing speech on 3
approximant consonants. Although the normally developing group had mastered these
within the group and whilst some children's production errors were related to their
perceptual errors, for other children, there was no such direct relationship. Rvachew and
Jamieson (1989) also found group differences between older children with and without
speech difficulties, this time, on the fricative contrasts of/si 1$! and Is! /0/. Whilst for the
first contrast, only a subset of the speech disordered group performed poorly, for the
latter contrast, the majority had difficulty identif'ing this correctly. Watson (1997) (cited
in Watson and Hewlett, 1998) found children with speech difficulties appear to have
different perceptual strategies to controls. In this study, Watson presented children with
words with word initial fricatives that had been spliced into 9 steps. They were required
to identify the fricatives presented in minimal pairs. They were less accurate at this than
the control group.
Perceptual deficits have also been identified in children labelled dyspraxic.
Bridgeman and Snowling (1988) found that children diagnosed with developmental
verbal dyspraxia were age-appropriate in discriminating words and nonwords differing by
a single feature, i.e. is! it) and in discriminating words with the cluster sequence istJ Its!
but did have difficulty in discriminating nonwords with this cluster sequence. Groenen,
Maassen, Crul & Thoonen (1996) also identified a selective deficit. They tested
8-year-old Dutch children with developmental apraxia on an identification and discrimination
task using a seven step [b-d] continuum. The identification task was hypothesised to test
phonetic processing because the child must classif' each stimulus (from somewhere
along the continuum) using a phonemic judgement of which endpoint the stimulus most
closely resembled; the discrimination task, although contrasting points along the same
continuum, was likely to be based on auditory processing ability as well as phonetic
processing. The children were poorer than controls at discriminating monosyllabic words.
However, they performed equivalently to controls on the identification task using the
same continua, which, they suggest, shows that phonetic processing ability is intact while
auditory processing is impaired in this group.
These studies suggest that some children with speech difficulties may have
associated speech perception problems. However, because not all children with speech
difficulties have these types of deficits, a single causal link cannot be concluded from
methodology as is employed in the studies reviewed. Nonetheless, even if one
hypothesised that early auditory perceptual development was crucial (as Bishop (1997)
suggests could be a possibility), it would be hard to verify this even with a longitudinal
study. One would need to recruit participants with speech disorder as infants, well before
any speech disorder was apparent but when speech perceptual skills are already
developing.
An alternative to an auditory processing deficit would be a deficit at the level of
phonemic segmentation, as proposed by Bird and Bishop (1992). In addition to auditory
discrimination tasks, they looked at phoneme matching performance. For the auditory
discrimination tasks, the child was required to make same/different judgements of
nonwords and to make judgements about the accuracy with which words were said. Both
these tasks were individually designed using each child's phonological errors. For the
phoneme matching task, the child had to categorise sounds or words, and to perform
rhyming tasks. Whilst only a subset of the speech disordered group had auditory
difficulties, there was more widespread difficulty with the phoneme matching tasks. It is
argued that children with speech disorders have a more central difficulty with the
accurate analysis and segmentation of words rather than perceptual difficulties, i.e. a
problem of categorisation rather than discrimination. Their deficit lies with the ability to
perceive phoneme constancy and is reflected in reduced awareness of the internal
structure of phonological strings. One difficulty with this interpretation is that one of their
measures of auditory discrimination (based on a procedure recommended by Locke,
1980) was the ability to recognise correct pronunciations. This task seems more related to
a representational level (i.e. the ability to judge whether a stimulus matches an internal
phonological representation) than to a lower level auditory discrimination skill.
Additionally, tasks of phonological awareness have a greater cognitive load, and more
widespread difficulty on these tasks could reflect task demands and may also be
interpreted as the consequences of earlier (or concurrent) auditory discrimination deficits,
as acknowledged by Bishop (1997).
In a slightly different approach, Edwards, Fourakis, Beckman et al. (1999) claim
to show that children with speech difficulties do not have fully specified cognitive
found that on two tasks, a gating task and a noise-centre vowel identification task (that
required the children to identify words which had varying degrees of acoustic information
removed), a subset of a small group of 4-year-old children with speech disorders had
difficulties compared to controls. Whilst these tasks may indicate representational
deficits, no tasks are presented in this study to rule in or rule out other levels of
processing deficit. However, the notion that children with speech difficulties may have
poorly specified, fuzzy or inaccurate phonological representations is becoming an
increasingly popular view (Stackhouse, 2000; Rees, 2001; Waters, 2001). It reflects
parallel work in the area of literacy research which proposes that representational
difficulties may be fundamental and causative in the development of phonological
awareness and literacy skills (Snowling, 2000; Elbro, Borstrom, & Peterson, 1998).
The studies reviewed consistently find a subgroup of children who are
experiencing input processing difficulties. This result holds over studies that use a variety
of tasks to test this skill. A variety of hypotheses are proposed about what the nature of
the input processing deficit might be for these children and some studies explore these
hypotheses by contrasting different tasks in an attempt to examine loci of difficulty (e.g.
Groenen et al., 1996; Bird & Bishop, 1992).
1.5.3. Measuring speech input skills in children with speech difficulties
In evaluating the evidence for input processing deficits in children with speech
difficulties, it is important to consider issues surrounding the ways in which these skills
have been measured. A range of experimental tasks has been used in the studies reviewed
in this chapter. Whilst some are used or have been adapted for clinical use, e.g. the
same-different task used by Bridgeman and Snowling (1988), many are impractical to use
clinically and remain as experimental tools. Speech Pattern Audiometry, developed by
Hazan and colleagues (Hazan, Wilson, Howells et a!., 1995) is promoted as a potential
clinical tool, but such techniques are not in widespread clinical use.
There are several standardised measures of speech input processing in current use.
Two well-known American tests are the Goldman-Fnstoe-Woodcock Test of Auditory
Discrimination (1975) and the Wepman Auditory Discrimination Test (1973). The