HOW VALUABLE ARE THE TROPICAL FORESTS?
DEMONSTRATING AND CAPTURING ECONOMIC VALUE
AS A MEANS OF ADDRESSING THE CAUSES OF
DEFORESTATION
David PEARCE
Seminar paper for Conseil d'Analyse Économique
Seminaire Economie de L'Environnement
Et du Developpement Durable
The issue
FAO's Forest Resources Assessment 2000 (FAO, 2001) suggests that, globally, the rate of deforestation for all forests is some 9 million hectares per annum, or about 0.2% per annum. Rates of loss appear to be insignificant in Asia, Oceania, and even North and Central America. Europe shows a net gain. The largest losses are in tropical areas in Africa and South America. For these two regions alone, the average annual loss is 0.56% per annum. But the aggregated data also conceal further losses in tropical areas. The overall loss rate for Asia, for example, is surprisingly small, but it conceals annual loss rates of 1.9% in Yemen, 1.8% in Nepal, 1.6% in Sri Lanka, 1.5% in Pakistan, 1.4% in Philippines and Myanmar, and 1.2% in Indonesia. The North and Central America figures conceal startling annual loss rates of 5.7% for Haiti, 4.6% for El Salvador and 2.3% for Belize, while two of the Caribbean Islands have loss rates of 4.9% (St Lucia) and 3.0% (Netherlands Antilles). FAO's assessment appears to imply some slowing down in global rates of loss, and in rates of loss in tropical areas generally. The interpretation of FAO data is disputed. For example, FAO counts new plantations as offsetting losses in natural forest. Since plantations lack the biological diversity features of tropical forests, the aggregation procedure is misleading if biodiversity is the issue of concern. Excluding plantations, forest loss might be 16 million hectares per annum and tropical forest loss may actually have increased in the 1990s compared to the 1980s (WRI, 2001). Whatever the correct interpretation, it is clear that tropical forest loss remains a matter of grave concern.
Table 1 summarises the FAO data.
Table 1 FAO data on rates of forest loss
Region 1990 forest area 000 ha
2000 forest area 000 ha
Absolute annual change
000 ha
% annual change
Africa 702,503 649, 866 - 5,264 - 0.78
Asia 545,827 542,116 - 371 - 0.07
Oceania 201,992 201,163 - 83 - 0.04
Europe 1,030,804 1,039,513 + 871 + 0.08
N and
C.America 555,003 549,306 - 570 - 0.10
S.America 910,478 874,194 - 3,628 - 0.41
WORLD 3,946,608 3,856,159 - 9,045 - 0.23
Source: FAO (2001)
Proximate and fundamental causes of deforestation
Given this concern, the issue arises as to the best way to conserve what remains or, at least, to slow down the rate of forest loss. While other factors are at work, the two major, and
t1 t2
Plot 1 Plot 2 Time $
profit S+B
agroforestry
forestry and forms of sustainable agriculture such as agro-forestry. Again, many factors are at work but we select one dominant one. From the standpoint of the agent converting the forest, it is more profitable to adopt unsustainable practices than sustainable practices. In the case of logging, this is fairly clearly shown in the available, though limited, data on rates of return to alternative forestry regimes (Pearce et al., 2002). This finding holds independently of any subsidies that may be given to logging practices. Moreover, there are considerable profit incentives for illegal forestry since illegal practices are cheaper than regulated forestry which may limit the timber that may be taken or limit the technologies used to extract timber. Since economic rents in timber extraction can be very high, there is extensive pressure to log illegally and to share some of the rent with corrupt officials and politicians who can either reduce the potential enforcement of forest regulations or ensure that concessions are granted (Contreras-Hermosilla, 2001). Finally, high discount rates in logging practice mean that there is little or no incentive to replant after one rotation, especially as there remains a substantial 'frontier' of unlogged forest to which the logging company can move.
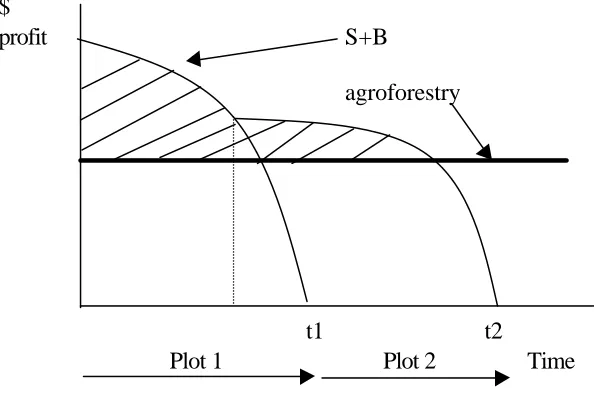
As far as agriculturists are concerned, the picture is similar. Figure 1 illustrates the sequence of slash and burn agriculture versus a sustainable alternative such as agro-forestry.
Figure 1: a 'nutrient mining' model
Forest loss $
MECL+G
MECL
A B C D O
Pop growth
from cities or even pure land speculation, so fallow periods are not observed and the sites become exhausted and are not usable for agriculture or as a forest. Also, if sites are held on to because of a shortage of frontier land (new sites) - i.e. the closer is t1 to t2 - the less likely it is that plot 1 will restore itself. The role of population pressure in reducing fallow periods, and hence causing 'permanent' deforestation, is thus evident. It is possible to imagine loss of fallow stimulating technological change, i.e. forms of intensive agriculture on plot 1 and there is indeed some evidence for this (Tiffen et al., 1994; Schneider, 1995). Overall, however, the picture is one of financial incentives to deforest.
The alternative to slash and burn, agroforestry, is shown in Figure 1 as a stream of constant profits. Since this stream must eventually outweigh the short-run profit streams of slash and burn, it would seem that agroforestry is the more profitable land use. However, farmers' discount rates tend to be very high (Schnieder, 1995; Cuesta et al., 1997; Poulos and Whittington, 1999). Accordingly, farmers pay little attention to distant returns. Indeed, at
discount rates of 20-30% per annum, little attention will be paid to returns more than a few years ahead (although there is some contrary evidence - Godoy et al., 2001). Overall, then,
agroforestry's sustainable returns will, when discounted, compare unfavourably with slash and burn. This immediately suggests one policy option, namely efforts to reduce discounting through, for example, special credit provision to counteract the high lending rates in informal credit markets.
Non-market values
If unsustainable land uses are (generally) more profitable than sustainable forest land uses the focus of attention shifts to the non-market values of conserved or sustainable used forests. If the overall social rate of return to sustainable uses exceeds the overall social rate of return to
unsustainable uses, then from a social standpoint, the sustainable use should be preferred. Figure 2 illustrates the basic model.
MNPBD+SUB
The curves are:
MNPBD = the marginal net development benefits from converting the forest to, say, agriculture
MNPBD+SUB = marginal net development benefits including subsidies to convert the land
MECL = marginal external costs borne locally from forest conversion
MECL+G = marginal external costs borne locally and by rest of world from forest conversion
There are 4 points of interest. C = the local private optimum, i.e. all externalities are disregarded and there are no subsidies. D = the local private optimum, i.e. all externalities are disregarded and forest conversion is subsidised. B = the local social optimum, i.e. local externalities are internalised but global externalities are ignored. A = the global social optimum, i.e. all externalities are internalised. Assuming a global view is taken, the desirable position is A. We can measure government failure as distance CD -i.e. the amount of forest land that is lost due to government subsidies to conversion. Local market failure is measured by BC, and global market failure by AB. The entire distance A-D measures the amount of forest conversion that takes place inefficiently. Only amount OA is efficient conversion, i.e. the optimal externality. Population growth also increases rates of forest loss by increasing the demand for
'developmental' benefits, e.g. land for food.
This simple model suggests that at least some forest conversion could be avoided if the non-market values of forests could be integrated into land use decisions. The first step, then, is to establish what these non-market values are.
The empirical evidence on non-market values
There is now a voluminous literature on the non-market values of forests. It is conveniently surveyed in Pearce and Pearce (2001) and is summarised here.
Forests generate a substantial number of goods and services which benefit humankind. These values might be conveniently classified as:
- Direct use values: values arising from consumptive and non-consumptive uses of the forest, e.g. timber and fuel, extraction of genetic material, tourism.
- Indirect use values: values arising from various forest services such as protection of watersheds and the storage of carbon.
- Option values: values reflecting a willingness to pay to conserve the option of making use of the forest even though no current use is made of it
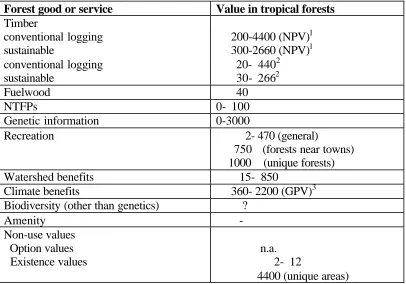
Summed together these values constitute the total economic value of the forest ecosystem1. Classified in this way, Table 2 summarises the economic values. It is important to understand the limitations of the summarised estimates. Values will vary by location so that summary values can do no more than act as approximate indicators of the kinds of values that could be relevant.
Table 2 Summary economic values ($ ha/pa unless otherwise stated)
Forest good or service Value in tropical forests Timber
conventional logging sustainable
conventional logging sustainable
200-4400 (NPV)1 300-2660 (NPV)1
20- 4402 30- 2662
Fuelwood 40
NTFPs 0- 100
Genetic information 0-3000
Recreation 2- 470 (general)
750 (forests near towns) 1000 (unique forests) Watershed benefits 15- 850
Climate benefits 360- 2200 (GPV)3 Biodiversity (other than genetics) ?
Amenity
-Non-use values Option values Existence values
n.a. 2- 12
4400 (unique areas)
Notes: 1 Net present value; 2 annuitised NPV at 10% for illustration. 3 - assumes compensation for carbon is a one off payment in the initial period and hence is treated as a present value. It is a gross value (gross present value) since no costs are deducted.
Source: Pearce and Pearce (2001)
Nonetheless, the table suggests that the dominant values are carbon storage and timber. Second, these values are not additive since carbon is lost through logging. Third, other values do not compete with carbon and timber unless the forests have some unique features or are subject to potentially heavy demand due to proximity to towns. Unique forests (either unique in
themselves or as habitat for unique species) have high economic values, very much as one would expect. Near-town forests have high values because of the use of NTFPs and fuelwood. Uniqueness tends to be associated with high non-use value. Fourth, non-use values for 'general' forests are very modest.
Overall, then, non-market values can be considerable. But for much tropical forest, the values are low, contrary to the general popular view that the value of information in the forests is spectacularly high. The relevant framework is, of course, the value of marginal or discrete changes in forests. In areas where major change is under way, these values should be high, in
1
accord with the economic view that the values rise as the remaining forest diminishes. There are also potential discontinuities in the damage functions, e.g. at some point removal of forest cover can result in substantial damage from landslides as has been witnessed in Thailand and St Lucia. Finally, some of the values are heavily disputed, as with the values of genetic material for pharmaceuticals (Pearce and Pearce, 2001; Simpson, 2002). This shows up in the ranges in Table 2.
Costs and benefits of forest conversion
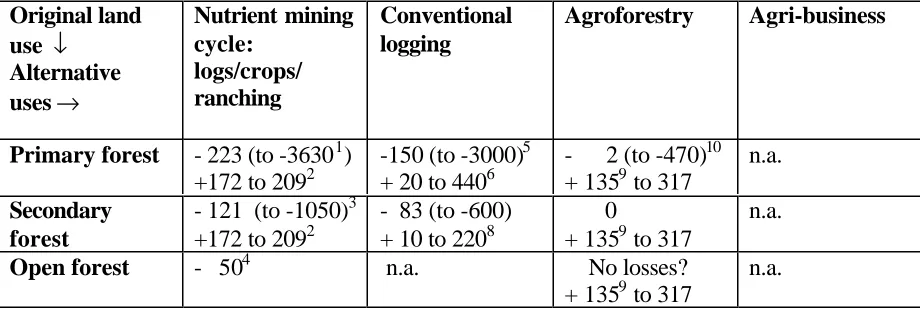
Some attempt can be made to look at the likely costs and benefits of converting existing forests to alternative uses. Unfortunately, the data remain very limited, and there is the added problem that costs and benefits obviously vary by forest location. Table 3 brings the estimates together. Table 3 Costs and benefits of changing forest land use $/ha/pa (- shows losses, + shows gains)
Original land use ↓
Alternative uses → Nutrient mining cycle: logs/crops/ ranching Conventional logging Agroforestry Agri-business
Primary forest - 223 (to -36301) +172 to 2092
-150 (to -3000)5 + 20 to 4406
- 2 (to -470)10 + 1359 to 317
n.a. Secondary
forest
- 121 (to -1050)3 +172 to 2092
- 83 (to -600) + 10 to 2208
0
+ 1359 to 317
n.a.
Open forest - 504 n.a. No losses?
+ 1359 to 317
n.a.
Notes: 1- assumes losses of carbon, all watershed effects, all NTFPs, all recreation, all genetic information, all non-use value. High losses relate only to scarce hotspots with high bio-prospecting value. No other account taken of biodiversity. 2 - based on Wunder (2000). Based on losses of carbon, NTFPs and Watershed values only. High value reflects high watershed values. 4 - carbon losses plus notional value for NTFPs. 5 - assumes half carbon loss and half watershed values lost. High value reflects high watershed and high genetic information values. 6 see Table 17. 7 -assumes half original carbon lost, all NTFPs lost and half watershed values are lost. 8 - -assumes half timber values of primary forest. 9 - based on Cuesta et al. 1997 updated to 2000 values, but note this estimate is taken from a NPV at a 25% discount rate. Hence we have projected the value also at 10% in order to make it comparable to other values. 10 - assumes tourism values only lost. For the justification of keeping other forest values see Chomitz and Kumari (1996).
While Table 3 is illustrative only - cost-benefit outcomes will be very much dependent on the actual location of the forests - it does suggest several likely conclusions. First, converting
assuming that most of the forest's services (including biodiversity) are retained. Fourth, and worth repeating, the comparisons all assume that non-market values are actually captured through some market creation mechanism. Fifth, the non-market values almost certainly fail to capture the economic value of biodiversity which, apart from the value of genetic information, is omitted from the analysis. Sixth, carbon storage is of the utmost importance to the economic case for forest conservation.
Tropical forest conservation policy
Forest conservation policy to date has tended to opt for the gazetting of unused forest land as a protected area. Such policies will be effective only in so far as (a) there are adequate monitoring and enforcement measures if there are competing uses for the land, or (b) there are no competing uses. Since the context of policy concern is one of land that has competing uses, the former condition becomes critical. Much of the literature on environmental compliance relates to industrialised countries with strong institutions (Cohen, 1999) but there is a rapidly emerging literature on corruption and non-compliance in developing countries (Contreras-Hermosilla, 2001). The kinds of policies needed have to be very wide ranging and may often take the form of wholesale political reform. Measures that have been successful in reforming subsidy systems - a major generator of rents - and which have adverse environmental effects are reviewed in Pearce and Finck von Finckenstein (1999). More recently, Rice et al. (1997) have suggested that a policy of allowing first rotation logging followed by protection may be the best policy. Ultimately, however, policies that rely on designating areas as officially protected are risky because the policy can create a set of losers - those who can no longer access the forest for timber and other products. This problem remains regardless of who holds the property rights to the protected area, although the biggest problems arise when a government holds the rights but fails to invest in enforcement mechanisms. Unless the losing group is compensated in some way, a considerable tension remains, placing the forest still at risk.
While enforceable protection remains a viable and desirable policy in some circumstances, the difficulties involved have prompted a reappraisal of conservation policies. Once the relevance of non-market values is understood, the obvious solution is to ensure that those values are turned into real resource flows. This is the process of 'capture' of non-market values. So long as the sum of net private conservation (or sustainable use) benefits and non-market benefits exceeds the net benefits from conversion, the workings of the market should encourage conservation and sustainable use. This process of 'market creation' has been proceeding apace in recent years. Market creation
Even before the Convention on Climate Change and the Kyoto Protocol were negotiated, some private companies in the USA were paying for the growing of trees in poorer countries. As trees grow, so they 'fix' or 'sequester' carbon. Hence growing trees helps to reduce global warming, although a problem arises when they end their lives because the carbon is then released again. Why would a firm voluntarily want to fix carbon? The two main reasons originally were (a) to get good environmental publicity and (b) to learn about these 'carbon deals' in anticipation that they would be formalised by the climate agreements as a legitimate way of reducing CO2. In the
latter case the idea is that the firm paying for the tree growing would claim a paper 'credit' for the CO2 it has reduced. If, one day, the firm is given a limit on its carbon emissions, it could claim
of deals will be legitimate, i.e. emitters in rich countries will claim offsets or credits against their carbon emission targets based on what they have done in poor countries. The idea is that firms facing emission targets in rich countries will find it cheaper to reduce carbon emissions in poor countries than in their own. So joint implementation promises to be more cost efficient than if the carbon reductions occur in the rich country only It is one further step away to think about the use of the carbon credits secured by the firms that pay for the carbon reduction. If they can buy and sell emission credits then we have a tradable emissions credit system. As is well known, like environmental taxes, tradable permit systems have the virtue of minimising the compliance costs in any regulation.
There are now many hundreds of 'carbon deals' virtually all of which are not directly linked to the Kyoto Protocol, but some of which will seek retrospective credit under the Protocol's 'Clean Development Mechanism'. Deals that have been done and which relate mainly to environmental 'PR' are those between Peugeot and Brazil, and between Shell and Gabon. These were brokered by 'Pro-Natura', a company formally set up to negotiate such deals. The effect is to establish property rights in carbon dioxide emissions or, the same thing, in the receiving capacity of the global environment.
In the same way, deals are beginning to emerge that relate to the local externalities from forest conversion. In Colombia, downstream farmers have established contracts to pay upstream forest owners to conserve the forests that protect and regulate their water supplies. New York City has chosen to protect upstream catchments in the Croton and Catskills watersheds, rather than pay nearly $5 billion for water treatments plants that it will need to deal with the projected pollution of water if the catchment is not protected. US experience is showing that for each $1 invested in catchment protection, several dollars can be saved in avoided treatment expenditure. Perrier helps surrounding farmers to reforest and protect filtration areas so that the quality of Perrier water is not affected adversely by farm runoff. In 1996 Costa Rica developed a new Forestry Law which recognised the role of forests in carbon fixation, watershed protection, biodiversity protection and scenic beauty. Funds raised by an energy tax are to be used to pay forest
landholders who provide these environmental services. The government also brokers deals whereby carbon is 'sold' to international and domestic buyers, the funds again being used to pay forest landholders to conserve these functions. Prices are set for the compensation on a per hectare per time basis, but these may change over time.
There are many other such examples. What began as a set of 'textbook' solutions to the deforestation problem is quickly evolving into a whole new array of real world conservation policy instruments. Several questions arise. If conservation can be brought about by bilateral and multilateral bargains through the market place, why have such markets not emerged before? In some cases the answer is that they have and that it is only know that information about them has emerged because of the new focus on market creation as a solution to deforestation.
In other cases, such as carbon deals, there was no incentive to create markets because the relevant constraint - some form of voluntary or mandatory carbon emission limit - was not in place. It is no accident that carbon deals date only from around 1989.
permits systems have been known for decades. As long as these solutions remain in the academic arena and not in the policy arena, little will happen. To begin with, policy language has to change and that requires a cumulative process of communication, advocacy and
experimentation. In this respect the role of those academics who do engage in the policy process and the role of some of the NGOs has been a crucial element in changing the focus of policy. National 'think tanks' and international bodies such as the OECD and the World Bank have also been vital: OECD, for example, has been a consistent advocate of market based environmental solutions since the inception of its Environment Directorate in 1971. In contrast, the World Bank was a latecomer to these approaches, perhaps because environmental economics was applied much later to developing country problems than to developed country problems.
Finally, while markets emerge 'naturally' in most respects there is a case for arguing that the kinds of bargains that characterise market creation require flows of information that do not necessarily emerge from markets. The links between forests and watershed protection may not be readily understood, as the various cases of catastrophic damage from deforestation show. Even where they may be understood, the context is often one of externality 'at a distance' so that the sufferer may be located a long way from the source of the externality. The scope for 'natural bargains' is then very limited. In all these cases there is a role for an intermediary or broker. Brokers have emerged fairly automatically in the carbon offset context. It is too early to say if a similar process will take place for other externalities. Governments may often have to 'nudge' the markets into being, but with the presumption being that governments themselves have no
particular expertise in managing the resulting markets.
International efforts to find a global solution to deforestation through some Forest Convention have, to date, systematically failed. The process of valuation and capture through created
e
References
Chomitz, K and Kumari, K. 1996. The Domestic Benefits of Tropical Forests: a Critical Review, Working paper 96-19, CSERGE, University of East Anglia and University College London.
Cohen, M. 1999. Monitoring and enforcement of environmental policy, in H.Folmer and T.Tietenberg (eds), The International Yearbook of Environmental and Resource Economics 1999/2000, Cheltenham: Edward Elgar, 44-106
Contreras-Hermosilla, A. 2001. Law Compliance in the Forestry Sector: An Overview, Rome: FAO, mimeo.
Cuesta, M., Carlson, G and Lutz, E. 1997. An Empirical Assessment of Farmers' Discount Rates in Costa Rica, Washington DC: World Bank
Dixit, A and Pindyck, R. 1994. Investment Under Uncertainty, Princeton: Princeton University Press.
FAO (Food and Agriculture Organisation), 2001. Forest Resources Assessment 2000, Rome: FAO
Godoy, R., Kirby, K and Wilkie, D. 2001. Tenure security, private time preferences, and the use of natural resources among lowland Bolivian Amerindians, Ecological Economics, 38, 105-118 Pearce, D.W., and Pearce, C. (2001). The Value of Forest Ecosystems: A Report to The
Secretariat of the Convention on Biological Diversity, Montreal: CBD
Pearce, D.W and Finck von Finckenstein, D. 1999. Advancing Subsidy Reforms: Towards a More Viable Policy Package, New York: United Nations
Pearce, D.W., Vanclay, J and Putz, F. 2002. A sustainable forest future? in D.W.Pearce, C.Pearce and C.Palmer (eds), Economic Valuation in Developing Countries, Cheltenham: Edward Elgar.
Poulos, C and Whittington, D. 1999. Individuals' Time Preference For Life-Saving Programs: Results From Six Less Developed Countries, Dept of Environmental Science and Engineering, University of North Carolina at Chapel Hill, mimeo.
Rice, R.,Gullison, R and Reid, J, 1997. Can sustainable management save tropical forests?
Scientific American, 276, 34-39
Simpson, D. 2002. Biodiversity. Washington DC: Resources for the Future
Tiffen, M., Mortimore, M and Gichuki, F. 1994. More People, Less Erosion: Environmental Recovery in Kenya, Chichester: Wiley.
World Resources Institute, 2001. Understanding the FRA 2000, Washington DC: World Resources Institute