c
Owned by the authors, published by EDP Sciences, 2016
QCD Physics with the CMS Experiment
S. Cerci1,a,b
1Adiyaman University, Faculty of Arts and Sciences, Department of Physics, 02040 Adiyaman, Turkey.
Abstract.Jets which are the signatures of quarks and gluons in the detector can be de-scribed by Quantum Chromodynamics (QCD) in terms of parton-parton scattering. Jets are abundantly produced at the LHC’s high energy scales. Measurements of inclusive jets, dijets and multijets can be used to test perturbative QCD predictions and to constrain parton distribution functions (PDF), as well as to measure the strong coupling constant αS. The measurements use the samples of proton-proton collisions collected with the CMS detector at the LHC at various center-of-mass energies of 7, 8 and 13 TeV.
1 Introduction
Quantum chromodynamics (QCD) is the theory of strong interaction describing the interactions be-tween quarks and gluons, so called partons. The QCD physics can be classified into two as “soft QCD” and “hard QCD” depending on the scale of the parton-parton interaction. The soft QCD takes into account the multiple partonic interaction (MPI), underlying event (UE) and fragmentation whereas the hard QCD takes into account the perturbative QCD theory, parton density functions (PDFs), parton shower modeling and initial and final state radiation (ISR and FSR). Many measurements in recent years have been performed for understanding the QCD both in experimental and theoretical aspects. In the theory side, particularly perturbative calculations at next-to-leading order (NLO) are available for most of the observables and Monte Carlo event generators are tuned more precisely with the mea-surements. In terms of the experimental side, many measurements have been performed with the data taken with the hadron colliders, which can be used to probe the theory in a large phase space.
2 Soft QCD measurements
In a high-energy hadron-hadron collision the underlying event (UE) is the activity that is not part of the parton-parton scattering in the collision. Understanding of the UE at high energies accurately is important to have precise measurements of standard model processes and searches for new physics. The underlying event activity is measured with the pp collisions at the centre-of-mass energy of √s = 13 TeV by the CMS Collaboration [1]. The leading charged-particles as well as leading charged-particle jets are used as reference objects in the pseudorapidity region (|η|<2). The direction of the leading charged-particle/charged-particle jets is taken into account for defining two transverse regions inη−φspace. In order to construct four observables (transMAX, transMIN, transDIF and
transAVE) that are useful for describing UE activity the two transverse regions are utilized. The four observables are descibed as following: transMAX (transMIN) is the density in the transverse side with higher (lower) particle density. The difference between transMAX and transMIN densitites is called as transDIF whereas the average of transMAX and transMIN regions is named as transAVE. Figure 1 shows the comparisons of leading jet transverse momentumpT data taken at different centre-of mass
energies √s=0.9,2.76,7, and 13 TeV withpythia8 (version 8.153)cuetp8m1 [2],cuetp8s1 [2] and Monash[3] tunes andherwig++(version 2.7.0) [4]cueths1 tune. A strong rise in the UE activity with the increasing centre-of-mass energy is observed as predicted by the MC model predictions.
(GeV)
T
Leading Jet p
10 20 30 40 50
) φ∆ ( ∆η ∆ / 〉 chg N 〈 0 0.2 0.4 0.6 0.8 1 1.2 1.4 1.6 1.8 2 2.2 CMS Preliminary (13 TeV) -1 281 nb
Data Monash CUETP8M1 CUETP8S1 CUETHS1 13 TeV 7 TeV 2.76 TeV 0.9 TeV transAVE (GeV) T
Leading Jet p
10 20 30 40 50
) φ∆ ( ∆η ∆ / 〉 chg N 〈 0 0.2 0.4 0.6 0.8 1 1.2 1.4 1.6 CMS Preliminary (13 TeV) -1 281 nb
Data Monash CUETP8M1 CUETP8S1 CUETHS1 13 TeV
2.76 TeV
transDIF
(GeV)
T
Leading Jet p
10 20 30 40 50
) φ∆ ( ∆η ∆ / 〉 chg N 〈 0 0.5 1 1.5 2 2.5 3 CMS Preliminary (13 TeV) -1 281 nb
Data Monash CUETP8M1 CUETP8S1 CUETHS1 13 TeV
2.76 TeV
transMAX
(GeV)
T
Leading Jet p
10 20 30 40 50
) φ∆ ( ∆η ∆ / 〉 chg N 〈 0 0.2 0.4 0.6 0.8 1 1.2 1.4 1.6 1.8 CMS Preliminary (13 TeV) -1 281 nb
Data Monash CUETP8M1 CUETP8S1 CUETHS1 13 TeV
2.76 TeV
transMIN
Figure 1.Comparisons between data at different centre-of-mass energies and various MC simulated samples for transAVE, transDIF, transMAX, and transMIN densities.
MPI, the parton saturation scale and the transition between soft and hard QCD may affect the particle and jet transverse momentum spectra at lowpT where the fixed-order partonic cross section
in theory diverges. The CMS experiment has measured the leading charged particles and leading charged-particle jets with the low transverse momenta inppcollisions at √s=8 TeV [5].
measure-transAVE) that are useful for describing UE activity the two transverse regions are utilized. The four observables are descibed as following: transMAX (transMIN) is the density in the transverse side with higher (lower) particle density. The difference between transMAX and transMIN densitites is called
as transDIF whereas the average of transMAX and transMIN regions is named as transAVE. Figure 1 shows the comparisons of leading jet transverse momentumpT data taken at different centre-of mass
energies √s=0.9,2.76,7, and 13 TeV withpythia8 (version 8.153)cuetp8m1 [2],cuetp8s1 [2] and
Monash[3] tunes andherwig++(version 2.7.0) [4]cueths1 tune. A strong rise in the UE activity
with the increasing centre-of-mass energy is observed as predicted by the MC model predictions.
(GeV)
T
Leading Jet p
10 20 30 40 50
) φ∆ ( ∆η ∆ / 〉 chg N 〈 0 0.2 0.4 0.6 0.8 1 1.2 1.4 1.6 1.8 2 2.2 CMS Preliminary (13 TeV) -1 281 nb
Data Monash CUETP8M1 CUETP8S1 CUETHS1 13 TeV 7 TeV 2.76 TeV 0.9 TeV transAVE (GeV) T
Leading Jet p
10 20 30 40 50
) φ∆ ( ∆η ∆ / 〉 chg N 〈 0 0.2 0.4 0.6 0.8 1 1.2 1.4 1.6 CMS Preliminary (13 TeV) -1 281 nb
Data Monash CUETP8M1 CUETP8S1 CUETHS1 13 TeV
2.76 TeV
transDIF
(GeV)
T
Leading Jet p
10 20 30 40 50
) φ∆ ( ∆η ∆ / 〉 chg N 〈 0 0.5 1 1.5 2 2.5 3 CMS Preliminary (13 TeV) -1 281 nb
Data Monash CUETP8M1 CUETP8S1 CUETHS1 13 TeV
2.76 TeV
transMAX
(GeV)
T
Leading Jet p
10 20 30 40 50
) φ∆ ( ∆η ∆ / 〉 chg N 〈 0 0.2 0.4 0.6 0.8 1 1.2 1.4 1.6 1.8 CMS Preliminary (13 TeV) -1 281 nb
Data Monash CUETP8M1 CUETP8S1 CUETHS1 13 TeV
2.76 TeV
transMIN
Figure 1.Comparisons between data at different centre-of-mass energies and various MC simulated samples for
transAVE, transDIF, transMAX, and transMIN densities.
MPI, the parton saturation scale and the transition between soft and hard QCD may affect the
particle and jet transverse momentum spectra at lowpT where the fixed-order partonic cross section
in theory diverges. The CMS experiment has measured the leading charged particles and leading charged-particle jets with the low transverse momenta inppcollisions at √s=8 TeV [5].
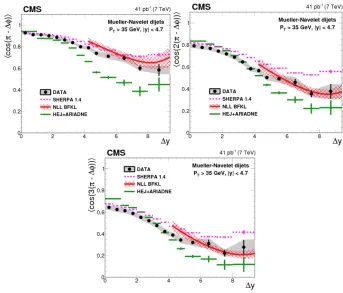
Azimuthal angle decorrelation between the hadronic jets, which are the visible manifestations of the energetic partons emerging from the underlying processes, is a sensitive probe for better under-standing of the QCD radiation in hard processes in high energy particle collisions. Such a
measure-ment may allow to test various models of parton showers or analytic pQCD resummation methods. According to the QCD prediction the production of two partons has a back-to-back topology in az-imuthal plane. Hence, the two jets show a strong correlation in their azaz-imuthal angle. When the higher-order processes are taken into account, the decorrelation, deviation from the back-to-back topology, occurs and more partons manifest in the final state. In the BFKL [6–8] framework such a final state is described with hard parton radiation ordered in rapidity and with no ordering onpT.
In contrast to DGLAP [9–13], BFKL predicts a strong growth of the inclusive dijet cross section with increasing rapidity interval between the low-pT jets. The measurement of decorrelation in the
azimuthal angle between the most forward and the most backward jets (Mueller-Navelet jets) is
per-fomed by CMS inppcollisions at √s =7 TeV [14]. The jets are required to have transverse
mo-mentapT >35 GeV and rapidity|y|<4.7, allowing a rapidity separation betwen the MN jets of up to ∆y=9.4. The anti-kt[15] algorithm with a distance parameterR=0.5 is used for the reconstruction
of jets. Decorrelations are measured as normalised differential cross-sections in∆φfor three rapidity separation in∆y <9.4, the average cosines of (π−∆φ),2(π−∆φ), and 3(π−∆φ), and ratios of these cosines (C2/C1 andC3/C2). Here∆φ = ∆φ1−∆φ2represents the difference between the azimuthal anglesφ1andφ2of the MN jets. Figure 2 shows comparison of the average cosines as a function of
∆ywith the LL DGLAP-based MC generator SHERPA, NLL BFKL-motivated MC generator HEJ
with hadronisation performed with ARIADNE and analytical NLL BFKL calculation.
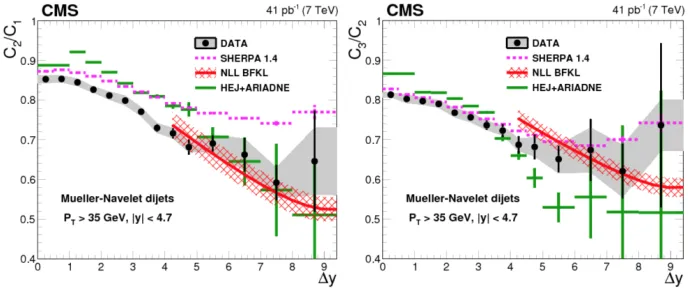
The measured ratiosC2/C1andC3/C2as a function of∆yare shown in Figure 3. The analytical NLL BFKL calculations gives the best description of data within the experimental and theoretical uncertainties.
Figure 3.Comparison of measured ratiosC2/C1(left) andC3/C2(right) as a function of∆ywith the LL DGLAP-based MC generator SHERPA, NLL BFKL-motivated MC generator HEJ with hadronisation performed with ARIADNE and analytical NLL BFKL calculations.
3 Hard QCD measurements
Most of the measurements performed in LHC extend well into the TeV range, with potential sensitivity to new physics. At the LHC, the principal colliding objects are quarks and gluons and hence QCD becomes the most dominant interaction process with very large cross-section. QCD processes take role as a major background to other standard model processes as well as the new physics searches. Jets are defined as the streams of particles clustered together and observed signatures of quarks and
gluons in the detector. Measurements of jet cross section as a function of the jet rapidity y and
the jet transverse momentum (pT) can provide information about all the aspects of the theory and
can optimize the hadronization and parton shower models. Such measurements also can be used to constrain the parameters of PDF’s at a fixed order of perturbation theory, which for most calculations
today is next-to-leading order (NLO) and provide a way of measuringαS at various
momentum-transfer scales. The inclusive jet cross-section gives an opportunity to access a wide range of proton momentum fraction,x. The largexjet production is dominated by quark jets whereas the lowerxjet production is dominated by gluons.
The double-differential inclusive jet cross section as a function of the jet transverse momentum pT and the absolute jet rapidity|y|is measured with the data collected by the CMS detector in pp
collisions at √s=8 TeV [16] and √s=13 TeV [17]. The √s=8 TeV measurement is carried out
using the anti-ktjet clustering algorithm with distance parameterR=0.7 in the range of|y|<4.7 for
jet transverse momenta 21 < pT < 2000 GeV. The corrected inclusive jet cross section is compared
with the predictions from pQCD at NLO using various sets of PDFs.
Figure 4 shows the measured double-differential cross sections for inclusive jet production as a
function of jetpT in the various|y|ranges. Open points represent the data of low-pT analysis, filled
points are for the high-pT one. CT10 PDF set is corrected with the non-perturbative (NP) factor for
The measured ratiosC2/C1andC3/C2as a function of∆yare shown in Figure 3. The analytical NLL BFKL calculations gives the best description of data within the experimental and theoretical uncertainties.
Figure 3.Comparison of measured ratiosC2/C1(left) andC3/C2(right) as a function of∆ywith the LL DGLAP-based MC generator SHERPA, NLL BFKL-motivated MC generator HEJ with hadronisation performed with ARIADNE and analytical NLL BFKL calculations.
3 Hard QCD measurements
Most of the measurements performed in LHC extend well into the TeV range, with potential sensitivity to new physics. At the LHC, the principal colliding objects are quarks and gluons and hence QCD becomes the most dominant interaction process with very large cross-section. QCD processes take role as a major background to other standard model processes as well as the new physics searches. Jets are defined as the streams of particles clustered together and observed signatures of quarks and
gluons in the detector. Measurements of jet cross section as a function of the jet rapidity y and
the jet transverse momentum (pT) can provide information about all the aspects of the theory and
can optimize the hadronization and parton shower models. Such measurements also can be used to constrain the parameters of PDF’s at a fixed order of perturbation theory, which for most calculations
today is next-to-leading order (NLO) and provide a way of measuringαS at various
momentum-transfer scales. The inclusive jet cross-section gives an opportunity to access a wide range of proton momentum fraction,x. The largexjet production is dominated by quark jets whereas the lowerxjet production is dominated by gluons.
The double-differential inclusive jet cross section as a function of the jet transverse momentum pT and the absolute jet rapidity|y| is measured with the data collected by the CMS detector inpp
collisions at √s=8 TeV [16] and √s=13 TeV [17]. The √s=8 TeV measurement is carried out
using the anti-ktjet clustering algorithm with distance parameterR=0.7 in the range of|y|<4.7 for
jet transverse momenta 21 < pT < 2000 GeV. The corrected inclusive jet cross section is compared
with the predictions from pQCD at NLO using various sets of PDFs.
Figure 4 shows the measured double-differential cross sections for inclusive jet production as a
function of jetpT in the various|y|ranges. Open points represent the data of low-pT analysis, filled
points are for the high-pT one. CT10 PDF set is corrected with the non-perturbative (NP) factor for
the low-pT data (solid line) and is corrected with the NP and electroweak correction factors for the
Figure 4.Double-differential inclusive jet cross section as a function of jetpTat √s=8 TeV.
high-pT data (dashed line). Electroweak correction factors are found to be negligible for low-pT.
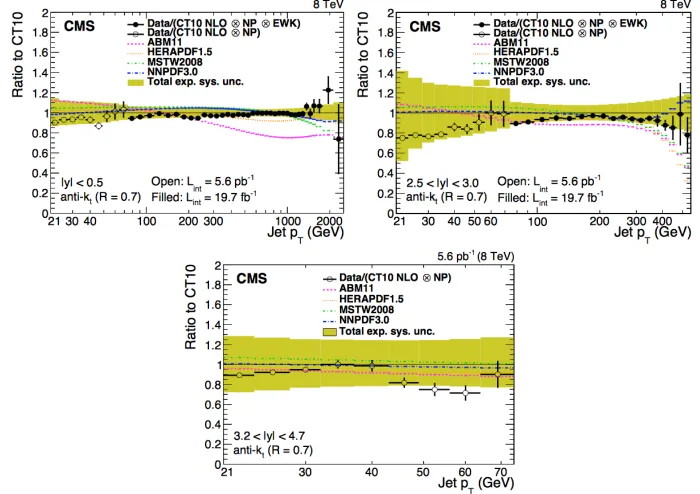
Figure 5 shows the ratios of data and alternative predictions to the theory prediction that uses the CT10 PDF set. For comparison, predictions employing five other PDF sets are shown in addition to the total theoretical and total experimental systematic uncertainties. The error bars represent the statistical uncertainty of the data.
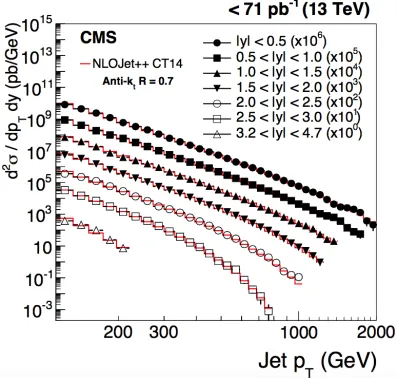
The CMS experiment has recently measured the double-differential cross sections at √s
= 13 TeV [17]. The anti-ktjet clustering algorithm is used for jet reconstruction for two distance
parameters,R=0.4 and 0.7, in a phase space region covering 114 GeV<pT <2 TeV and|y|<4.7.
Double-differential inclusive jet cross section as function of jetpT is shown in Figure 6. The results
are compared to the NLO++predictions using CT14 PDF set, and this theory prediction is corrected
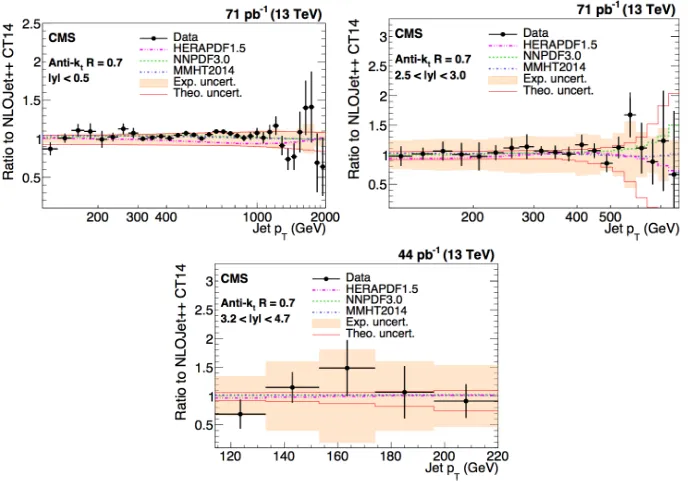
with the NP and electroweak effects. Ratio of measured values to theoretical prediction from
NLO-Jet++using the CT14 PDF set is shown in Figure 7. Predictions employing three other PDF sets are
also shown for comparison. The data are found to be consistent with the predictions within the range of 114<pT<2000 GeV.
Figure 6.Double-differential inclusive jet cross section as a function of jetpTat √=13 TeV.
The strong coupling constantαS and PDFs are a key ingredient for precision measurements at
hadron colliders. Determination ofαs(MZ) is based on the measurement of the inclusive jet production
cross section as function of jet pT and rapidity. Such a measurement is performed by CMS as it is
shown in Figure 8. The present measurement is in very good agreement with results obtained by previous experiments. The present analysis constrains theαS(Q) running forQbetween 86 GeV and
1.5 TeV, which is the highest scale at whichαS has been measured, to date.
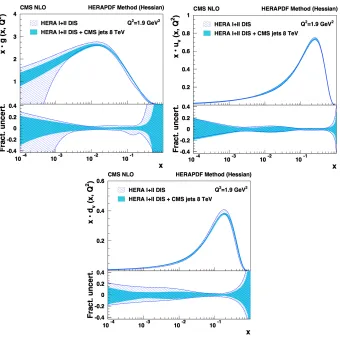
HERA DIS cross section data with the CMS inclusive jet cross section data at √s = 8 TeV,
provide important constraints on the gluon and valence-quark distributions in the kinematic range studied. These constraints are shown in Figure 9, where the distributions of the gluon and valence quarks are shown at the scales ofQ2 = 1.9 GeV2. Gluon PDF uncertainty is reduced in the wide range ofx, while for quark PDF uncertainty improvement is demonstrated for largex.
4 Summary
The CMS experiment has recently measured the double-differential cross sections at √s
= 13 TeV [17]. The anti-ktjet clustering algorithm is used for jet reconstruction for two distance
parameters,R=0.4 and 0.7, in a phase space region covering 114 GeV<pT <2 TeV and|y|<4.7.
Double-differential inclusive jet cross section as function of jetpT is shown in Figure 6. The results
are compared to the NLO++predictions using CT14 PDF set, and this theory prediction is corrected
with the NP and electroweak effects. Ratio of measured values to theoretical prediction from
NLO-Jet++using the CT14 PDF set is shown in Figure 7. Predictions employing three other PDF sets are
also shown for comparison. The data are found to be consistent with the predictions within the range of 114<pT <2000 GeV.
Figure 6.Double-differential inclusive jet cross section as a function of jetpTat √=13 TeV.
The strong coupling constantαS and PDFs are a key ingredient for precision measurements at
hadron colliders. Determination ofαs(MZ) is based on the measurement of the inclusive jet production
cross section as function of jet pT and rapidity. Such a measurement is performed by CMS as it is
shown in Figure 8. The present measurement is in very good agreement with results obtained by previous experiments. The present analysis constrains theαS(Q) running forQbetween 86 GeV and
1.5 TeV, which is the highest scale at whichαS has been measured, to date.
HERA DIS cross section data with the CMS inclusive jet cross section data at √s = 8 TeV,
provide important constraints on the gluon and valence-quark distributions in the kinematic range studied. These constraints are shown in Figure 9, where the distributions of the gluon and valence quarks are shown at the scales of Q2 = 1.9 GeV2. Gluon PDF uncertainty is reduced in the wide range ofx, while for quark PDF uncertainty improvement is demonstrated for largex.
4 Summary
CMS has been delivering a wealth of precise standard model results since the start of the LHC Run 2 era. The soft and hard QCD results presented here provide a deep insight to understand both per-turbative and non-perper-turbative QCD physics in LHC as it reaches higher energy. Results can also be utilized in improving MC models, determining strong coupling constant and constraining PDFs.
Figure 7.Comparisons of the ratios of data and various predictions to the theory prediction using the CT14 PDF set: for|y|<0.5 (top-left), 2.5<|y|<3.0 (top-right) and 3.2<|y|<4.7 (bottom).
Figure 8. Running of the strong coupling constantαS as measured in hadron colliders: Tevatron (D0), HERA
(H1 and ZEUS) and LHC (CMS).
The CMS collaboration has already provided extensive list of measurements on the jets as well as the strong coupling constant based on different observables. All measurements are found to have good
agreement with the world average value and the running ofαS is confirmed at the TeV scale. The
Figure 9.Distributions of gluon (top-left), u-valence quark (top-right), and d-valence quark (bottom) as functions ofxatQ2=1.9 GeV2.
5 Acknowledgments
Figure 9.Distributions of gluon (top-left), u-valence quark (top-right), and d-valence quark (bottom) as functions ofxatQ2=1.9 GeV2.
5 Acknowledgments
The author would like to acknowledge the Adiyaman University Scientific Activity Foundation and the organizers of ICNFP2016 for the funding.
References
[1] CMS Collaboration, CMS Physics Analysis SummaryCMS PAS FSQ-15-007, (2016)
[2] V. Khachatryanet al.[CMS Collaboration], Eur. Phys. J. C76, no. 3, 155, (2016) [3] P. Skands, S. Carrazza, and J. Rojo, EPJ C74, no. 8 (2014)
[4] M. Bahret al., Eur. Phys. J. C58, 639 (2008)
[5] V. Khachatryanet al.[CMS Collaboration], Phys. Rev. D92, 112001 (2015)
[6] E.A. Kuraev, L.N. Lipatov and V.S. Fadin, Sov. Phys. JETP44443, (1976)
[7] E.A. Kuraev, L.N. Lipatov and V.S. Fadin, Sov. Phys. JETP45199, (1977)
[8] I.I. Balitsky and L.N. Lipatov, Sov. J. Nucl. Phys.28822, (1978) [9] V.N. Gribov and L.N. Lipatov, Sov. J. Nucl. Phys.15438, (1972) [10] V.N. Gribov and L.N. Lipatov, Sov. J. Nucl. Phys.15675, (1972) [11] L.N. Lipatov, Sov. J. Nucl. Phys.2094, (1975)
[12] G. Altarelli and G. Parisi, Nucl. Phys. B126298, (1977)
[13] Y.L. Dokshitzer, Sov. Phys. JETP46641, (1977)
[14] V. Khachatryan et al. [CMS Collaboration], JHEP08139, (2016)
[15] M. Cacciari, G.P. Salam and G. Soyez, JHEP04063, (2008)
[16] V. Khachatryanet al.[CMS Collaboration], Submitted to JHEP, arXiv:1609.05331 [hep-ex],
(2016)