3-D microstructure measurement method by using SEM
Y. Arai1,a, S. Kanameishi1, and S. Yokozeki2
1Kansai University, Mechanical Engineering Department, 3-3-35 yamate-cho, Suita, Osaka, Japan 2Jyoko applied optics Lab., 2-32-1 Izumigaoka, Munakata, Fukuoka, Japan
Abstract. The three-dimensional measurement method by SEM has already been proposed by using the principle of shadow moiré. In this method, there are some troubles in order to perform a high-resolution analysis. A new method based on the principle of projection moiré by SEM is discussed to solve the troubles. In this paper, some shadows of the original grid on the surface of the object by back scattering electron beam are analyzed by using the spatial fringe analysis method and the new 3-D measurement based on a geometric analysis. The validity of the proposed method is confirmed by the experimental results. It is confirmed that the proposed method has a lateral high-resolution power.
1 Introduction
In development of high-technology, the demand of precise three-dimensional measurement of micro products is increasing year by year. Generally, they have been measured by optical measurement methods and/or SPM-technologies. However, each ordinary measurement method includes some problems, respectively. That is, the optical methods can perform the nano-meter-order-resolution in the direction along the optical axes by using some fringe scanning methods. However, the lateral resolution of the measurement is too poor as the three dimensional measurement. There is an unbalance in the measurement resolution power of three-dimension.
Under the situation, a novel three-dimensional measurement method based on shadow moiré for micro size products has been proposed by using the electron-beam of SEM as shown in Figure 1. However, the new proposed method includes also the troubles concerning removing the original grid image in the analyzing process. Then, the high resolution analysis is also obstructed by this grid image in the proposed method.
In this paper, a new measurement method based on the principle of projection moiré is discussed to solve the troubles of the method based on shadow moiré by SEM. And, the new improved 3-D measurement method is proposed. In this new system, the phenomenon producing shadows of grid by electron is also employed for 3-D measurement.
The validity of the measurement principle can be confirmed by the experiments. A FE-SEM is employed in the experiments for the confirmation of the principle in order to grab a clear fringe image in high magnification. Then, the flat plane and the sphere of which diameter is 300 micro meters are measured as the reference measured object. The pitch of the grating is 12μm. It is confirmed that the very high resolution measurement can be performed by the proposed method in this experiment.
a
e-mail : [email protected]
Fig.1. Shadow moiré image by SEM © Owned by the authors, published by EDP Sciences, 2010
2 Principle
2.1 Production of shadows of grid
In this paper, the mechanism of producing some shadows of the original grid on the surface of an object by back scattering electron beam is discussed in detail in order to develop the 3-D measurement method based on projection moiré.
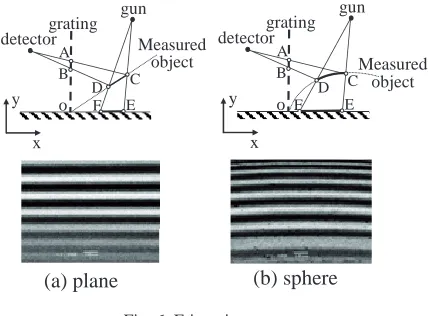
In this new system, the grating which is produced of a silicon-wafer under the silicon-process is used as a physical rigid grid. The schematic of the system is shown in Figure 2(a). Then, the grating is set vertically as shown in Figure 2(a) in order to remove the image of the grating from the fringe image.
As shown in Figure 2(a), a part of electrons from the gun can pass through the grating at the space of grid. On the other hand, some electrons are intercepted by the rigid grid. Then, electrons that can pass through the grating and that arrive at the detector would produce a light region of fringe(see Figure 2(b)). At the same time, some of electrons that cannot pass through the grating would also make a dark region of the fringe. In this phenomenon, it can be thought that the electrons can produce the shadow of the grating in the image of SEM. From this shadow-phenomenon in SEM image, a measurement system by SEM can be constructed as a measurement system corresponding to the optical measurement system.
In the ordinary optical system, the light beam is shut out by grids before arriving at the surface of the object, then, the shadow can be observed there. On the other hand, the electrons that are bounded on the surface of the object are shut off by the rigid part of the grid. The electrons cannot arrive at the detector. Then, the shadows in fringe image can be observed. As shown above, the process of production of shadows in SEM system is different from the concept of ordinary optical system. Therefore, in the measurement system by SEM, the position of a detector corresponds to the position of a light source of the optical system(Shadow moiré system), and the position of a gun also corresponds to the position of a photo sensor. That is, it can be thought that SEM system and optical system are completely opposite concerning the positions of light source and detector under the phenomenon of the production of shadows of grids. So, there is the peculiar situation of the measurement system by SEM under this idea. That is, only the gun of electron has the two-dimensional coordinate system. The sensor-system( detector ) has no two-two-dimensional coordinate-system. As the results, the fringe analysis is very confused by this characteristic of the SEM coordinate-system.
2.2 Principle of 3-D shape measurement by SEM
In the electron optical system in the vacuum chamber of SEM, the coordinate system as shown in Figure 3 is defined. In this system, there are some assumptions. One of them is the assumption concerning the coordination (position) of the electron gun and the detector. That is, it is assumed that
detector
gun
grating
object
Dark region
Light region
the coordinate (position) of the electron gun and the detector are known exactly. Under this assumption, the principle of 3-D shape measurement by SEM can be discussed as follows.
In the principle of section measurement(2-D measurement) of the micro structure shown in previous paper, it was assumed that the plane which includes an electron gun and a detector was perpendicular to the surface(Plane-3) of the grating and to the bottom plane(Plane-0) of the optical system. Under this condition, the coordinate of measured points has been detected.
The idea of 2-D measurement is expanded to the 3-D measurement in this paper. Under this new idea, the schematic of the coordinate is shown in Figure 3. Firstly, the plane (Plane-1) which includes the point of gun and the point of detector is defined. Then, the plane also includes the point(Point-0) which is the measured point in the image. However, the Plane-1 is not perpendicular to the bottom plane(Plane-0) in the coordinate system of 3-D measurement.
In this coordinate system, the electron from the gun is changed as the back scattering electron at the Point-1 on the surface of the measured object. Then, a part of such back scattering electrons passes though the grating and arrives at the detector. Such a flying trajectory of the electrons is analyzed as the ray tracing. Then, the coordinate of a measured point can be detected as the measured result. However, there are some complex and peculiar problems concerning SEM. As shown in previous paper, the coordinate of the measured point on the surface of the object is detected as the coordinate of the Point-0 on the bottom plane(Plane-0) of the electron optical system, because the detector does not have any 2-D coordinate system and only the electron gun has 2D coordinate system in the system of SEM. This is a very complex and peculiar characteristics of SEM. And, this is the most important characteristics of SEM which is different from ordinary optical system.
In a new 3-D analysis principle, firstly, the plane defined by three points (the 0, the Point-D(detector), and the Point-G(electron Gun)) is confirmed as Plane-1 shown in Figure 3. Then, the electron trajectories can be discussed on the Plane-1. Then, straight line GP0 is automatically defined
by Point G and Point-P0.
Furthermore, if it is assumed that the phase value of the fringe at Point-0 is detected by using the fringe analysis method as Phase(P0), it can be assumed that the electrons from the object surface pass
through the point on the grating which has the same phase value of Phase(P0). Because the grating is
defined as Plane-3, the Point-2 can be confirmed as the point which has Phase(P0). Then, Point-2 is
on the crossing line of Plane-1 and Plane-3. Therefore, Point-2 is also a point on the Plane-1. That is,
Object
G
(Gun)D
(detector)P
0P
1P
2Plane-1
Plane-0
Grating
(Plane-3)
x
y
z
the straight line DP2can be defined on the Plane-1. And, the measured point P1 can be confirmed as
the intersection of the line DP2 and the line GP0 on the Plane-0.
By such repetitions of these calculations of the coordination as the measured points, 3-D measurement of the measured object can be performed in high resolution power.
3 Simulation and experimental results
3.1 Simulation results for the new method
Before practically using this new measurement method, the influence of the error sources to the measurement results is investigated by a simulation. The conditions of the simulation are as follows:
The measurement object is a perfect flat plate. The plane is inclined by 60 degree from a horizontal line. The grating of which the pitch is 12μm is employed. Under these conditions, the influence of error of grating pitch, the influence of inclination of grating, and the influence of horizontal offset of grating are investigated. In next section, the influence of these error sources to the final measurement results will be discussed by using the results of simulation.
0
10
43
5
-5
0
4
2
Error of pitch
[%]
6
E
rr
o
r
[
μ
m
]
P
os
it
io
n
[
μ
m
]
0
10
43
5
-5
0
4
2
Error of pitch
[%]
6
E
rr
o
r
[
μ
m
]
0
10
43
5
-5
0
4
2
Error of pitch
[%]
6
E
rr
o
r
[
μ
m
]
P
os
it
io
n
[
μ
m
]
2
4
(a) Influence of inclination of grating
(b) Influence of pitch error of grating
(c) Influence of horizontal offset of grating
3.1.1 Influence of inclination of grating
As shown in Figure 4(a), when the grating leans, it is checked how measurement error would happen by this inclination of grating. Firstly, it can be confirmed that the error does not happen symmetrically concerning the zero of the angle of the inclination. When the grating leans to this side(positive angle), the error is larger than the situation that the grating leans to the other side. When the inclination angle error is 5 degrees, it can be observed that the error would be about 1 micro meter at 10 micro meter from the grating. It is also confirmed that this error source would bring a large error in the measurement. It is very important to set up the grating vertically in the measurement in order to keep the high precision. In the practical grating, it is confirmed that this error is less than 1 degree. That is, the influence by this error source to the total error can be estimated about 1 micro meter.
3.1.2 Influence of pitch error of grating
As shown in Figure 4(b), when the grating of which pitch is 12 μm includes the error(±5%), it is checked how measurement error would happen by the pitch error. In the case of this error source, it is confirmed that a large error would happen in the μm-order at the far point from the origin of the measurement. When the error is 5%, it is confirmed that the error would be about 1 μm at 10 micro meter from the grating. It is confirmed that the measurement result is strongly influenced by this error source. In the experiment, it is confirmed that the error of pitch of practical grating should be less than 1% to control the total error within 1μ m.
3.1.3 Influence of horizontal offset of grating
As shown in Figure 4(c), the grating should be set exactly on the origin. The influence of horizontal positioning error of the grating is checked. In the case of this error source, the absolute quantity of error is small. Then, the error by this error source is independent of the quantity of the error. Then, it would be about 1 micro meter.
In the experiment, it is confirmed that this error source is less than 0.5 μm in the practical grating. It can be thought that the influence of this error source to the total error is about 500nm.
In this simulation, the influence by three kinds of error source was discussed. It is confirmed that the total error in the measurement result depends on two error sources seriously. Now, if the limitation of this measurement will be discussed by using these three kinds of error sources, the limitation in the total error of this method would be predicted under the practical condition. In the practical use, the inclination of grating would be set within 1 degree. The pitch error of grating would be less than 1% of the pitch of the original grating. And, the horizontal offset of grating would be less than 500 nm.
Under these conditions, the root mean square of them is calculated. From this result, the maximum total error of this method would be estimated as 530 nm in the practical use. It is thought that the investigation by more kinds of error source should be required for the practical uses according to the experiments as future works
3.2 Measurement of a flat plane
The surface of silicon wafer as a plane, which is a slope of 60 degrees, is measured in order to investigate the characteristics (resolution power) of this method.
measurement principle. And fringe images as shown in Figure 6 can be grabbed by the system. The grating is made of SiO2 in the silicon process. The pitch of the grating is also 12 micro meter. The
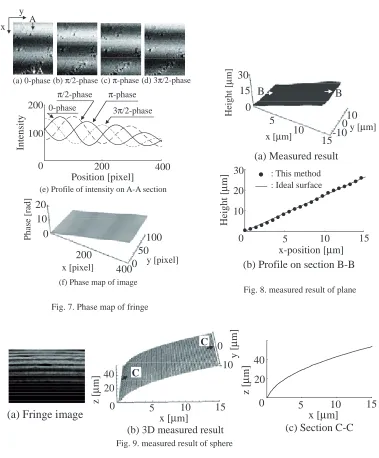
thickness is 1 micro meter. The optical system has a micro stage(PZT-xy) which can give the positioning of the measured object precisely in a direct observation by SEM and under a remote-control. Furthermore, the grating can be shifted in Z-direction by using PZT-z. Then, four sheets of fringe images shown in Figure 7(a)-(d) can be grabbed by the movement of the grating. In the fringe images shown in Figure 7, each fringe image is based on a different phase(pai/2 rad). The intensity profile on section A-A of Figure 7(a) is shown in Figure 7(e). It can be confirmed that each intensity profile also is based on a different phase(pai/2 rad).
In the phase analysis process, the phase map of fringe can be detected by applying these fringe profiles to the spatial fringe analysis method. In previous report, the phase map was detected by using the operation based on Wavelet transform. However, when the Wavelet transform is employed in the phase detection process, there were some errors in the results. And sometimes, a long calculating time was required for detecting the phase map by the Wavelet transform operation. In the new 3-D shape measurement analysis process, the phase map is given without any Wavelet transform operation. The phase map can be given more precisely by temporal phase shifting method instead of the Wavelet transform operation.
The phase map is shown in Figure 7(f). Though there is some uneven distribution, it can be confirmed that the phase map can be detected. The pass point(Point-2) on the grating can be also detected by applying these results(phase map) to the new measurement principle shown in Figure 3. Then, the 3-D shape of object can be detected by the calculation based on the new measurement principle. The 3-D measurement result is shown in Figure 8(a). It can be confirmed that there are also some uneven distribution in the measurement result. It can be thought that the uneven distribution would depend on the phase map. The profile on section B-B shown in Figure 8(a) is shown in Figure 8(b). It can be confirmed that there is also the undulation whose period is 5 micro meter.
After this measurement, the measured surface of the object(wafer) was again measured by profile meter. Then, it can be also confirmed that the result by profile meter includes the undulation whose
60 degree
Gun
Detector
Grating
x
y
z
PZT-z
PZT
-xy
Measured object
(a) Schematic of measured system (b) Measured system Fig. 5. Optical system in the vacuum chamber of SEM
y x detector grating
gun Measured
object o
A
B C
D E F
Fringe images without any Image of grid y
x detector grating
gun Measured
object o
A
B C
D E F
(a) plane (b) sphere
period was about 5 micrometer, and that the amplitude of the undulation was 100nm. It is thought that the more precise investigation of the new method is required by measuring more perfect plane(reference).
3.2 Measurement of a sphere(minutia bearing ball)
By using the optical system that was the same measurement system employed in the measurement of the flat surface, a sphere of which diameter is 300 micro meter is measured in order to investigate the characteristics of the new method for the measurement of the object with a convex and concave shape.
The 3-D measurement result of the sphere is shown in Figure 9. Though there is some vagueness in the measurement result shown in Figure 9, it can be confirmed that the new 3-D shape
0 400 200 0 100 20 10 50 P h as e [ rad ]
x [pixel] y [pixel]
0 200 400
200 100 In tens it y Position [pixel] 0-phase
π/2-phase π-phase
3π/2-phase
(e) Profile of intensity on A-A section
(f) Phase map of image
(a) 0-phase (b) π/2-phase (c) π-phase (d) 3π/2-phase
x y
A
A
Fig. 7. Phase map of fringe
0
15
10
0
10
15
-10
x [μm]
y [μm]
5
Hei g h t [ μ m]30
B
B
0 5 10 15
30
20
10
x-position [μm]
He
ight
[
μ
m]
: This method : Ideal surface
(a) Measured result
(b) Profile on section B-B
Fig. 8. measured result of plane
(a) Fringe image
0 5 10 1520 40
0
-10
x [μm]
y [ μ m] z [ μ m]
(b) 3D measured result C
C
0
20
40
5
10
15
x [μm]
z [
μ
m]
measurement method can analyze with very high spatial resolution power(33nm). In the ordinary optical method, such a high spatial resolution power cannot be performed by the diffraction phenomenon. However, the high lateral resolution power is realized by the measurement based on SEM in the new system. The measurement of micro structures is performed by using this feature of the high lateral resolution power that is a special function of SEM.
4 Conclusion
In this paper, a novel three-dimensional measurement method for a micro size product is proposed by using the electron-beam of SEM. A new measurement method based on the principle of projection moiré was discussed by using fringe analysis method. The mechanism of producing shadows of the grid on the surface of the object by back scattering electron beam was explained. In this measurement system, the grating which is produced of a silicon-wafer using the silicon-process based on the semiconductor fabrication technology is used as a physical rigid grid. Fringe image as shadows of grid is analyzed by the spatial fringe analysis method. A flat plate was measured in order to confirm the validity of the measurement principle of this new measurement system. Then, it is confirmed that the standard deviation of this measurement was about 100nm, when the grid whose period was 12μm was used. The error analysis was also performed. The influence of the error sources was discussed.
As the application of this method, the very small 3-D structure of the minutia bearing ball of which diameter is 300 micrometer is measured in the same manner of the flat plane. It is confirmed that the measurement with the high resolution power can be performed. Particularly, it can be confirmed that the lateral high resolution power(33nm) is realized in this method. This lateral high resolution power could not be realized in ordinary optical measurement methods.
References
1 G. Binning, H. Rohrer, Helv. Phys. Acta, 55, 726-735(1982).
2 D. Malacara, Optical shop testing, 2ed(John Wiley & Sons, New York, 1992) pp 501-598 and pp 653-685.
3 J. I. Goldstein, Scanning Electron Microscopy and X-Ray Microanalysis ( Plenum press, New York, 1981) pp1-203.
4 L. Reimer, Transmission Electron Microscopy (Springer-Verlag, Berlin Heidelberg , 1984) pp1-133. 5 T. Suganuma, J. Electron Microscopy , 34, 328 (1985)
6 J. W. Dally, D. T. Read, Experimental Mechanics, 33 270 (1993). 7 D. M. Meadows, Appl. Opt., 9 ,942 (1970) .
8 H. Takasaki, Appl. Opt., 9,1467 (1970).
9 Y. Arai, S.Yokozeki, J. Modern Optics, 53 , 2641 (2006).
10 D. Post, B. Han, P. Ifju, High Sensitivity Moiré, (Springer-Verlag, New York, 1994) pp. 118-131. 11 Y. Arai, S. Yokozeki, T. Yamada, Appl. Opt., 34, 4877 (1995).
12 Y. Arai, S.Yokozeki, Appl. Opt., 38, 3503 (1999).