Article
1
Model for the correlation between anodic dissolution
2
resistance and crystallographic texture in API 5L
3
steels
4
Manuel Madrigal-Cano, Luis Hernández-Maya, José M. Hallen, Mónica Corrales-Luna, Elsa M.
5
Arce-Estrada, Tu Le Manh *
6
Departamento de Ingeniería en Metalurgia y Materiales, ESIQIE-IPN, UPALM Edif. 7, Zacatenco, Ciudad de México CP
7
07738, México; [email protected] (M.M.C.); [email protected] (L.H.M.);
8
[email protected] (J.M.H); [email protected] (M.C.L.); [email protected] (E.M.A.E)
9
* Correspondence: [email protected] (T.L.M.); Tel.: +52-55-572-96000 ext. 54205
10
11
Abstract: The present work shows a novel physical-mathematical model to estimate the average
12
corrosion resistance index from the crystallographic texture in API 5L steels. The crystallographic
13
texture of the studied steels was measured by means of the X-ray diffraction technique. The model,
14
based on the symmetric spherical surface harmonics for a BCC structure, is capable of describing
15
the anisotropy surface of anodic dissolution resistance of the crystal and establishing a
16
straightforward relationship between crystallographic texture, surface roughness, and metal
17
corrosion behavior. The predictions of the average corrosion resistance index made from the
18
crystallographic texture were in good agreement with those obtained from potentiodynamic
19
polarization curves for the investigated steels. This agreement validates the capacity of this model
20
and opens the possibility of applying it as a novel criterion for the material selection and design
21
stages in order to combat metal corrosion problems.
22
Keywords: Corrosion resistance index; anodic dissolution; crystallographic texture; pipeline steels;
23
material selection
24
25
26
1. Introduction
27
The corrosion of metal and its alloy has been extensively studied in the literature [1,2]. The
28
significant impact of corrosion on metallic structures in daily life and in the industry has been
29
mainly concerned due the complex nature of the phenomenon. In this regard, the correct selection of
30
materials could be an important tool and criteria for reducing the corrosion effect during the stage of
31
the structure construction and design. A common way to evaluate the corrosion activity of metals is
32
through the corrosion potential and current density (Ecorr and jcorr), and Tafel slopes (ba and bc) by
33
means of the polarization techniques [3-5]. However, these experimental techniques present several
34
limitations, including blindness, workload, and time and resource wastes [6], and variations in the
35
results due to the strong dependence on the sample surface state as well as many metallurgical
36
variables of the material, namely chemical composition and microstructure [7-9]. In order to solve
37
this problem, it is necessary to evaluate and quantify the corrosion resistance of the material by other
38
means.
39
It is experimentally verified [9-18] that some metallurgical parameters, such as: grain size, grain
40
boundary, and their distributions, as well as surface roughness, crystallographic planes, and grain
41
orientations have a strong influence in the anodic dissolution of the metal. This, in fact, refers to
42
anisotropy of corrosion, which in a crystal can be defined as the dependence of dissolution velocity
43
of metals on the crystallographic directions [18]. Meanwhile, in a polycrystal this behavior depends
44
on the crystallographic texture, since the texture develops in alloys and metals during their
45
mechanical deformation, such as rolling, forging, drawing, etc. and the established preferred
46
orientations can introduce significant changes to the material properties [19]. The significant effect of
47
the crystallographic texture on the corrosion process has been studied in several works [20-22]. One
48
of the typical examples is given in [22] in which they found that the formation of texture components
49
{111}||ND fiber developed by warm rolling could reduce the susceptibility to hydrogen induced
50
corrosion (HIC), while the closeness to the random texture and the strong {001}||ND texture have a
51
harmful effect on the resistance of hot-rolled samples to HIC. In spite of this fact, a generalized
52
model capable of describing the link between the crystallographic texture and corrosion behaviour
53
of metals (anodic dissolution) has been lacking.
54
The first idea on the correlation between the pitting corrosion resistance and the
55
crystallographic orientation was proposed Shahryari et al. [23] in which the susceptibility of the
56
surface to pitting corrosion (the pitting susceptibility index) for a SS316LVM stainless steel was
57
determined from electron back-scatter diffraction (EBSD) data through the generalized spherical
58
harmonics. Nevertheless, this model presents several limitations, namely: it does not include the
59
sample symmetry and only uses the steel sample with one type of texture, the number of coefficients
60
of the harmonic function is small, and furthermore, the information obtained from EBSD is not
61
statistically significant (in comparison with the X-ray macro-texture technique) to completely
62
describe the dependence of crystallographic orientations on the anodic dissolution of the material.
63
Meanwhile, in another approach, Venegas et al. [24] studied the influence of crystallographic
64
texture, measured by X-ray diffraction, on pitting corrosion in low carbon steels. They proposed that
65
the ratio of the volume fraction of the beneficial (high-resistance) texture fibers to volume fraction of
66
the detrimental (low-resistance) fiber could be a good measure for the pitting susceptibility of the
67
material. However, on the one hand, this model could not establish a direct link between the pitting
68
corrosion and the crystallographic texture, since the beneficial/detrimental texture components and
69
their volume fraction should be previously provided and carefully analyzed. On the other hand, the
70
main interest of our work lies on the anisotropy of the anodic dissolution resistance of
71
polycrystalline materials. Moreover, a property of a polycrystal must be properly determined by
72
averaging that over the orientation distribution function (ODF) [25] rather than using the volume
73
fraction.
74
Therefore, in this work, a new model is proposed, based on the idea of Sharyaria et al. [23], for
75
the correlation between the metal surface anodic dissolution resistance and the crystallographic
76
texture of three API 5L steels with different microstructures and textures. This proposed model
77
allows predicting the average corrosion resistance index (CRI) of API 5L steels from the
78
crystallographic texture information using the symmetrical spherical surface harmonics. The
79
average CRI predictions made from X-ray texture measurements will be validated by comparing
80
with the experimental results obtained from potentiodynanic polarization curves.
81
2. Materials and Methods
82
2.1 Materials
83
Three API 5L steel samples (X56, X52, and X60) extracted from out-of-service pipelines were
84
used to explore the relationship between the crystallographic texture and the corrosion behavior.
85
These samples were prepared on rolling plane (perpendicular to the normal direction (ND) of the
86
sample reference system) and transverse planes (perpendicular to rolling direction (RD) and to
87
transverse direction (TD)), and were cut in disk shape with dimensions of a 1 cm in diameter and 2.5
88
mm in thickness; their chemical composition can be seen elsewhere [25]. All the steel samples were
89
mechanically prepared by grinding with SiC grit papers and polishing with colloidal silica down to
90
20 nm in order to obtain a flat and deformation-free surface. The microstructure study was carried
91
out in a scanning electron microscopy SEM JEOL JSL-6300.
92
2.2 Crystallographic Texture Measurements
94
The texture of the steel samples was obtained in an X-ray diffractometer Bruker D8 Advance
95
with Cu Kα radiation, coupled with an Euler cradle. Three incomplete pole figures {011}, {002}, and
96
{112} were measured on the rolling plane for each steel sample. These experimental pole figures
97
were analyzed using the arbitrary defined cell (ADC) method [26] implemented in the LaboTex
98
software to calculate the orientation distribution function (ODF). From this ODF, the inverse pole
99
figure (IPF) of ND was determined for each steel sample.
100
2.3. Electrochemical Tests
101
The potentiodynamic polarization was performed in an EG&G-PAR potentiostat/galvanostat
102
Model 263A, using a conventional three-electrode cell coupled to a water-jacketed to control the
103
temperature by a circulator bath (PolyScience). The electrochemical cell was composed of a API 5L
104
steel disk-shaped sample embedded in epoxy resin with an area of 0.7854 cm2 as the working
105
electrode (WE), a graphite bar as the counter electrode, and a saturated calomel electrode (SCE) as
106
the reference electrode with a Luggin capillary leading to the surface of the WE. These experiments
107
were performed in the same steel samples (surfaces), which were previously measured by the X-ray
108
texture diffraction. The solution used to simulate the corrosive environment of pipelines was
109
selected according to Espina-Hernández et al. [27]. The ion concentrations of this solution are in
110
shown Table 1.
111
Table 1. Ions concentration for the solution used in this work.
112
Solution Cl- (ppm) SO42- (ppm) pH
S** 290 16.8 4.351
1 adjusted using HNO3 solution.
113
The potentiodynamic polarization curves were recorded, starting from -700 mV to +250 mV at a
114
scan rate of 0.16 mVs−1, after 30 minutes of immersion when the steel samples were stabilized at the
115
open circuit potential. All the potentials reported in this work were presented versus SCE.
116
3. Model for Estimating the Average Corrosion Resistance Index from Crystallographic Texture
117
It is known that corrosion is an interfacial phenomenon [28]. For this reason, understanding the
118
surface state and its associated properties (surface roughness, planar density) could be a good
119
indicator of the corrosion susceptibility of a family plane {hkl} parallel to that metal surface, since
120
crystalline defects can be active sites for corrosion nucleation and growth mechanism.
121
On the one hand, Venegas et al. [24] have shown that the resistance to the dissolution anodic
122
(R{hkl}) as a function of point density (ρ{hkl}) associated with crystallographic planes {hkl} exposed to the
123
surface of the metal can be determined by:
124
{ }
{ } 2 2 2
{110}
2
hkl hkl
R
h k l ρ
ρ
= =
+ +
, (1)
subjected to the constrain: h+k+l=2n
125
where ρ{110} is the point density for the plane {110} for BCC structure and ρ{hkl} is the point density
126
for the plane {hkl}, defined by:
127
{ } 2 2 2 2
0 2
??
hkl h k l n
a h k l
ρ = + + =
+ +
,
(2)
where a0 the lattice parameter is equal to 2.866 Å for pure BCC iron. All of them, hereafter, must
128
satisfy the constrain h+k+l=2n ∀ n ∈ N for this kind of lattice.
129
On the other hand, Blonski et al. [29] found that the relationship between surface roughness (Sr)
130
and crystallographic orientation can be given by:
131
2 2 2 2 8
3
D r
Fe
A
S h k l
A π
= = + + , (3)
2
2 2 2 0
2D 2 牋
a
A = h +k +l , (4)
2 0 3 16
Fe
A = πa , (5)
where A2D is the area of the surface unit cell y AFe is cross-sectional area of Fe atom in bcc lattice.
133
From Eq. (2) and (3), could be related to Sr by the following expression:
134
{ }hkl 牋1 ? r
S
ρ ∝ , (6)
Therefore, from Eq. (1) and (6) the relationship between R{hkl} and Sr can be established by the
135
following proportionality:
136
{ }hkl 1 r
R S
∝ , (7)
Eq. (7) means that if the crystallographic plane associated to the grain parallel to surface has less
137
surface roughness, its resistance to the anodic dissolution is higher. Interestingly, this has been
138
verified by Shahryari et al. [23] using the generalized spherical surface harmonics, which helps
139
evaluate the anisotropic nature of corrosion behavior of stainless steel. Nevertheless, their approach
140
does not consider the crystal – sample symmetry relationship. Therefore, it is more convenient to
141
apply the function developed by Bunge [30] in which the symmetric spherical surface harmonics
142
with cubic symmetry is given by:
143
max ( ) :
4 1
( ) ( )
l M l l l l
E h e k hμ μ μ
= =
=
, (8)where is series of constants for various value of l, which were calculated using the least-
144
-squared-fitting method [23] in Mathematica software.
145
The symmetric spherical harmonic function with cubic symmetry,k h:l( )
μ
, in Eq. (8) can be
146
determined by [30]:
147
: : :
0
( ) ( , ) ( ) cos
m l
m l
l l l
m
k hμ kμ φ β B μP φ mβ
=
= =
, (9)where
μ m l
B: is the symmetry coefficients for cubic symmetry, (ϕ)is the normalized
148
associated Legendre functions with ϕ (0° ≤ ϕ ≤ 45°) and β(0° ≤ β ≤ 53°) in the asymmetric
149
triangle of the cubic crystalline system, and h ={h, k, l} is the direction normal to the crystallographic
150
plane of interest with Miller indices {hkl}.
151
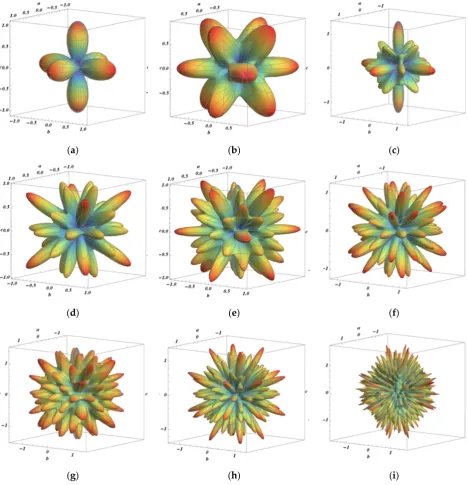
The values of l in Eq. (8) were chosen to be up to 22 instead of 10 as proposed by Shahryari et al.
152
[23] due to the fact that with small l order up to 10 the rate of change of the harmonic function will be
153
(a) (b) (c)
(d) (e) (f)
(g) (h) (i)
Figure 1. Rate of change of symmetric surface harmonics in function of the order l using Eq. (9):
155
(a) : , (b) : , (c) : , (d) : , (e) : , (f) : , (g) : , (h) : , (i) : .
156
Taking into account Eq. (7) and (8), the link between the anodic dissolution resistance, E(h), and
157
surface roughness is:
158
( )
1r
E h S
∝ , (10)
It is important to stress that indeed Eq. (10) gives a physical meaning to the symmetric spherical
159
surface harmonic function and possibility to describe the corrosion anisotropy in function of any
160
crystallographic planes. Henceforth, from Eq. (10) E(h), which is called CRI, can be defined as the
161
new anisotropy function of the anodic dissolution rate for the crystallographic planes parallel to the
162
surface, that can be estimated over the entire angular range of the asymmetric triangle of the cubic
163
crystal system (standard triangle due to the cubic symmetry).
164
For a better understanding of the benefit of Eq. (10), the variation of the anodic dissolution
165
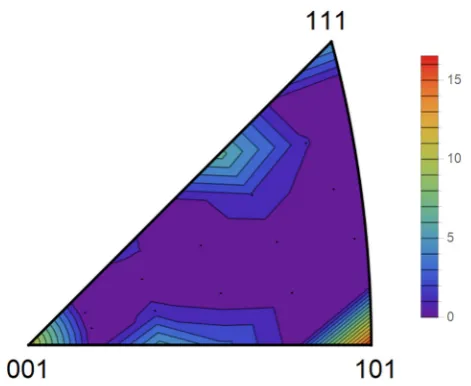
inverse pole figure of the cubic crystal system, as depicted in Fig. 2. The results indicate that the
167
tendency to suffer corrosion follow the sequence: {213} > {111} > {103} > {112} > {001} > {101}, which is
168
in agreement with the trends observed in several works [7,8,10,11,14,15,19].
169
Figure 2. Anisotropy surface of anodic dissolution of BCC materials calculated for any
170
crystallographic plane.
171
In order to study the corrosion property in a polycrystal, it is important to know the
172
crystallographic texture or the distribution of crystal orientations in it. The average CRI, ( ), in a
173
polycrystalline material with orientation distribution function (ODF), f(g), can be determined for any
174
anodic dissolution vector (Φ, β) in the sample´s reference system [30]:
175
( )
(
,)
(
, ,) ( )
ES
E h =E Φ β =
E Φ β g f g dg,(11)
where g is the crystal orientation and ES is the Euler space; f(g) should be determined considering
176
cubic (crystal) – orthorhombic (sample) symmetry.
177
Since corrosion initiates on the metal surface rather than the entire volume of the material [28],
178
the average CRI of a polycrystal is interested in the direction perpendicular to the rolling plane of the
179
sample. Under this condition, ( ) in a polycrystal can be estimated by [23, 30]:
180
( )
(
,)
(
,) ( )
sinE h ∝
E Φ β IPF Φ β Φ Φd dβ, (12)where IPF(Φ, β) is the intensity of the inverse pole figure from measurement X-ray diffraction.
181
Eq. (12) proposes a new model for estimating the average CRI in API 5L steels from the
182
crystallographic texture measurements. This will be evaluated in steel samples with different
183
microstructures and textures for further comparison with results obtained from electrochemical
184
tests.
185
4. Results and Discussion
186
4.1 Microstructure Study
187
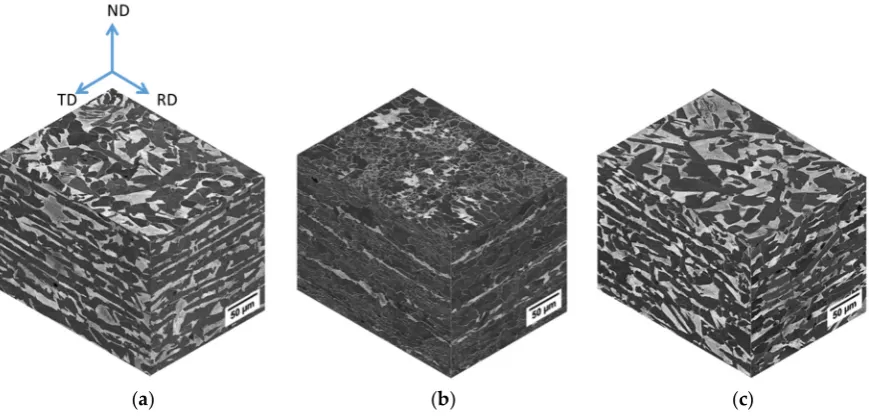
Figure 3 shows the SEM micrographs represented in form of a cubic crystal for the three studied
188
steels (X56, X52, and X60). In general, the microstructures of these steels are different (from one
189
material to the next) and are consisted of a ferrite/pearlite structure. The equiaxial grain morphology
190
is observed on the rolling plane with a relatively homogeneous distribution, while slightly elongated
191
grains were observed on the transverse (RD-ND and TD-ND) planes due to the pipe manufacturing
192
process [31-33]. Microstructural parameters, such as grain size and volume fraction of the ferrite
193
phase, were determined by optical microscopy, as shown in Table 2. The inclusion (MnS) content in
194
(a) (b) (c) Figure 3. SEM micrographs of the studied steels: (a) X52, (b) X56, and (c) X60. The ferrite and
196
perlite phases are represented by dark and bright colors, respectively.
197
Table 2. Microstructural parameters of the investigated steels.
198
Steels Average grain size (µm)
Ferrite content (%) X56 13.88 ± 0.012 75.45 ±0.05 X52 18.22 ± 0.014 64.38 ±0.03 X60 23.89 ± 0.015 65.42 ±0.03
4.2 Estimation of the Average CRI from Crystallographic Texture
199
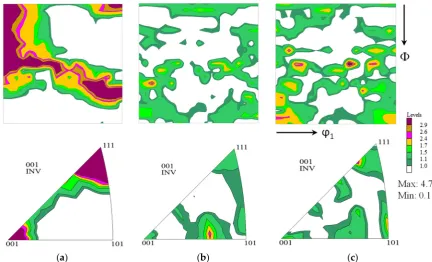
Figure 4 shows the cubic-orthorhombic representation of the X-ray-derived ODF of the studied
200
steels in the ϕ2 = 45 section of Euler space [30] before electrochemical tests. It can be seen that the
201
crystallographic texture of these steels is characterized by the presence of the {100}||ND, {111}||ND,
202
{112}||ND, and {110}||ND texture fibers with different degrees of development [24, 32, 33]. The
203
volume fractions (V{hkl}ND) of these fibers are calculated as shown in Table 3. The formation of these
204
fibers can be explained as the consequence of the hot rolling process during the pipe manufacturing
205
[31-33]. X52 and X60 steels (Fig. 4b and 4c) show a texture close to random, with a relatively small
206
degree of difference, while the X56 steel (Fig. 4a) presents a markedly strong texture dominated by
207
{112}||ND and {111}||ND fibers. These differences in texture could influence the electrochemical
208
behavior of these samples and consequently, their corrosion resistance.
209
Table 3. Volume fraction of the texture fibers (in %) of the studied steels.
210
Materials V{001}ND V{112}ND V{111}ND V{110}ND
X56 8.32 22.29 12.34 3.93
(a) (b) (c)
Figure 4. ϕ2 = 45° section of the orthorhombic ODFs and their corresponding IPF of ND of the
212
studied steel samples before polarization tests: (a) X56, (b) X52, (c) X60. The angles (Φ and ϕ2) are
213
ranging within 0 - 90° in the Euler space.
214
As previously explained, due to the surface behavior of corrosion phenomena it is more
215
convenient to use data from the IPFs of ND. In fact, the representation of texture through of the IPFs
216
is a direct way to exhibit the distribution of crystallographic planes of the grains exposed to the
217
surface sample (crystallographic planes perpendicular to the steel sample surface). Data obtained
218
from these IPFs were used to calculate the average CRI, ( ), which is summarized in Table 4. The
219
results indicate that corrosion resistance of the studied steels follows the order of: X56 < X52 < X60,
220
since the higher CRI values, the better the corrosion resistance is. According to the previous texture
221
analysis, this order is logical, thus the high volume fraction of {112}||ND and {111}||ND fibers (see
222
Table 3) in X56 steel clearly indicates that this material presents a more loose structure (low dense
223
planes) than the other steels (X52 and X60) with higher volume fractions of {110}||ND fibers, since
224
{110} are the most compact (dense) planes in BCC materials. Therefore, X56 steel may dissolve at
225
higher rate than X52 and X60 steels. This effect can be clearly observed through the illustration of the
226
anisotropy surface of anodic dissolution shown in Figure 2. It is important to note that this analysis
227
only helps when texture is markedly different – in terms of both texture components and their
228
magnitude – from one material to the next, such as X56 and X60 steel, but it is notoriously difficult
229
when the texture is similar as can be seen in the case of X52 and X60 steels. Nevertheless, the model
230
proposed in this paper could satisfactorily solve this problem, since Eq. (12) deals with all texture
231
data obtained from the IPFs of the material. For the sake of validation, the average CRI predictions
232
made from the crystallographic texture will be compared with those obtained from potentiodynamic
233
polarization curves.
234
4.3 Model Validation
235
In order to verify the validity of the proposed model, parameters that represent the corrosion
236
resistance of the three steels (X56, X52, and X60), were determined by the potentiodynamic
237
polarization method and compared the predictions made from crystallographic texture
238
measurements. It is important to stress that according to Fushimi et al. [10] the anisotropic corrosion
239
of iron can be satisfactorily studied by means of the potentiodynamic polarization technique, as well
240
as, it could experimentally reveal the dependence of the crystallographic orientation on corrosion
241
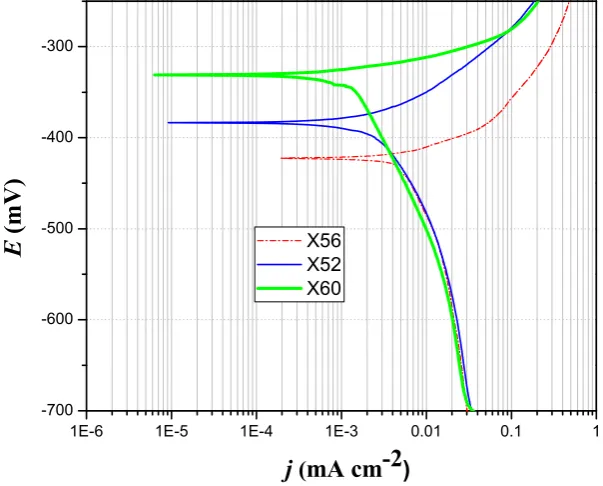
Figure 5 shows the comparison of the potentiodynamic polarization curves recorded onto the
243
three steels in the solution S**. It can be observed in Fig. 5 that the three investigated steels exhibit
244
markedly different corrosion behavior as a consequence of their difference in textures and
245
microstructures.
246
Figure 5. Potentiodynamic polarization curves of the three studied steel surfaces recorded at
247
room temperature in the solution S**, at a scan rate of 0.16 mVs−1.
248
From the analysis of these curves, some parameters of interest, such as: Ecorr and corrosion
249
current density (jcorr), which describe the propensity of each sample to suffer corrosion, were
250
determined, as shown in Table 4. Also, these values can be associated with the susceptibility of the
251
material to corrosion. Thus the less negative values of Ecorr can be associated with the greater
252
corrosion resistance [6]. Accordingly, the corrosion resistance should be the highest for X56 steel and
253
the lowest for X60 steel. This corrosion resistance order agrees excellently with the CRI predictions
254
made from crystallographic texture. However, this thermodynamic aspect would not be sufficient to
255
predict the corrosion behavior for all materials to occur, since they have different microstructural
256
features and textures, and a criteria regarding kinetic point of view could be appropriate satisfy the
257
present need.
258
Table 4. Corrosion parameters determined from the potentiodynamic polarization curves of the
259
studied steels.
260
Materials ( ) Ecorr
(mV)
jcorr
(µA)
bc
(mV/dec)
X56 6.35 427 ±8 6.19 ±0.08 177 ±9
X52 6.72 390 ±7 3.01 ±0.05 216 ±7
X60 7.01 335 ±6 1.66 ±0.03 191 ±8
261
In fact, this can be clarified by comparing other parameter of the corrosion process, jcorr,
262
determined from the polarization curves for each steel (see Table 4). The results of Table 4 clearly
263
indicate that X56 steel a higher jcorr values than those of X52 and X60 steels. In the same trend, other
264
parameters Ecorr, and bc also confirm that the corrosion resistance is given by the following sequence:
265
X56 < X52 < X60. This follows the exact order of corrosion resistance or average CRI as has been
266
previously predicted by X-ray texture measurements using Eq. (12).
267
It is important to note that the grain size could be a factor that affects the corrosion behavior of
268
the material, since X56 with the smallest grain size can be more corroded. Notwithstanding,
269
1E-6 1E-5 1E-4 1E-3 0.01 0.1 1 -700
-600 -500 -400 -300
E
(mV)
j
(
mA cm-2
)
X56according to Taleb et al. [28] verified that at long time exposure the effect of the grain size is
270
negligible and in most of case on the mechanism of pitting corrosion depends strongly on the
271
crystallographic orientation.
272
In general, the good agreement between average CRI predictions made from crystallographic
273
texture and experimental results estimated from potentiodynamic polarization curves verifies the
274
validity of the proposed and generalized model and the strong effect that the crystallographic
275
texture has on corrosion behavior of the material. This influence can be explained due to the intimate
276
and physical link between the surface roughness and crystallographic texture of the material. Also, it
277
comes to support and extend the earlier idea proposed by Shahryari et al. [23] on estimating the
278
corrosion resistance index in API 5L steels. Furthermore, the results open a new possibility to apply
279
the proposed model as novel criteria for the selection and design of metal and its alloys, as well as an
280
effective tool for the pipeline integrity strategy.
281
5. Conclusions
282
For the first time, a novel model is proposed and validated for the estimation of the average
283
corrosion resistance index from the crystallographic texture in API 5L steels, with different
284
microstructures and textures. This model is based on the symmetric spherical harmonics,
285
considering cubic (crystal) – orthorhombic (sample) symmetry with a large number of series of
286
constants, and capable of faithfully reproducing the anisotropic nature of corrosion behavior of the
287
material. The strong agreement is observed between the predictions of the average corrosion
288
resistance index made from crystallographic texture measurements and the experimental results
289
from potentiodynamic polarization curves for all the studied steels. It is established that a material
290
with a higher value of average corrosion resistance index could have a better corrosion resistance.
291
The proposed and validated model provides a novel criterion for the selection and design of metal
292
and its alloys. Furthermore, it is possible to apply as an effective tool for the pipeline integrity
293
strategy.
294
Author Contributions: M.M.C. and T.L.M. developed the mathematical model and designed the experiments;
295
J.M.H., M.M.C., M.C.L., and L.H.M. prepared the samples and performed crystallographic texture
296
measurements; M.M.C., M.C.L. and E.M.A.E carried out electrochemical experiments. M.M.C., J.M.H. and
297
T.L.M. analyzed and interpreted the data; M.M.C. wrote the manuscript with the assistance and revision of
298
T.L.M., L.H.M., M.C.L., and E.M.A.E.
299
Funding: This research was funded by CIDIM-IPN, México, under Project 425102817 and CONACYT.
300
Acknowledgments: This work has been supported by CIDIM-IPN, México, under Project 425102817. The
301
support of CONACYT is also acknowledged.
302
Conflicts of Interest: The authors declare no conflict of interest.
303
References
304
1. Vanaei, H.R.; Eslami, A.; Egbewande, A. A review on pipeline corrosion, in-line inspection (ILI), and
305
corrosion growth rate models. Int. J. Pres. Ves. Pip. 2017, 149, 43-54,
306
http://dx.doi.org/10.1016/j.ijpvp.2016.11.007 (22 November 2016).
307
2. Tawancy, H.M.; Al-Hadhrami, L. M.; Al-Yousef, F.K. Analysis of corroded elbow section of carbon steel
308
piping system of an oil–gas separator vessel. Case Stud Eng. Fail Analysis 2013, 1, 6-14.
309
http://dx.doi.org/10.1016/j.csefa.2012.11.001 (14 December 2012).
310
3. Arzaghi, E.; Abbassi, R.; Garaniya, V.; Binns, J.; Chin, C.; Khakzad, N.; Reniers, G. Developing a dynamic
311
model for pitting and corrosion-fatigue damage of subsea pipelines. Ocean Engineering 2018, 150, 391-396.
312
https://doi.org/10.1016/j.oceaneng.2017.12.014 (16 December 2017).
313
4. McCafferty E. Introduction to Corrosion Science, Springer: New York, E.U., 2010, p.119, 978-1-4419-0454-6.
314
5. Bhandari, J.; Khan, F.; Abbassi, R.; Garaniya, V.; Ojeda, R. Modelling of pitting corrosion in marine and
315
offshore steel structures - a technical review. J. Loss Prev. Process Ind. 2015, 37, 39-62
316
6. Liu, A.; Ren, X.; Zhang, J.; Wang, C.; Yang, P.; Zhang, J.; An, M.; Higgins, D.; Li, Q. Wu, G. Theoretical and
318
experimental studies of the corrosion inhibition effect of nitrotetrazolium blue chloride on copper in 0.1 M
319
H2SO4. RSC Adv. 2014, 4, 40606. DOI: 10.1039/c4ra05274a.
320
7. Frankel, G. S. Pitting corrosion of metals a review of critical factors, J. Electrochem. Soc. 1998, 145(6),
321
2186-2198. DOI: 10.1149/1.1838615
322
8. Buck, W. R.; Leidheiser, H. The corrosion of single crystals and recrystallized single crystals of iron and
323
steel in citric acid. J. Electrochem. Soc. 1957, 104(8), 474-481. DOI: 10.1149/1.2428630.
324
9. Boggs, W. E.; Kachik, R. H.; Pellissier, G. E. The effects of crystallographic orientation and oxygen pressure
325
on the oxidation of iron. J. Electrochem. Soc. 1967, 114 (1), 32-39. DOI: 10.1149/1.2426502.
326
10. Fushimi, K.; Miyamoto, K.; Konno, H. Anisotropic corrosion of iron in pH 1 sulphuric acid. Electrochim.
327
Acta 2010, 55, 7322-7327. DOI:10.1016/j.electacta.2010.07.044 (24 July 2010).
328
11. Takabatake, Y.; Fushimi, K.; Nakanishi, T.; Hasegawa, Y. Grain-dependent passivation of iron in sulfuric
329
acid solution. J. Electrochem. Soc. 2014. 161(14), C594-C600. DOI: 10.1149/2.0901414jes.
330
12. . Wang, X.; Szpunar, J.A.; Zhang, L. Effect of surface crystallographic orientation on the oxidation behavior
331
of Ni-based alloy. Appl. Surf. Sci. 2015, 327, 532-536. http://dx.doi.org/10.1016/j.apsusc.2014.11.126 (3
332
December 2014).
333
13. Bland, L. G.; Gusieva, K.; Scully, J.R. Effect of crystallographic orientation on the corrosion of magnesium:
334
Comparison of film forming and bare crystal facets using electrochemical impedance and Raman
335
spectroscopy. Electrochim. Acta 2017, 227, 136-151. http://dx.doi.org/10.1016/j.electacta.2016.12.107 (21
336
December 2016).
337
14. Schreiber, A.; Schultze, J. W.; Lohrengel, M.M.; Kármán, F.; Kálmán, E. Grain dependent electrochemical
338
investigations on pure iron in acetate buffer pH 6.0. Electrochim. Acta 2006, 51, 2625-2630.
339
DOI:10.1016/j.electacta.2005.07.052.
340
15. Schreiber, A.; Rosenkranz, C.; Lohrengel, M. M. Grain-dependent anodic dissolution of iron. Electrochim.
341
Acta 2007, 52, 7738-7745. DOI:10.1016/j.electacta.2006.12.062.
342
16. Kyeong-Min, K.; Hyun-Kyu, K.; Park J. Y.; Lee, J. S.; Kim, S. G.; Kim, N. J.; Byeong-Joo, L. {100} texture
343
evolution in bcc Fe sheets - computational design and experiments. Acta Mater. 2016, 106, 106-116.
344
http://dx.doi.org/10.1016/j.actamat.2016.01.003 (21 January 2016).
345
17. Brewick, P. T.; Kota, N.; Lewis, A. C.; DeGiorgi, V. G.; Geltmacher, A. B.; Qidwai, S. M.
346
Microstructure-sensitive modeling of pitting corrosion: Effect of the crystallographic orientation. Corros.
347
Sci. 2017, 129, 54-69. http://dx.doi.org/10.1016/j.corsci.2017.09.009 (18 September 2017).
348
18. Brahim-Bounab, A.; Amaudrut, J. Y.; Tellier, C. R. Dissolution slowness surfaces of cubic crystals Part I. J.
349
Mater. Sci. 1991, 26, 5585-5594.
350
19. Dwivedi, D.; Lepkova, K.; Becker, T. Carbon steel corrosion: a review of key surface properties and
351
characterization methods. RSC Adv. 2017, 7, 4580-4610. DOI:10.1039/c6ra25094g (26 June 2018).
352
20. Arafin, M.A.; Szpunar, J.A. A Markov Chain–Monte Carlo model for intergranular stress corrosion crack
353
propagation in polycrystalline materials. Mat. Sci. Eng. A-Struct. 2009, 513-514, 254-266.
354
DOI:10.1016/j.msea.2009.01.072.
355
21. Arafin, M.A.; Szpunar, J.A. A new understanding of intergranular stress corrosion cracking resistance of
356
pipeline steel through grain boundary character and crystallographic texture studies. Corros. Sci. 2009, 51,
357
119-128. DOI:10.1016/j.corsci.2008.10.006 (14 October 2008).
358
22. Venegas, V.; Caleyo, F.; Baudin, T.; Espina-Hernandez, J. H.; Hallen, J. M. On the role of crystallographic
359
texture in mitigating hydrogen-induced cracking in pipeline steels. Corros. Sci. 2011, 53, 4204-4212.
360
23. Shahryari, A.; Szpunar, J. A.; Omanovic, S. The influence of crystallographic orientation distribution on
361
316LVM stainless steel pitting behavior. Corros. Sci. 2009, 51, 677-682. DOI:10.1016/j.corsci.2008.12.019 (27
362
December 2008).
363
24. Venegas, V.; Caleyo, F.; Vázquez, L. E.; Baudin, T.; Hallen, J. M. On the influence of crystallographic
364
texture on pitting corrosion in pipeline steels. Int. J. Electrochem. Sci. 2015, 10, 3539-3552.
365
25. Manh, T. L.; Caleyo, F.; Hallen, J.M.; Pérez-Benítez, J.A.; Espina-Hernández J.H. Novel method for the
366
accurate determination of magnetocrystalline energy from Barkhausen noise in ferromagnetic materials.
367
Mat. Sci. Eng. 2017, B 225, 98-107. http://dx.doi.org/10.1016/j.mseb.2017.08.015 (24 August 2017).
368
26. Pawlik, K. Determination of the orientation distribution function from pole figures in arbitrarily defined
369
27. Espina-Hernández, J.H.; Caleyo, F.; Venegas, V.; Hallen, J.M. Pitting corrosion in low carbon steel
371
influenced by remanent magnetization. Corros. Sci. 2011, 53, 3100-3107. DOI:10.1016/j.corsci.2011.05.044 (18
372
May 2011).
373
28. Taleb, A.; Stafiej, J. Numerical simulation of the effect of grain size on corrosion processes: Surface
374
roughness oscillation and cluster detachment. Corros. Sci. 2011, 53, 2508-2513.
375
DOI:10.1016/j.corsci.2011.04.008 (19 April 2011).
376
29. Blonski, P.; Kiejna, A. Structural, electronic, and magnetic properties of bcc iron surfaces. Surf. Sci. 2007,
377
601, 123-133.
378
30. Bunge, H. J.; Texture Analysis in Materials Science, Mathematical Methods, British Library Cataloguing in
379
Publication Data: Belin, Germany 1982, p.351-377;0-408-10642-5.
380
31. Raabe, D.; Lucke, K. Texture and microstructure of hot rolled steel. Scr. Mater. 1992, 26, 1221-1226.
381
32. Manh, T. L.; Caleyo, F.; Hallen, J.M.; Espina-Hernández, J.H.; Pérez-Benitez, J.A. Model for the correlation
382
between magnetocrystalline energy and Barkhausen noise in ferromagnetic materials. J. Magn. Magn.
383
Mater. 2018, 454, 155-164. https://doi.org/10.1016/j.jmmm.2018.01.066.
384
33. Manh, T. L.; Hallen, J.M.; Caleyo, F.; Sierra-Marquez, A.L. Electron backscatter diffraction helps direct
385
calculation of magnetocrystalline anisotropy energy in API 5L steels. Mater. Charact. 2018, 141, 86 -96.