University of South Carolina
Scholar Commons
Theses and Dissertations
2016
Physical Property Control In Core/Shell Inorganic
Nanostructures For Fluorescence And Magnetic
Targeting Applications
Stephen K. Roberts University of South Carolina
Follow this and additional works at:https://scholarcommons.sc.edu/etd
Part of theChemistry Commons
This Open Access Thesis is brought to you by Scholar Commons. It has been accepted for inclusion in Theses and Dissertations by an authorized administrator of Scholar Commons. For more information, please [email protected].
Recommended Citation
P
HYSICALP
ROPERTYC
ONTROL INC
ORE/S
HELLI
NORGANICN
ANOSTRUCTURES FORF
LUORESCENCE ANDM
AGNETICT
ARGETINGA
PPLICATIONSby
Stephen K. Roberts
Bachelor of Science Butler University, 2014
Submitted in Partial Fulfillment of the Requirements
For the Degree of Master of Science in
Chemistry
College of Arts and Sciences
University of South Carolina
2016
Accepted by:
Andrew B. Greytak, Director of Thesis
Richard D. Adams, Reader
DEDICATION
This thesis is dedicated to:
My parents, Rick and Jeannie Roberts
and
ACKNOWLEDGEMENTS
I would like to express my thanks and greatest appreciation to my advisor, Dr.
Andrew B. Greytak. He is an inspiration to a young scientist. His guidance, support, and
immense knowledge has been incredibly helpful during my studies.
I would also like to thank my committee chair, Dr. Richard Adams. He was
always willing to have useful discussions. I want to acknowledge my committee
members, Dr. Qian Wang and Dr. Thomas Crawford, for their advice during my studies. I
would also like to thank Yang Zheng for creating the particles used in the third chapter of
this work.
Without the members of the Greytak group, these projects would not have been
possible. Dr. Rui Tan provided a great amount of assistance and trained me on the
techniques used in the group. Adam Roberge was always willing to discuss any topic and
assist me. Dr. Yi Shen and Megan Gee provided fantastic feedback on many topics. Dr.
Pravin Paudel, Preecha Kittikhunnatham, Bobby Barker, Colin Johnson, and Abigail
Loszko were willing to help with any problem I encountered.
I must thank my parents, Rick and Jeannie Roberts. They have always supported
me and driven me to be my best. The knowledge they have provided has been invaluable
and I am eternally grateful for everything they have done for me.
Julia Gresik, my fiancée and best friend. Without her support and encouragement,
ABSTRACT
Nanomaterials show immense promise for the future in numerous areas of
application. Properties that are unique from the bulk material and are tunable allow for
innovation in material design. This thesis will focus on controlling the physical properties
of core/shell nanostructures to enhance the utility of the materials.
The first focus is on the impact of different solvent mixtures during the shell
growth phase of SILAR based core/shell quantum dot synthesis is studied. Gaining
insight into the mechanism for SILAR growth of core/shell nanoparticles allows
improved synthetic yields and precursor binding, providing enhanced control to synthesis
of core/shell nanoparticles. The second focus of this thesis is exploring the use of
magnetic nanoparticles for magnetic drug targeting for to reduce the negative impact of
cardiovascular conditions. Magnetic targeting for drug delivery enables increased local
drug concentration, while minimizing non-specific interactions. In order to be effective
for magnetic targeting, it must be shown that low magnetic strength is sufficient to
capture flowing nanoparticles. By demonstrating the binding of a therapeutic agent to the
surface at medicinal levels, the viability for use as a nanoparticle drug delivery system is
TABLE OF CONTENTS
DEDICATION ... iii
ACKNOWLEDGEMENTS ... iv
ABSTRACT ...v
LIST OF FIGURES ... viii
LIST OF ABBREVIATIONS ...x
CHAPTER 1:INTRODUCTION ...1
1.1INTRODUCTION TO QUANTUM DOTS ...1
1.2 INTRODUCTION TO MAGNETIC NANOPARTICLE TARGETING ...3
1.3THESIS OVERVIEW ...6
CHAPTER 2:REDUCING COMPETITION BY COORDINATING SOLVENT PROMOTES MORPHOLOGICAL CONTROL IN ALTERNATING LAYER GROWTH OF CDSE/CDSCORE/SHELL QUANTUM DOTS ...8
2.1INTRODUCTION ...8
2.2SHELL GROWTH AS MONITORED BY ABSORPTION AND EMISSION SPECTROSCOPY 10 2.3 CHARACTERIZATION OF THE PRESENCE/ABSENCE OF NUCLEATION BY PHOTOLUMINESCENCE EXCITATION SPECTROSCOPY ...12
2.4 AMINE INFLUENCE ON PARTICLE PHOTOLUMINESCENCE LIFETIME ...16
2.5STEM IMAGES OF CORE/SHELL NANOPARTICLES ...19
2.6CONCLUSION ...23
2.7EXPERIMENTAL SECTION ...23
3.1INTRODUCTION ...27
3.2IN VITRO MAGNETITE PARTICLE CAPTURE ...29
3.3BINDING TO SIO2 NANOPARTICLES ...32
3.4CONCLUSION ...38
3.5EXPERIMENTAL SECTION ...39
REFERENCES ...41
LIST OF FIGURES
Figure 2.1 Scaled absorption and emission spectra over the course of CdSe/CdS
core/shell QDs growth in three amines ...12
Figure 2.2 Photoluminescence excitation (PLE) scan at emission maximum for CdSe/CdS core/shell particles grown in three amines ...13
Figure 2.3 Comparison of (1-T) – PLE for CdSe/CdS core/shell particles grown in three amines ...16
Figure 2.4 Time-resolved PL monitored over the course of CdSe/CdS core/shell QDs growth in three amines ...17
Figure 2.5 STEM images and radius histograms for CdSe and CdSe/CdS core/shells grown in three amines ...20
Figure 2.6 High magnification STEM images for CdSe cores and CdSe/CdS core/shells grown in three amines ...22
Figure 3.1 Chemical structure of benzylpenicillin ...28
Figure 3.2 Fe3O4/SiO2/PMAA nanoparticle structure...29
Figure 3.3 Chemical structure of drug compound PD166793 ...29
Figure 3.4 Fe3O4/SiO2/PMAA SPIONs captured in 0.6 mm inner diameter tube at 4 mm/sec flow rate ...30
Figure 3.5 Absorption spectrum of 4 mm/s flow rate in 0.6 mm inner diameter tube ...30
Figure 3.6 Fe3O4/SiO2/PMAA SPIONs captured in 0.6 mm inner diameter tube at 20 mm/sec flow rate ...31
Figure 3.7 Absorption spectrum of 20 mm/s flow rate in 0.6 mm inner diameter tube....31
Figure 3.8 Absorption spectrum of 2.5 mg/mL Si NP with 12.5 µg/mL drug in PBS buffer. ...33
Figure 3.10 Absorption spectrum of 2.5 mg/mL Si NP with 12.5 µg/mL drug in DI H2O35
Figure 3.11 Absorption spectrum of 2.5 mg/mL Si NP with varied drug concentration in DI H2O ...36
Figure 3.12 Absorption spectrum of 5 mg/mL Si NP with varied drug concentration in DI H2O ...37
LIST OF ABBREVIATIONS
EED ... Excitation Energy Dependence
ML... Monolayer
MMP ... Matrix Metalloproteinase
MRI ... Magnetic Resonance Imaging
NC ... Nanocrystal
PL ... Photoluminescence
PLE ... Photoluminescence Excitation
PLQY ... Photoluminescence Quantum Yield
PMAA ... poly(methacrylic acid)
QD ... Quantum Dot
QY ... Quantum Yield
SILAR ... Selective Ionic Layer Adsorption and Reaction
SPION ...Superparamagnetic Iron Oxide Nanoparticle
STEM ... Scanning Transmission Electron Microscopy
CHAPTER
1
INTRODUCTION
1.1 Introduction to quantum dots
Quantum dots (QDs) are crystalline direct bandgap semiconductor nanoparticles,
which are typically roughly spherical in shape and have a diameter on the order of 1-10
nm. The QDs can display properties that are unique from the bulk material, including
quantum confinement in which the exciton Bohr radius is larger than all three crystal
dimensions.1 Quantum confinement of the excitons leads to desirable optical properties
that can be tuned for utilization in lighting applications, photovoltaics, and bioimaging.
Additionally, a higher bandgap semiconductor shell can be grown on the core, resulting
in a core/shell heterostructure with increased isolation of the core and enhanced stability.
When semiconductors absorb light, an electron is excited from the valence band
to the conduction band, creating a hole in the valence band. This electron-hole pair is
known as an exciton. The relaxation of the electron will then result in either radiative or
non-radiative recombination of the electron and hole. In radiative recombination, photons
are emitted with energies near the bandgap (Eg) of the material. In contrast to bulk
semiconductors, low dimensional materials, such as quantum dots, have discrete density
of states and can thus be tuned by altering the size of the material. The size dependence
of the bandgap absorption and emission makes these materials an attractive target for
development in a number of industries including QD-based light emitting diodes2,3 and
1.1.1 Synthesis of quantum dots
In order to take advantage of the size dependent nature of the QDs, the synthesis
method used must yield particles with a narrow size distribution and well-defined shape.
The hot-injection method is the most widely used and consists of four stages.6 The first
involves mixing the two metal precursors at high temperature. The second stage occurs
by quickly injecting chalcogenide precursors resulting in rapid nucleation. The third stage
occurs when the nucleation rate has slowed and homogeneous growth of the QDs occurs.
Finally, when the precursor concentration has decreased, small particles may dissolve and
be redeposited on larger particles, which is known as Ostwald ripening. This results in an
increased size distribution of particles. In order to prevent this process, the reaction
should be quenched, either through lowering the temperature of the reaction or by
introducing a protecting layer on the surface of the nanocrystals, prior to the ripening
beginning.
As a result of an unpassivated surface and trap states, the quantum yield (QY) of
core-only QDs is poor. Additionally, transference of an electron or a hole to a surface
trap state is believed to be responsible for intermittency of photoluminescence, known as
blinking, which poses a challenge to achieving reliable QYs.7 Remediation of this issue
can be achieved through the isotropic growth of shell material on the core,8 effectively
isolating the core from the surface trap states, reducing the wave function overlap with
the surface, and decreasing the likelihood for surface trapping of the carriers.9 Growth of
thicker shells reduce Auger recombination rates, increasing multiexciton lifetimes and
emissions, yielding a higher QY.10,11 The lattice mismatch between the core and shell
which results in degraded performance. Graded alloy shells12 and the use of materials
with low lattice mismatch13 have proven to be effective in minimizing defect density.
Two methods are commonly used for growth of a semiconductor material shell
over a quantum dot core. The first method employs simultaneous addition of the
precursors to form the shell. As the precursors used are highly reactive, this synthesis
method exhibits limited control over the particle shape and a broad size distribution. The
second method is selective ionic layer adsorption and reaction (SILAR). This method was
first introduced by the Peng group14 and has since been widely adopted. In contrast to
simultaneous addition, SILAR introduces one precursor per half-cycle, allowing
saturation of surface sites before the second precursor is introduced. The use of the
SILAR technique benefits from greater control over shell thickness by selecting the
number of addition cycles performed and decreased homogeneous nucleation events by
eliminating precursor side reactions.15
1.2 Introduction to magnetic nanoparticle targeting
Magnetic nanoparticles exist in the size regime of less than 100 nanometers and
have a high surface area to volume ratio.16 In order to obtain desired physical and
chemical properties in the particle, the core can be composed of numerous materials
including gold, cobalt, iron oxide, or cadmium selenide. The tunability of the core
material permits alteration and prioritization of properties, including size, shape,
magnetic characteristics, biocompatibility, and solubility, to provides improved particles
resonance imaging (MRI) contrast imaging,18 magnetic hyperthermia,19 magnetic drug
delivery,20–22 and data storage.23
While magnetic nanoparticles come in many combinations of materials,
ferrimagnetic iron oxides, particularly magnetite (Fe3O4) and maghemite (γ-Fe2O3), are a
popular core material for biomedical studies. One attractive property of iron oxide
nanoparticles used for bioapplications is superparamagnetism, resulting in the particles
often being referred to as superparamagnetic iron oxide nanoparticles (SPIONs).
Superparamagnetism is typically exhibited in iron oxide particles smaller than 30 nm in
diameter, allowing the magnetic moments to be flipped randomly by thermal energy, and
resulting in paramagnetic nature only when a local magnetic field is applied to the
nanoparticles.16 This selective property leads a lower probability of aggregation of the
nanoparticles in the bloodstream, as there is no remanent magnetism when a magnetic
field is not actively being applied. As a softer magnetic material, iron oxide can also be
magnetized or demagnetized with lower magnetic fields than what is required for harder
magnetic materials. SPIONs possess a favorable toxicity profile, high magnetic
susceptibility, and relatively high magnetic saturation, making them favorably suited for
in vivo studies.16
1.2.1 Nanoparticle synthesis
The most widely used techniques for synthesis of magnetic nanoparticle include
microemulsion, thermal decomposition, and coprecipitation techniques. Microemulsion
syntheses can produce monodisperse particles, but typically have low yields, although
preparations are energy-intensive and require organic solvents, necessitating further
processing to be made biocompatible.25 Coprecipitation methods are typically performed
in aqueous solution at room temperature, which results in increased size distribution and
low crystallinity.26 It is necessary for the synthesis to produce consistent nanoparticles,
particularly with respect to SPIONs, as a wide distribution of particle size could lead to
varied forms of magnetism amongst nanoparticles resulting in undesired magnetic
characteristics. The most popular preparation method is a thermal technique developed by
Hyeon et al. that is highly versatile and can form monodisperse nanocrystals in large
quantities using inexpensive, non-toxic reactants.27
1.2.2 Nanoparticle surface
While the core material provides base functionality, coating the core with shell
material, which can be performed in-situ or after synthesis, reduces aggregation of
particles and can be used to enhance the functionality of the nanoparticles. Shell materials
such as dextran, poly(ethylene glycol) (PEG), and silica are used to increase stability and
introduce hydrophilicity to the particle, yielding increased solubility and enhanced
biocompatibility.28 Zwitterionic ligands bound to the core have also been shown to create
suitably hydrophilic nanoparticles, while retaining the necessary magnetic properties. 29
The shell also plays an important role in biodistribution and how quickly the
nanoparticles are cleared from the body. If the shell increases the hydrodynamic size of
the nanoparticles above a threshold, the particles will be cleared more quickly through
biological processes, reducing the availability of particles for the desired applications,
Utilizing the characteristics from the core and shell, the nanoparticles can
passively target an area for drug or MRI contrast agent delivery, employ ligands to attach
to biological targets, or be used in magnetic targeting to concentrate the nanoparticles in a
desired zone for drug release.31,32 In order for nanoparticles that are injected into the
blood stream to be effective for magnetic targeting, enough force must be exerted from a
magnetic field gradient to overcome the effects of blood flow and pull the nanoparticles
to the area of interest.33 If the magnetic force is not sufficient to capture the SPIONs, they
will continue in the bloodstream and be eliminated through non-specific pathways before
they can accumulate at their targets.
1.3 Thesis overview
Chapter 2 is focused on understanding the effect of the solvent mixture on the
growth of core/shell quantum dots using the SILAR technique. The inclusion of three
different amines in the growth solvent is explored. The tertiary amine shows weaker
association to the nanoparticle surface compared to the primary and secondary amines.
Therefore, due to competition with precursors, use of tertiary amines during QD growth
can increase the quality of the core/shell QDs.
The feasibility of iron oxide nanoparticles for use as a magnetically targeted drug
delivery system is explored in Chapter 3. In vitro particle capture trials are performed via
flow field fractionation on preliminary magnetic iron oxide nanoparticles to show the
viability of capture by a readily-available magnet without the need for specialty high
strength magnets. SiO2 nanoparticles coated with poly(methacrylic acid) (PMAA) ligands
(MMPI) compound to be adsorbed to a functionalized nanoparticle surface. UV-Vis
spectroscopy, in conjunction with centrifugation, is performed to determine the amount
CHAPTER 2
REDUCING COMPETITION BY COORDINATING SOLVENT
PROMOTES MORPHOLOGICAL CONTROL IN ALTERNATING
LAYER GROWTH OF CDSE/CDS CORE/SHELL QUANTUM DOTS*
2.1 Introduction
The formation of core/shell structures in colloidal semiconductor nanocrystals is
important in maintaining the spectroscopic properties of colloidal quantum dots (QDs)
and defining new functions. When using selective ionic layer adsorption and reaction
(SILAR)-based techniques, conversion of shell precursors to surface-adsorbed
equivalents should be maximized for effective control of shell growth. Our group has
previously demonstrated that the commonly used cadmium precursor Cd(oleate)2 has low
conversion yield when added in monolayer-equivalent quantities during the growth of
CdSe/CdS core/shell QDs via the SILAR technique.34 The growth solvent could
potentially play an important role in governing precursor conversion.
Primary amines have been typically been used as the coordinating solvent for
nanoparticle growth, with oleylamine commonly used for CdSe QDs growth by
SILAR.15,34 The role of the primary amine during growth has been well studied, yet
contradictions have arisen between conclusions, as summarized by Garcia-Rodriguez et
al.35 Switching to secondary amines for CdS shell growth on CdSe cores has been
reported to improve synthetic yield36,37, while secondary and tertiary amines have shown
improved size distribution during CdSe core growth.38 One possible mechanism is that
the reactivity of the Cd precursor was reduced due to the strong coordination of the
primary amine. Liu’s and Vela’s groups have suggested35,37 that primary amines such as
oleylamine may stabilize Cd(oleate)2 in solution through the formation of six-coordinate
complexes. Solution-phase complexes could be sterically restricted in the case of
secondary or tertiary amines.37 However, it is also known that amines can improve the
fluorescence quantum yield by coordination to the nanocrystal surface, and it is possible
that such surface coordination is competing with precursor conversion.39–41
In this work, we grew CdSe/CdS core/shell quantum dots in solvent mixtures with
three different representative amines -- primary, secondary, and tertiary -- via a SILAR
technique. We selected oleylamine (OAM), dioctylamine (DOM), and trihexylamine
(THM) for our studies. The three amines were chosen to (1) represent
primary/secondary/tertiary amines, and (2) have similar molecular weight and molar
volume, so that similar amine:QD ratios (∼50 000:1) could be achieved at similar QD
concentrations. The course of the growth was monitored by UV−visible absorption and
photoluminescence (PL) emission spectroscopy. Emission peaks at wavelengths shorter
than the effective band gap (“blue peaks”) appeared in the PL spectrum when QDs were
grown in primary amine, suggesting nucleation of small CdS particles as a result of
cross-reaction of the shell precursors as seen previously, and such nucleation was suppressed
and no CdS particles were present in the QDs grown in tertiary amine. Time-correlated
increased rate dispersion in samples prepared with secondary and tertiary amines, when
compared to oleylamine. This finding indicates a difference in interactions/passivation
between the different amines and the QD surface. Scanning transmission electron
microscopy (STEM) proved the yield of the shell was highest when using the tertiary
amine (trihexylamine) as the growth solvent. We demonstrated that the interaction
between the solvent molecules and the nanoparticle surface is an issue influencing shell
growth by SILAR, because the shell precursor must compete with such interactions to
saturate the surface prior to introduction of the complementary precursor for growth of
the shell compound.
2.2 Shell growth as monitored by absorption and emission spectroscopy
During the course of the growth, aliquots with a consistent volume of 50 ± 5 μL
were drawn and diluted in 2.0 ± 0.2 mL of hexane for monitoring by absorption and PL
spectroscopy. This method resulted in diluted samples with <25% error in concentration.
The nominal concentration of core/shell particles in each aliquot can be calculated on the
basis of the quantity of cores introduced at the start of the reaction; the nominal
concentration decreases over the course of shell growth due to the increase in total
volume as shell precursor solutions are introduced. The band-edge absorbance peak of all
aliquots remained less than 0.1 AU such that little fluorescence light is reabsorbed when
the samples are excited. Absorption and PL spectra of core/shell particles grown in the
three amines are shown in Figure 2.1. To facilitate comparison, the absorption and PL
spectra of successive aliquots have been scaled to compensate for the difference in
values plotted should be representative of the signals seen at the same QD concentration
(0.42 μM), with a scaling error of less than 25%. In all three shell growth experiments,
the absorption spectra indicate a red shift in the lowest-energy (1S) exciton resonance
observed with increasing shell thickness, accompanied by an increase in the height of the
scaled 1S absorbance. An increase in the 1S molar extinction coefficient with increasing
size of CdSe QDs has been described and modeled by Jasieniak et al.42 The trend for the
same model applied to the evolution of the 1S absorbance in the CdSe/CdS core/shell
particles is indicated by the black curves in Figure 2.1A−C, with 25% error indicated by
dashed lines.
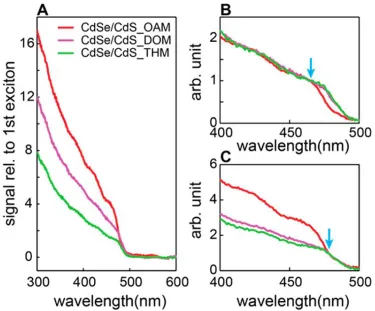
Figure 2.1D−F shows that in all three growths, the PL emission intensity of
CdSe/CdS core/shell particles continuously increased with increasing CdS shell
thickness. This is a result of an increasing quantum yield as well as an increasing
excitation rate at the same concentration due to enhanced absorption at short wavelengths
because of the CdS shell.
Despite superficially similar absorption spectra and band-edge PL spectra among
the three samples, a close examination of the emission spectra reveals a PL peak
appearing between 400 and 500 nm (“blue peak”) that is present in the oleylamine case
(Figure 2.1D), greatly diminished (∼50× less intense) with dioctylamine, and nearly
absent with trihexylamine. The blue peaks are absent prior to introduction of shell
precursors, are centered at wavelengths shorter than the emission of the CdSe cores used,
and shift to longer wavelengths as additional shell precursors are introduced. These
characteristics are all consistent with the appearance of a CdS nanoparticle side product.
CdSe/CdS core/shell QDs via the SILAR technique under 1 ML equivalent dose per
cycle.34 The wavelengths of the blue peaks fall within the range of emissions for CdS
nanoparticles with diameters of 3.5−4.5 nm.43,44
Figure 2.1 Scaled absorption and emission spectra over the course of CdSe/CdS core/shell QDs growth in three amines. (A,D) CdSe/CdS_OAM grown in oleylamine; (B,E) CdSe/CdS_DOM grown in dioctylamine; (C,F) CdSe/CdS_THM grown in trihexylamine. Absorptions and emissions are normalized to the concentration of QDs in each aliquot, so that all of the absorption and emission represent the absorption and intensity of the same amount of QDs; the dashed lines represent the upper and lower bands of 25% error for the QD concentration in each aliquot. The insets zoomed in the region of emission where “blue peaks” appeared for CdSe/CdS_OAM and
CdSe/CdS_DOM, and no “blue peaks” in CdSe/ CdS_THM. Copyright 2015 American Chemical Society.
2.3 Characterization of the Presence/Absence of Nucleation by Photoluminescence Excitation Spectroscopy
We conducted photoluminescence excitation (PLE) scans on all three core/shell
samples to characterize the contribution of CdS nanoparticle nucleation to the observed
rapidly thermalize to the band-edge exciton states, the PLE spectrum nominally contains
the same information as the absorption spectrum. However, disconnected particles of the
shell material as well as hot-carrier recombination processes will lead to a diminished
PLE spectrum as compared to the absorption spectrum. Technically, the PLE signal
should be compared to the number of photons absorbed by the sample at each
wavelength, which is proportional to 1 − T where T is the optical transmittance.45 The
absorbance A = −log(T) is described accurately by 1 – T (within 10%) only when A <
0.1. To further minimize light attenuation considerations,46 the samples were diluted by
hexane so that in all cases the absorbance was <0.2 at wavelengths longer than 300 nm.45
In Figure 2.2A−C, the excitation wavelength was scanned from 300 to 640 nm,
which covers the absorption range for typical CdS and CdSe nanoparticles, while the
emission wavelength was set at the band-edge PL emission maximum (PLE@600 nm).
At long wavelengths close to the band edge, the PLE line shape matches 1 − T closely as
expected for the simple picture of a QD with energy-independent QY. Consequently, it is
possible to scale the 1 − T and PLE signals such that they are superimposed in this region
(Figure 2.2A−C, insets, with the lowest-energy exciton peak set at 1 on the vertical
scale), so that differences at higher energies (shorter wavelengths) can be examined. For
comparison, the raw absorbance signal A is plotted as well. At shorter wavelengths, the
normalized 1 − T signal greatly exceeds the PLE trace in all samples, indicating a lower
ensemble QY for excitation at high energies. Comparing the three samples, it is clear that
in the low wavelength region (300−500 nm), the absorbance and 1 – T are the largest for
CdSe/CdS_OAM, then CdSe/CdS_DOM, with CdSe/CdS_THM showing the lowest
values, while PLEs@600 nm showed negligible differences. These results suggest that
the additional absorbance seen in CdSe/CdS_OAM at shorter wavelengths does not
contribute to band-edge emission. We propose that the additional absorbance in
CdSe/CdS_OAM is contributed by the CdS nanoparticles that are responsible for blue
emission peaks in the PL spectra. PLE scans with the emission wavelength set to 478 nm
(PLE@478 nm, Figure 2.2D,E) showed a substantial signal from 300 to 480 nm for
CdSe/CdS_OAM (Figure 2.2D) that was absent for CdSe/CdS_DOM and
CdSe/CdS_THM. This signal displayed peaks (blue arrows in Figure 2.2D) resembling
confinement. The above observations are consistent with the optical properties expected
for CdS nanoparticles.
Additional insight on the behavior of the samples under excitation at low
wavelengths can be gained by subtracting the normalized PLE@600 nm spectrum from
normalized 1 − T. The difference represents photons being absorbed by the sample that
do not lead to emission at 600 nm. The difference signals are overlaid in Figure 2.3A on
a scale relative to the PLE signal at the lowest energy exciton that allows the values for
the three samples to be directly compared. In all cases, a large difference signal grows in
at wavelengths <500 nm. There are two possible contributions to the difference signals
shown: first, inefficient relaxation of delocalized, higher-energy excited states to the
band-edge exciton localized at the QD core; and second, photon absorption by detached
CdS nanoparticles. The latter of these contributions should mimic the absorption
spectrum of CdS QDs. Figure 2.3B shows that the profile of the 1 – T difference
spectrum for CdSe/CdS_OAM differs from that of the other two. If the spectra are
normalized at a wavelength near the onset of the excess 1 − T signal (Figure 2.3C), it is
clear that the CdSe/CdS_OAM sample displays an additional contribution at shorter
wavelengths with excitonic features that closely resemble what is expected for CdS
QDs.43,44 The remaining contribution that is common to all samples (although differing in
amplitude) could be evidence of a rapid nonradiative trapping pathway for hot carriers.
Providing excitation energy above the band gap results in a higher likelihood of accessing
nonemissive trap states, resulting in a reduced quantum yield. Excitation energy
dependence (EED) in CdSe and core/shell QDs has been observed previously.47–49
studies. Additional understanding of EED could provide insight into improved
methodology.
Figure 2.3 (A) Comparison of (1 − T) − PLE for 600 nm emission for CdSe/CdS core/shell particles grown in the three amines. (B) Curves in (A) normalized at the first peak of sample CdSe/CdS_OAM (blue arrow). (C) Curves in (A) normalized close to the signal onset (blue arrow). Copyright 2015 American Chemical Society.
2.4 Amine influence on particle photoluminescence lifetime
We recorded time-resolved PL traces of aliquots drawn over the course of shell
growth in the three amine solvents to characterize the average decay rate and decay rate
dispersion in the samples. The amine solvent can act as a ligand for the QD surface and
as such could inhibit the binding of shell growth precursors, in particular Cd(oleate)2. We
have shown previously that association of oleylamine to the surface of purified CdSe/CdS
decreases rate dispersion.39 Comparison of the PL decay traces of CdSe QDs and
core/shell QDs in the presence of the three amine solvents could thus serve as a proxy
measurement for ligand interactions with the QD surface that influence growth.
Additionally, as shell growth proceeds, the solvent may modulate polydispersity and/or
the formation of crystal defects during shell growth, which would affect radiative and
nonradiative decay rates, respectively.
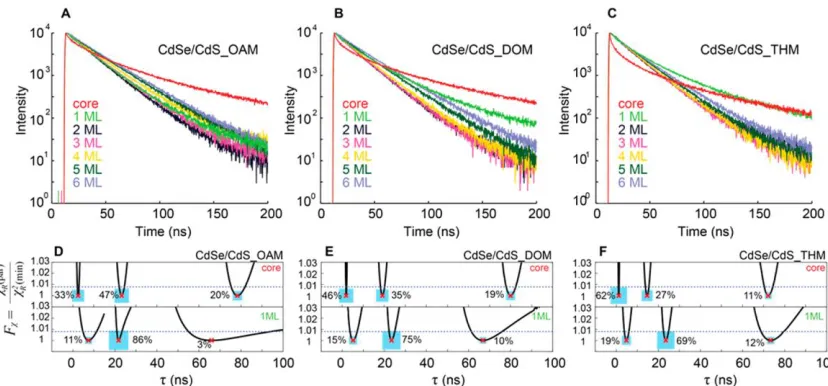
Figure 2.4 (A−C) Time-resolved PL monitored over the course of CdSe/CdS core/shell QDs growth in three amines. (D−F) Distribution of lifetimes for cores (top) and core/shell particles with 1 ML equivalent shell (bottom) in three amines, as well as the relative amplitudes for each exponential component (blue squares, area represents wt Ai for the
ith component). Support plane analysis is applied to determine the uncertainties in the lifetimes of each fit component. Blue dashed line indicates 90% confidence limit for F statistic. Copyright 2015 American Chemical Society.
Figure 2.4A−C shows the PL decays for each sample just prior to introduction of
shell precursors and after each successive complete ML equivalent of growth. To isolate
the influence of the amine solvents as ligands on the luminescence kinetics, we can focus
on the traces for the cores (red traces). After being heated in the shell growth solvent, but
showed multiexponential decays. For quantitative analysis of lifetimes and decay rate
dispersion, experimental curves were fit with a sum of exponential components
reconvoluted with the instrument response function. At least three exponential
components were required for a reasonably good fit (𝜒𝑅2 < 1.5). In each case, three
component fits returned an intermediate lifetime component (τ2) on the order of the
radiative lifetime, a short-lifetime component (τ1), and a long lifetime component (τ3) that
is likely associated with a trapping/detrapping mechanism.50 To characterize the
uncertainty in the lifetime values, we examined how 𝜒𝑅2 changes when one parameter is
varied and the others are reoptimized, also called support plane analysis51 (Figure
2.4D−F). For each decay, we found the lifetimes to be well separated from each other at a
90% confidence limit. The shorter average lifetimes for dioctylamine and trihexylamine
samples are driven both by a shift in τ1 and τ2 to smaller values and by a shift in
amplitude toward the short-lifetime component (Figure 2.4D−F, top), indicative of a
larger fraction of the ensemble residing in a state with a large nonradiative decay rate.
These observations are consistent with a stronger binding interaction of oleylamine with
the QD surface, resulting in better electronic passivation of the QD surface, but also
potentially interfering with precursor conversion during shell growth.
For further core/shell growth in all three amines, the relative amplitude for
short-lifetime (wt A1) and long-lifetime (wt A3) components continuously decreased, while the
relative amplitude for the intermediate component (wt A2) increased greatly only after 1
ML (Figure 2.4D−F, bottom). For CdSe/CdS_OAM, the short lifetime component was
completely eliminated after 2 ML of shell. The amplitude average lifetimes kept
decay). For CdSe/CdS_DOM, the short lifetime component disappeared after 4 ML of
shell, with the amplitude average lifetimes increasing from 19.36 to 26.53 ns. However,
for CdSe/CdS_THM, the short lifetime component existed even after 6 ML of shell
growth, and the amplitude average lifetimes remained at 20−23 ns over the course of the
growth. This difference in average lifetime at the conclusion of 6 ML is primarily
associated with the larger amplitude and smaller lifetime value of the τ1 component; the
value of τ2 is nearly identical across the three samples.
Shell growth introduces an electronic barrier (at least for holes) between the core
and surface. In our shell growth method, TOP is a component of the shell precursor
solution; TOP binds exothermically to the QD surface and is known to strongly
regenerate QY in purified samples.39 Nonetheless, the difference in average lifetime and
rate dispersion among the three amine solvents persists through 6 ML of shell growth,
suggesting that effects of ligand occupation of the surface on precursor conversion may
likewise persist through the course of shell growth in the presence of TOP.
2.5 STEM images of core/shell nanoparticles
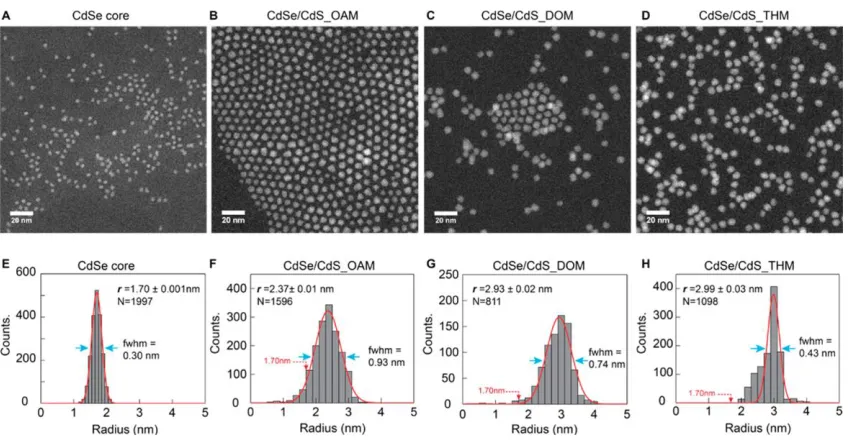
Figure 2.5 shows the STEM images and radius distribution histograms for CdSe
cores as well as the three core/shell products. The radius histograms are determined by
analysis of STEM images of the same magnification at 6−7 randomly selected regions; N
is the number of particles analyzed. In comparing STEM images of Figure 2.5A-D and
the radius histograms of Figure 2.5E−H, the differences in particle sizes and
distributions are clearly displayed. We characterize the average radius and peak radius for
particles), while the peak radius is the center of a Gaussian fit (red curve, Figure
2.5E−H) to the distribution and represents a characteristic radius for core/shell particles
in the sample.
Figure 2.5 STEM images and radius histograms for CdSe cores (A,E) and core/shell samples CdSe/CdS_OAM (B,F), CdSe/CdS_DOM (C,G), and CdSe/CdS_THM (D,H). The histograms are fitted by Gaussian functions (red curves, E−H) to determine the peak radius; the fwhm is indicated by blue arrows. Copyright 2015 American Chemical Society.
A majority of particles in the core/shell samples showed a radius larger than that
of the cores and commensurate with shell growth; however, CdSe/CdS_DOM (Figure
2.5C) and CdSe/CdS_THM (Figure 2.5D) showed larger average and peak radius as
compared to CdSe/CdS_OAM (Figure 2.5B). Additionally, both CdSe/CdS_DOM and
CdSe/CdS_THM showed narrower size distributions and showed particles with more
uniform shapes. Inspection of the STEM images reveals the presence of a significant
number of particles smaller than the CdSe cores in CdSe/CdS_OAM. Although the
smaller average radius in this sample. The peak radius primarily describes the core/shell
product; it is the smallest in CdSe/CdS_OAM as well, indicative of thinner CdS shells
due to loss of material to the side product. At the same time, the distribution of radius for
CdSe/CdS_OAM (fwhm = 0.93 nm) is broader than that for CdSe/CdS_DOM (fwhm =
0.74 nm) and CdSe/CdS_THM (fwhm = 0.43 nm). Core/shell particles growing in
trihexylamine maintained a very narrow size distribution, nearly as good as the cores
(fwhm = 0.30 nm), although a small fraction of particles with radius down to 2.5 nm
(Figure 2.5H) remained present.
The STEM results confirm that the more highly substituted amines dioctylamine
and especially trihexylamine were effective in suppressing the nucleation of small
particles during shell growth, and the observation of small particles in the CdSe/
CdS_OAM and CdSe/CdS_DOM samples corroborates the assignment of the blue PL
peaks as radiative recombination from CdS nanoparticles. Examination of the shapes of
nanocrystals in the three core/shell samples appears to show greater roundness in
CdSe/CdS_DOM and CdSe/CdS_THM, suggesting that conditions that suppress
nucleation also help to enforce isotropic shell growth. High magnification STEM images
in Figure 2.6 reveals the greater roundness observed in highly substituted amines
Figure 2.6 High magnificationSTEM images for CdSe cores, and for CdSe/CdS_OAM,
CdSe/CdS_DOM, and CdSe/CdS_THM. Panels E,F reveal particles in
2.6 Conclusion
We have confirmed that replacing oleylamine with a secondary amine,
dioctylamine, suppresses nucleation and improves core/shell growth, and we have shown
that moving to a tertiary amine, trihexylamine, is even more effective. The use of
time-resolved PL has shown that more highly substituted amines bind less strongly to the
surface of CdSe QDs, permitting a greater precursor conversion. We can also conclude
that oleylamine effectively competes with the precursor Cd(oleate)2 for occupation of
nanocrystal surface sites, leading to a significant amount of cross-reaction and nucleation
of CdS particles during CdS shell growth by SILAR.
2.7 Experimental Section
Materials: The following chemicals were used as received. Cadmium oxide
(CdO; 99.999%), trioctylphosphine (TOP; 97%), and trioctylphosphine oxide (TOPO;
99%) were purchased from Strem Chemicals. Oleic acid (OA; 99%), 1-octadecene (ODE;
90% technical grade), 1-tetradecylphosphonic acid (TDPA; 98%), and Se (99.999%)
were purchased from Alfa Aesar. Di-n-octylamine, 98% (LOT:10178704) and
Tri-n-hexylamine, 97% (LOT:G18S028) are purchased from Alfa Aesar. Decylamine (95%)
was purchased from Sigma Aldrich. Oleylamine (80-90%) and bis(trimethylsilyl) sulfide
((TMS)2S; 95%) were purchased from Acros Organics. 200 proof ethyl alcohol (ethanol)
was obtained from Decon Laboratories, Inc. Acetone (99.9%) was purchased from VWR.
Ethanol (99.9%) was purchased from Fisher Scientific. TOPSe (2.2 M) was prepared by
dissolving Se in TOP. A stock solution of Cd(oleate)2 (0.2 M) in ODE was prepared by
followed by degassing under vacuum at 100 °C for 20 min. The sulfur precursor was
0.1 M solution of (TMS)2S dissolved in TOP. Nanocrystal core and shell growth was
carried out under nitrogen (N2) using Schlenk line techniques; air-sensitive reagents were
prepared in a nitrogen filled glovebox.
Optical Spectroscopy: The optical absorption spectrum was recorded using a
Thermo Scientific Evolution Array UV−visible spectrophotometer with hexane as the
solvent as well as the blank in a 1 cm path quartz cuvette. Routine emission spectra were
recorded by an Ocean Optics USB 4000 spectrometer under ∼365 nm excitation.
Synthesis of CdSe Cores: A hot-injection technique was applied for synthesis of
CdSe nanocrystals (NCs) cores.52 For a representative synthetic route, CdO (0.12 g) was
heated with TDPA (0.5500 g) at 330°C in a solvent TOP (6 ml) and TOPO (6 g) under
nitrogen flow until the solution became colorless. Following removal of evolved H2O
under vacuum at 130°C, the solution was heated again to 360°C under nitrogen.
As-prepared TOPSe (1.3 mL) was injected rapidly into the reaction pot, which was
immediately allowed to cool down to room temperature and stored as a yellow waxy
solid. The Cd:TDPA:Se molar ratio is 1:2:3. The core radius was estimated by a
calibration curve52,53 describing the radius as a function of the position of the
lowest-energy absorption peak. One batch of cores provided sufficient material for several
core/shell growth experiments; all core/shell particles were made based on the CdSe QD
cores taken from the same batch.
Synthesis of Core/Shell Nanoparticles in Different Amines: The method for
CdSe/CdS core/shell particle growth was modified from our previous work.34,52 The
trihexylamine) in the solvent mixture. The Cd precursor was prepared by diluting
Cd(oleate)2 stock solution in a solvent of 50:50 ODE and TOP with two equivalents of
the same amine in the solvent mixture (vs. Cd) added to yield a Cd concentration of
0.1 M.; The sulfur precursor was 0.1 M solution of (TMS)2S dissolved in TOP. The CdS
shell was grown by alternatively introducing Cd & sulfur precursors into the reaction
flask, 1 ML eq. of precursors added per cycle, and forming 6 ML of CdS shell in total
after six cycles. Reaction progress was monitored by periodically withdrawing a small
aliquot of a measured volume (typically 50 μL) from the reaction flask and diluting it in
hexanes at room temperature; these aliquots were analyzed for UV-vis absorption and
fluorescence emission in hexanes solution.
Time-Resolved Photoluminescence Measurement: The PL decays of QDs in
hexane were collected in front-face mode with 1 cm quartz cuvette in a lifetime
spectrometer (Edinburgh Mini-τ) equipped with a 368 nm
picosecond-pulsed-light-emitting diode. A stirring stage was set under the Mini-τ, and a mini stir bar was placed
in the cuvette to stir the QD solution to avoid accumulation of photoproducts during the
measurement. The instrument response function (IRF) is recorded using Rayleigh
scattering of pure water.
Scanning Transmission Electron Microscopy Imaging: After purification, the
CdSe or CdSe/CdS core/shell QDs were brought into hexane to form a dilute solution
(1.1 μM), one drop of the solution was drop-casted on a clean TEM grid (400 mesh Cu
grid with ultrathin carbon support film, Type-A, Ted Pella, Inc.) and pumped dry under
vacuum for 2 hours. The STEM samples were imaged by JEOL 2100F 200 kV
high magnification observation, a large specimen area was pre-irradiated with electrons
for 10 minutes to polymerize surface hydrocarbons and therefore prevent their diffusion
to the focused probe. High angle annular dark-field (HAADF) STEM images were
CHAPTER 3
MAGNETIC NANOPARTICLE TARGETING
3.1Introduction
Nanomaterials for biomedical use have been increasingly explored in recent
years, due to their promise for superior therapeutic results. Specifically, magnetic
nanoparticles have been explored in a medical context for numerous applications,
including for magnetic drug targeting in cancerous tumors.17 Yet despite hundreds of
thousands of Americans suffering myocardial infarctions (heart attacks) every year, the
focus of these research efforts has largely been placed on other medical issues.
By concentrating on effective cardiovascular delivery methods, improved
treatment can be achieved for those afflicted with cardiovascular maladies. Therapeutic
agents have been identified for these conditions, but adverse effects and inability to reach
effective local dosage has resulted in a lack of options for treatment. The creation of
nanoparticles that enable the binding of pharmacological agents to the surface, coupled
with retention of the magnetic properties, would be a boon to the current issue plaguing
potential treatments. Medicine-laden magnetic nanoparticles could be administered
intravenously, concentrated in the effected region via a local magnetic field, allowing the
payload to be released and creating an area of increased dosage, thereby reducing the
amount of free drug required to have a beneficial effect while limiting the adverse effects
The Benicewicz group has previously developed a method to utilizing reversible
addition fragmentation chain transfer (RAFT) polymerization of methacrylic acid on the
surface of Fe3O4/SiO2 nanoparticles.54 Benzylpenicillin, Figure 3.1, was then physically
bound to the surface of the grafted nanoparticles and disk diffusion assays demonstrated
an increased anti-bacterial response, due to an increased localized concentration of
benzylpenicillin. Using the surface preparation established the aforementioned work, we
explored the binding of a representative medicinal compound to nanoparticles.
In this work, we demonstrated that capture of magnetite nanoparticles as prepared
by the Benicewicz group (Figure 3.2) is possible in vitro under biological flow
conditions. As the nanoparticles have a shell and additional ligands on the surface, it is
important to verify that the particles retained their superparamagnetic nature and that a
relatively low magnetic strength was sufficient for capture of the particles. Exploration of
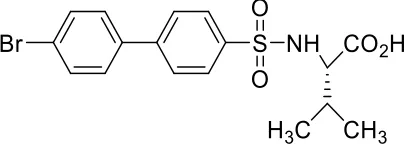
the adsorption of a representative drug (Figure 3.3) compound to the nanoparticle in
buffered solutions, as well as DI H2O, was performed and monitored using UV-visible
absorption spectroscopy.
Figure 3.2 Fe3O4/SiO2/PMAA nanoparticle structure
Figure 3.3 Chemical structure of drug compound PD166793.
3.2In Vitro Magnetite Particle Capture
Preliminary experiments have been performed on magnetite (Fe3O4) nanoparticles
with a shell of SiO2 and grafted with poly(methacrylic acid) (PMAA). To test initial
feasibility of nanoparticle capture by a magnetic field, a magnet was placed on the
surface of plastic tubing and a solution of nanoparticles in water was flowed through the
tube using an automated syringe pump, a method which has previously been used to test
captured by the magnet, an amount of solution was first flowed with no magnet being
present and the solution was captured for analysis. The same amount of solution was
again flowed, but with a magnet placed against the surface of the tube to capture the
nanoparticles, and the solution was captured. The magnet was then removed from the
surface of the tube and the final portion was flowed and captured, which should contain
the initial concentration of particles in the solution in addition to the particles that had
previously been captured in the tube. The captured aliquots were analyzed using UV/Vis
spectroscopy.
Figure 3.4 Fe3O4/SiO2/PMAA SPIONs captured in 0.6 mm inner diameter tube at 4 mm/sec flow rate.
Figure 3.6 Fe3O4/SiO2/PMAA SPIONs captured in 0.6 mm inner diameter tube at 20 mm/sec flow rate.
Figure 3.7 Absorption spectrum of 20 mm/s flow rate in 0.6 mm inner diameter tube.
Analysis of the UV-Vis spectrum (Figure 3.5) for the 4 mm/s at 50 µg iron
oxide/mL trial revealed a 17.7% increase in signal at 350 nm between the first run of the
solution with no magnet present and the third run. The increase was expected due to the
additional particles that should be present in the solution. However, for the 20 mm/s flow
rate at 50 µg of iron oxide/mL, the spectrum (Figure 3.7) showed a decrease from the
initial run to the third run, even though captured particles were visibly evident (Figures
3.4 and 3.6) in the tube during the experiment. These inconsistent results indicate that
3.3Binding to SiO2 Nanoparticles
In order to test the feasibility of binding for the representative MMP inhibitor,
PD166793, analogous silica nanoparticles coated with PMAA were used in place of
magnetic nanoparticles. The binding trials were run in various solutions to explore the
effect of pH and salt concentration on the ability to bind. Detailed procedures are
described in the experimental section. Figure 3.8 and Figure 3.9 show that the drug does
not bind in 50% PBS or acetate buffers, respectively. Figure 3.10 shows peaks after
centrifugation in DI water that appear around 273 nm, indicating that drug compound is
present in the retentate and presumably bound to the silica nanoparticles.
By varying the nominal drug concentration, as shown in Figure 3.11, we were
able to examine if the amount of drug was limiting the signal being seen in the absorption
spectra, as well as if drug binding would scale as the amount of available drug increased
while holding the concentration of particles consistent. Figure 3.12 has the same
variation in drug concentration, but double the nominal nanoparticle concentration. As
the drug concentration is increased, the ratio of the amount of bound drug vs. the total
amount of drug available increases indicating that the drug appears to bind more
effectively at higher concentrations. However, the bound drug per nominal nanoparticle
Figure 3.12 Absorption spectrum of 5 mg/mL Si NP with varied drug concentration in DI H2O.
We have seen that the drug compound PD166793 is fluorescent, as shown in
Figure 3.13. The ability to use fluorescent anisotropy would allow us to better observe
the extent of drug binding to the nanoparticles, while providing insight into the binding
kinetics occurring, as it could indicate a dynamic binding equilibrium in which the drug
dissociates within the timescale of the centrifugation, when the free drug concentration is
reduced. By binding to the nanoparticles, the anisotropy value should increase due to the
Figure 3.13 Fluorescence spectrum of PD166793 with peak at 330 nm.
3.4Conclusion
Through flow field fractionation, we have shown that we are able to capture the
nanoparticles in conditions similar to biological applications. While the capture was
visibly evident within the tubes, a technique other than absorption spectroscopy might
prove beneficial to accurately measure the amount captured. The representative drug
compound binds to the PMAA SiO2 nanoparticles in DI H2O, as seen in UV-Vis
absorption spectra. However, it appears that the addition of salts in the form of buffer
solution prevents the drug from binding. In order to better understand the binding kinetics
3.5Experimental Section
Materials: The following chemicals were used as received. PD166793 was
purchased from Sigma-Aldrich. Dimethyl sulfoxide (DMSO) was purchased from VWR.
Preparation of Fe3O4/SiO2 Nanoparticles: The Fe3O4/SiO2 nanoparticles were
synthesized by students from Dr. Brian Benicewicz’s group at University of South
Carolina. The synthesis method has been previously published.54 The nanoparticles were
received with dimethylformamide (DMF) as the solvent. In order to mimic biological
conditions, they were transferred into water as follows: An amount of original solution
was taken and placed in a 7 mL vial. A magnet was then placed near the vial wall and left
to sit for several hours. After the nanoparticles collected near the magnet and the rest of
the solution had turned clear, the magnet was held in place and the DMF was poured off.
The particles were then redissolved with water to give the desired concentration.
Magnetic Capture: The necessary amount of solution was taken into a 20 mL
syringe and the needle was switched to a blunted needle with tubing 20 mm in length and
0.64 mm in diameter. Excess air was expelled from the syringe, needle, and tube and the
syringe set-up was placed in the programmable syringe pump (New Era Pump Systems
Inc.). The previously made program, based on the desired flow rate, was run. Three
aliquots were collected for each trial: 1) Initial solution with no magnet in place. 2) Initial
solution with NdFeB magnet (grade N52, 5/16" dia. x 1/4" thick, surface field: 6275
Gauss) in place for particle capture. 3) No magnet in place, resulting in initial solution
characterization using a Thermo Scientific Evolution Array UV−visible
spectrophotometer as well as a blank in a 1 cm path quartz cuvette.
Drug Binding to SiO2 Nanoparticles: The PMAA grafted SiO2 nanoparticles
were synthesized by Yang Zheng from Dr. Brian Benicewicz’s group at University of
South Carolina. Stock solutions (100 mg/mL) of the drug compound (PD166793) were
prepared in dimethyl sulfoxide (DMSO). To complex the drug to the nanoparticles, the
drug compound was added to a vial containing nanoparticles and either buffer or DI H2O
and stirred for several hours. Control trials were performed by omitting the nanoparticles
from the solution. Each trial had the same centrifugation process: 1) 2 mL of prepared
drug solution added to Amicon Ultra-4 centrifugal filter tubes 2) 2 mL of corresponding
solvent added to tubes 3) Centrifuge at 6236 RPM for 5 minutes 4) Collected eluent and
dilute retentate to 4 mL 5) Step 3 was repeated, the eluent was collected, and the
complexed samples were extracted from the centrifugal filters and diluted (usually 2 mL)
into the corresponding solvent at room temperature. The optical absorption spectra were
REFERENCES
(1) Rogach, A. L. E. Semiconductor Nanocrystal Quantum Dots; Springer-Verlag Wien: Wien, 2008.
(2) Bae, W. K.; Brovelli, S.; Klimov, V. I. Spectroscopic Insights into the Performance of Quantum Dot Light-Emitting Diodes. MRS Bull.2013, 38, 721–730.
(3) Talapin, D. V.; Steckel, J. Quantum Dot Light-Emitting Devices. MRS Bulletin
2013, 38, 685–691.
(4) Wu, X.; Liu, H.; Liu, J.; Haley, K. N.; Treadway, J. A.; Larson, J. P.; Ge, N.; Peale, F.; Bruchez, M. P. Immunofluorescent Labeling of Cancer Marker Her2 and Other Cellular Targets with Semiconductor Quantum Dots. Nat Biotech2003, 21, 41–46.
(5) Medintz, I. L.; Uyeda, H. T.; Goldman, E. R.; Mattoussi, H. Quantum Dot Bioconjugates for Imaging, Labelling and Sensing. Nat Mater2005, 4, 435–446. (6) Murray, C. B.; Norris, D. J.; Bawendi, M. G. Synthesis and Characterization of
Nearly Monodisperse CdE (E = Sulfur, Selenium, Tellurium) Semiconductor Nanocrystallites. J. Am. Chem. Soc.1993, 115, 8706–8715.
(7) Park, Y.-S.; Malko, A. V.; Vela, J.; Chen, Y.; Ghosh, Y.; García-Santamaría, F.; Hollingsworth, J. A.; Klimov, V. I.; Htoon, H. Near-Unity Quantum Yields of Biexciton Emission from CdSe/CdS Nanocrystals Measured Using Single-Particle Spectroscopy. Phys. Rev. Lett.2011, 106, 187401.
(8) Murphy, C. J.; Coffer, J. L. Quantum Dots: A Primer. Applied Spectroscopy2002, 56, 16A – 27A.
(9) Garrett, M. D.; Bowers, M. J.; McBride, J. R.; Orndorff, R. L.; Pennycook, S. J.; Rosenthal, S. J. Band Edge Dynamics in CdSe Nanocrystals Observed by Ultrafast Fluorescence Upconversion. J. Phys. Chem. C2008, 112, 436–442.
(10) García-Santamaría, F.; Chen, Y.; Vela, J.; Schaller, R. D.; Hollingsworth, J. A.; Klimov, V. I. Suppressed Auger Recombination in “Giant” Nanocrystals Boosts Optical Gain Performance. Nano Lett.2009, 9, 3482–3488.
(11) Htoon, H.; Malko, A. V.; Bussian, D.; Vela, J.; Chen, Y.; Hollingsworth, J. A.; Klimov, V. I. Highly Emissive Multiexcitons in Steady-State Photoluminescence of Individual “Giant” CdSe/CdS Core/Shell Nanocrystals. Nano Lett.2010, 10, 2401–2407.
(12) Keene, J. D.; McBride, J. R.; Orfield, N. J.; Rosenthal, S. J. Elimination of Hole– Surface Overlap in Graded CdSxSe1–x Nanocrystals Revealed by Ultrafast Fluorescence Upconversion Spectroscopy. ACS Nano2014, 8, 10665–10673. (13) Gong, K.; Kelley, D. F. Lattice Strain Limit for Uniform Shell Deposition in
Zincblende CdSe/CdS Quantum Dots. J. Phys. Chem. Lett.2015, 6, 1559–1562. (14) Li, J. J.; Wang, Y. A.; Guo, W.; Keay, J. C.; Mishima, T. D.; Johnson, M. B.;
(15) Greytak, A. B.; Allen, P. M.; Liu, W.; Zhao, J.; Young, E. R.; Popović, Z.; Walker, B. J.; Nocera, D. G.; Bawendi, M. G. Alternating Layer Addition Approach to CdSe/CdS Core/shell Quantum Dots with near-Unity Quantum Yield and High on-Time Fractions. Chem. Sci.2012, 3, 2028–2034.
(16) Cole, A. J.; Yang, V. C.; David, A. E. Cancer Theranostics: The Rise of Targeted Magnetic Nanoparticles. Trends Biotechnol2011, 29, 323–332.
(17) Jain, T. K.; Morales, M. A.; Sahoo, S. K.; Leslie-Pelecky, D. L.; Labhasetwar, V. Iron Oxide Nanoparticles for Sustained Delivery of Anticancer Agents. Mol. Pharmaceutics2005, 2, 194–205.
(18) Corot, C.; Robert, P.; Idée, J.-M.; Port, M. Recent Advances in Iron Oxide Nanocrystal Technology for Medical Imaging. Advanced Drug Delivery Reviews
2006, 58, 1471–1504.
(19) Jordan, A.; Scholz, R.; Wust, P.; Fähling, H.; Felix, R. Magnetic Fluid Hyperthermia (MFH): Cancer Treatment with AC Magnetic Field Induced Excitation of Biocompatible Superparamagnetic Nanoparticles. Journal of Magnetism and Magnetic Materials1999, 201, 413–419.
(20) Dobson, J. Magnetic Nanoparticles for Drug Delivery. Drug Dev. Res.2006, 67, 55–60.
(21) Pankhurst, Q. A.; Connolly, J.; Jones, S. K.; Dobson, J. Applications of Magnetic Nanoparticles in Biomedicine. J. Phys. D: Appl. Phys.2003, 36, R167.
(22) Liong, M.; Lu, J.; Kovochich, M.; Xia, T.; Ruehm, S. G.; Nel, A. E.; Tamanoi, F.; Zink, J. I. Multifunctional Inorganic Nanoparticles for Imaging, Targeting, and Drug Delivery. ACS Nano2008, 2, 889–896.
(23) Terris, B. D.; Thomson, T. Nanofabricated and Self-Assembled Magnetic Structures as Data Storage Media. J. Phys. D: Appl. Phys.2005, 38, R199. (24) Loo, A. L.; Pineda, M. G.; Saade, H.; Treviño, M. E.; López, R. G. Synthesis of
Magnetic Nanoparticles in Bicontinuous Microemulsions. Effect of Surfactant Concentration. J Mater Sci2008, 43, 3649–3654.
(25) Kwon, S. G.; Hyeon, T. Colloidal Chemical Synthesis and Formation Kinetics of Uniformly Sized Nanocrystals of Metals, Oxides, and Chalcogenides. Acc. Chem. Res.2008, 41, 1696–1709.
(26) Wu, W.; Wu, Z.; Yu, T.; Jiang, C.; Kim, W.-S. Recent Progress on Magnetic Iron Oxide Nanoparticles: Synthesis, Surface Functional Strategies and Biomedical Applications. Sci. Technol. Adv. Mater.2015, 16, 023501.
(27) Park, J.; An, K.; Hwang, Y.; Park, J.-G.; Noh, H.-J.; Kim, J.-Y.; Park, J.-H.; Hwang, N.-M.; Hyeon, T. Ultra-Large-Scale Syntheses of Monodisperse Nanocrystals. Nat Mater2004, 3, 891–895.
(28) Lodhia, J.; Mandarano, G.; Ferris, N.; Eu, P.; Cowell, S. Development and Use of Iron Oxide Nanoparticles (Part 1): Synthesis of Iron Oxide Nanoparticles for MRI. Biomed Imaging Interv J2010, 6, e12.
(29) Wei, H.; Bruns, O. T.; Chen, O.; Bawendi, M. G. Compact Zwitterion-Coated Iron Oxide Nanoparticles for in Vitro and in Vivo Imaging. Integr. Biol.2012, 5, 108– 114.
(30) Jain, T. K.; Reddy, M. K.; Morales, M. A.; Leslie-Pelecky, D. L.; Labhasetwar, V. Biodistribution, Clearance, and Biocompatibility of Iron Oxide Magnetic
(31) Miguel-Sancho, N.; Bomatí-Miguel, O.; Colom, G.; Salvador, J.-P.; Marco, M.-P.; Santamaría, J. Development of Stable, Water-Dispersible, and Biofunctionalizable Superparamagnetic Iron Oxide Nanoparticles. Chem. Mater.2011, 23, 2795–2802. (32) Huang, Z.; Shen, Y.; Sun, A.; Huang, G.; Zhu, H.; Huang, B.; Xu, J.; Song, Y.;
Pei, N.; Ma, J.; et al. Magnetic Targeting Enhances Retrograde Cell Retention in a Rat Model of Myocardial Infarction. Stem Cell Res Ther2013, 4, 149.
(33) David, A. E.; Cole, A. J.; Chertok, B.; Park, Y. S.; Yang, V. C. A Combined Theoretical and in Vitro Modeling Approach for Predicting the Magnetic Capture and Retention of Magnetic Nanoparticles in Vivo. J Control Release2011, 152, 67–75.
(34) Tan, R.; Blom, D. A.; Ma, S.; Greytak, A. B. Probing Surface Saturation
Conditions in Alternating Layer Growth of CdSe/CdS Core/Shell Quantum Dots. Chem. Mater.2013, 25, 3724–3736.
(35) García-Rodríguez, R.; Liu, H. Mechanistic Insights into the Role of Alkylamine in the Synthesis of CdSe Nanocrystals. J. Am. Chem. Soc.2014, 136, 1968–1975. (36) Chen, Y.; Vela, J.; Htoon, H.; Casson, J. L.; Werder, D. J.; Bussian, D. A.;
Klimov, V. I.; Hollingsworth, J. A. “Giant” Multishell CdSe Nanocrystal Quantum Dots with Suppressed Blinking. J. Am. Chem. Soc.2008, 130, 5026–5027.
(37) Guo, Y.; Marchuk, K.; Sampat, S.; Abraham, R.; Fang, N.; Malko, A. V.; Vela, J. Unique Challenges Accompany Thick-Shell CdSe/nCdS (n > 10) Nanocrystal Synthesis. J. Phys. Chem. C2012, 116, 2791–2800.
(38) Foos, E. E.; Wilkinson, J.; Mäkinen, A. J.; Watkins, N. J.; Kafafi, Z. H.; Long, J. P. Synthesis and Surface Composition Study of CdSe Nanoclusters Prepared Using Solvent Systems Containing Primary, Secondary, and Tertiary Amines. Chem. Mater.2006, 18, 2886–2894.
(39) Shen, Y.; Tan, R.; Gee, M. Y.; Greytak, A. B. Quantum Yield Regeneration: Influence of Neutral Ligand Binding on Photophysical Properties in Colloidal Core/Shell Quantum Dots. ACS Nano2015, 9, 3345–3359.
(40) Talapin, D. V.; Rogach, A. L.; Kornowski, A.; Haase, M.; Weller, H. Highly Luminescent Monodisperse CdSe and CdSe/ZnS Nanocrystals Synthesized in a Hexadecylamine−Trioctylphosphine Oxide−Trioctylphospine Mixture. Nano Lett.
2001, 1, 207–211.
(41) Bullen, C.; Mulvaney, P. The Effects of Chemisorption on the Luminescence of CdSe Quantum Dots. Langmuir2006, 22, 3007–3013.
(42) Jasieniak, J.; Smith, L.; Embden, J. van; Mulvaney, P.; Califano, M.
Re-Examination of the Size-Dependent Absorption Properties of CdSe Quantum Dots. J. Phys. Chem. C2009, 113, 19468–19474.
(43) Thessing, J.; Qian, J.; Chen, H.; Pradhan, N.; Peng, X. Interparticle Influence on Size/Size Distribution Evolution of Nanocrystals. J. Am. Chem. Soc.2007, 129, 2736–2737.
(44) Kim, J. I.; Kim, J.; Lee, J.; Jung, D.-R.; Kim, H.; Choi, H.; Lee, S.; Byun, S.; Kang, S.; Park, B. Photoluminescence Enhancement in CdS Quantum Dots by Thermal Annealing. Nanoscale Res Lett2012, 7, 482.