CO-INTEGRATION TESTING, USING THE JOHANSEN METHOD,
BETWEEN GENERAL INDICATORS OF SOME ARAB FINANCIAL
MARKETS IN ASIA
Ateyah Alawneh1 1Tafila Technical University, College of Business, Jordan
ABSTRACT
Article History
Received: 31 October 2018 Revised: 5 December 2018 Accepted: 2 January 2019 Published: 28 January 2019
Keyword
s
Financial markets Indicators Financial markets
The Johansson co- integration Stocks indicators.
The study aims to examine Co-integration by using the Johansen method between general indicators of some Arab Financial Markets in Asia. The study uses monthly data of the general indicators of stocks in Arab financial markets for the period from 2010-2017. In order to achieve the objectives of the study, the researcher examined the stationary of the indicators. In this regard, all indicators were found stable at the first difference. As a result, the data have met the first condition of co- integration investigation. The study found that the lag period is zero according to (schware) test. Moreover, the analysis of co- integration by testing the Co-integration Rank and the Maximum Eigen value showed the existence of one co- integration at least between Arab Financial Markets in Asia. The study provides a number of recommendations; the most important of which is to support more capital flows between the markets and to use attractive financial instruments for investors in the Arab Financial Markets in Asia. This can be done through the extensive use of Islamic financial instruments. Furthermore, the current paper aims at establishing a monetary integration between the study samples.
Contribution/ Originality:
The study aims to examine Co-integration by using the Johansen method between general indicators of some Arab Financial Markets in Asia.1. INTRODUCTION
Financial markets have largely developed through the flow of capitals among countries due to the important
role of financial markets in dealing with investment decisions in countries, especially the Arab countries in Asia, which have relationships in finance and economics. The Co-integration of Arab countries, especially among the Gulf states in general and Jordan, comes to the convergence of geography and traditions, thus enhancing the flow of capital among the countries in question through the financial market, which is considered to be equipped for the
investment decision in addition to the dependence of their economies on each other in addition to the movement of
the capital, labor, goods exchanging and services. Arab countries seek to reduce transaction costs and legal restrictions to support financial and economic integration. Arab countries depend on each other's economies.
International Journal of Asian Social Science
ISSN(e): 2224-4441 ISSN(p): 2226-5139
DOI: 10.18488/journal.1.2019.92.213.228 Vol. 9, No. 2, 213-228
Emirates). The Gulf States in particular rely on Jordan for the sake of labor, as well as importing agricultural and industrial goods. This is the major reason that the research project comes through the use of the Johansson co-integration method in order to examine whether there is a co-co-integration between the major indicators of financial markets in Asia (Saudi Arabia, Bahrain, Abu Dhabi, Dubai and Jordan), which have economic, social, political and regional links. The research project covers monthly data for the period from 1/1/2010 to 31/12/2017. These data concern Arab major financial markets in Asia (Saudi Arabia, Bahrain, Abu Dhabi, and Dubai, Jordan). Data are also based on the general indices of monthly stock indicator in the Arab countries. The monthly data on all indicators and accessibility are available in addition to the growing financial and economic relations between the sample countries during this period.
The study will analyze the descriptive statistics of the research sample data. Moreover, it will analyze the relationship between the indicators of the research sample and then it will find out the co-integration through the first step in finding the stationary data. The second step is applying the deceleration period of the data. The third step is finding co- integration based on the slowdown period. Finally, results will be illustrated and later the recommendations of the study will be inferred and stated.
2. THE PROBLEM OF THE STUDY
The problem of the research project comes from the use of the Johannes Co-integration test to examine whether or not there is a Co-integration of the major indicators of the Arab financial markets in Asia (Saudi Arabia Bahrain, Abu Dhabi, Dubai and Jordan) which have economic, social, political and regional linkage. Therefore, the problem of the study can be formulated through the following questions:
Is there at least one co- integration relationship between the countries of the sample of the study by
using the Johansson test?
Is there more than one Co-integration relationship between the countries that represent the study
sample by using the Johansson test?
3. OBJECTIVES OF THE STUDY
The study aims at achieving the following objectives:
Identify the concept of financial indicators in the countries involved in the current study. Identify the development of financial indicators in these countries.
Analyze the descriptive statistics of the countries of the study sample
Analyze the correlation between the financial indicators of the countries in question.
Analyze of Co-integration by using the Johansen test among the financial indicators of the countries involved.
Obtain results and recommendations to assist investment decision makers of these countries.
Find out where the investor puts his money to avoid the risks of international investment.
4. THE SIGNIFICANCE OF THE STUDY
The significance of this study is of a high value and benefit to the Arab and foreign investors in financial markets and investors in real investment. In addition, it is highly beneficial to researchers, students and decision makers who invest in the countries concerned. The results of the study are important to support the theoretical and practical aspects of the financial markets.
5. HYPOTHESES OF THE STUDY
-There is a common integration between the Arab financial markets in the research sample that paves the way for the existence of a unified Arab financial market among all the other Arab countries through the following hypotheses.
There is at least one significant co-integration relationship with statistical significance (α <0.05) between the countries of the study sample.
There is more than one co-integration relationship (α <0.05) between the countries involved in the current study.
6. LITERATURE REVIEW
There are several studies on the Co-integration of financial markets but very few of these studies tackled the precise idea of this research with its comprehensive study of the most Arab countries.
HandeErdincn (2009) conducted a study that aims at measuring the Co- integration of the stock markets at some of the main EU countries, France, Germany and the United Kingdom. The study is based on the market indicators of the European countries which (FTSE 100 Indicator, DAX Indicator, CAC4 Indicator, MSCI Indicator) 1the study used the Johansen test of co- integration where there was a co-integration between the financial markets of the countries concerned due to the similarity of the economic structure in these countries.
Canarella et al. (2008) examine the Co-integration relationship between NAFTA's financial markets, (Canada, México and the United States), through the use of the Johansen test of Co- integration where the study showed an integration relationship between the market of Mexico and the United States of America.
Komlavi (2010) analyzed the Co-integration during the global financial crisis for the period from 2008 to August 2009 by analyzing the co-integration of international financial market indicators for Group of States (OECD Group, Pacific Group, Asia Group). The analysis shows that the three groups have at least one co-integration relationship. This made investors in Asian capital markets never avoid any impact from financial markets, even if some domestic markets are still not fully open to the international market.
Muhammad and Syed (2012;2018)analyzed the determinants of the stock market between Pakistan and Asian economies from 2001 to 2015 by using Philips-Perron (PP) test to verify the co-integration of their financial markets. The results indicate that there is a long-term Co-integration between the Pakistan stock market and Stock markets in China, India, Indonesia, Korea, Malaysia and Thailand.
Neda and Amir (2014)examine the links between equity markets in five Asian countries; Malaysia, Indonesia, Philippines, Japan and Turkey with United States of America. The study used monthly data for the period 1995-2010 through the use of VAR analysis. AR results showed significant market interactions. Moreover, the results showed that the US stocks are interconnected with all Asian stock markets. Furthermore, Japan is strongly intertwined with other Asian markets.
Mohamad and Wael (2013) conducted a study whose aim was to investigate the Co-integration of Arab
financial markets mainly through focusing on previously defined countries; Kuwait and Jordan. The study used
Johansen test of Co-integration. The study results showed a Co-integration relationship between the Kuwaiti and
Jordanian financial markets.
1FTSE 100 Index) is a share index of the 100 companies listed on the London Stock Exchange with the highest market capitalization( https://www.avatrade.sa.com/cfd-trading/indices/ftse-100)
. (DAX) is a stock index that represents 30 of the largest and most liquid German companies that trade on the Frankfurt Exchange.(
https://www.avatrade.sa.com/cfd-trading/indices/dax-30)
(CAC 40)The index represents a capitalization-weighted measure of the 40 most significant values among the 100 highest market caps on the Euro next Paris.(
However, there are many studies and research relevant to financial markets integration of countries that are
not economically similar. The study of Walid (2008) examined long-term and dynamic relationships in the short
term between the Egyptian Stock Exchange and its counterparts in the Group of Seven (G7). Results showed that the Egyptian stock exchange does not share long-term Co-integration relationships With G7.
Mohanasundaram and Karthikeyan (2015) explore the nature of the relationship among the stock market indices in South Africa, India and the USA. Their study used monthly data from stock indices, JALSH (South Africa), NIFTY (India) and NASDAQ (United States of America). Accordingly, the study led to a strong relationship among the stock market indices in South Africa, India and the United States of America.
Eventually, Mohamad and Wael (2013) examined the extent of Co-integration between EU countries and-
Arab financial markets. Test results showed that the null hypothesis of non-integration cannot be accepted if the Arab market Indicator is a dependent variable. However, it can be accepted in the EU is a dependent Variable.
7. THE THEORETICAL FRAMEWORK OF THE STUDY
7.1. Historical Introduction
The financial market of Jordan is one of the oldest markets in the Arab world and was established in 1978. In 1989, the financial market in Bahrain was established and also started an active market in Saudi Arabia. In 2000, the Dubai Stock Exchange and the Abu Dhabi Stock Exchange were established in the United Arab Emirates (Ashraf, 2009).
7.2. Common Features of Arab Financial Markets
The recent Arab financial markets are characterized by some common features, most notably the narrowness of the market. The tightness of the market in the Arab financial markets is due to the limited supply and demand of financial investment instruments in these markets, as well as the concentration of trading in a limited number of shares, The active shares traded to the total volume of trading, reflecting the small number of attractive shares, due to the concentration of some major investors to keep the shares of promising companies, in addition to the low quality of the majority of listed stocks as such the Arab financial markets are characterized by weak diversification of securities, poor liquidity and high volatility. This in turn leads to increased volatility in the profitability of the stock and consequently its market value, which raises fears among investors and presents them with high losses
(Ashraf, 2009).
7.3. Benefits of Co- Integration
7.4. Indicators of Financial Markets for the Study Sample
The concept of the general market indicator measures the level of indicator in the market, based on a sample of enterprises shares traded in regulated or unregulated capital markets or both. The sample is often selected in such a way as to allow the indicator to reflect the situation in which the capital market is intended to be measured (http://www.arabapi.org) .
In addition, the indicators are the value that measures the actual changes in the indicator of securities traded in the financial markets, using a mathematical equation that matches the nature of each financial market so as to identify the movement of indicator, trends and market performance. The main objective is to identify the movement of stock indicator in the financial market indicators of financial markets, during the years of study (Dredid, 2012).
The general indicators of stock indicator in the financial markets were based on the market trend and the study of the co- integration of financial markets; because they indicate the levels of stock indicator and determine
indicator general price Stock price during a certain period, compared with another period (Shukairy and Saleh,
2012).
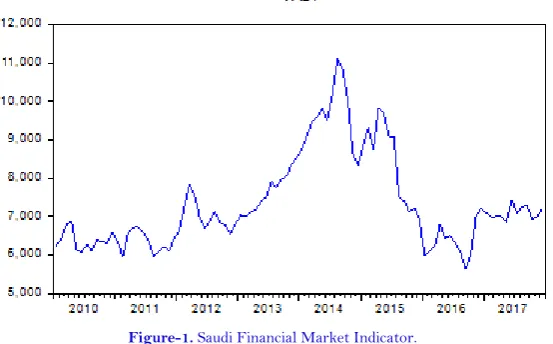
7.4.1. The Saudi Financial Market Indicator. )TASI(
(TASI) is a digital standard which reflects changes in the market value of shares of all companies traded on Saudi stock market, and then it serves as a thermometer that measures the activity and prosperity of stock market
(Ibrahim, 2005).
Figure (1) represents the Saudi Financial Market Indicator. )TASI(, which reflects the trend of Saudi’s
Financial Market Indicator during the study period for the monthly data during 2010-2017. It can be noted from the form that the trend of indicator in the market is raising at the beginning of the study until the summit reached in mid-2014.then the market trend began to decline and continued until it reached the bottom in the first third of 2016, as a result the market went in a bullish direction.
Figure-1. Saudi Financial Market Indicator.
Source: E-views program dependent on appendix (5)
7.4.2. Dubai Financial Market Indicator (DFMGI)
Figure (2) Dubai Financial Market indicator (DFMGI) reflects the trend of Dubai’s Financial Market Indicator
during the study period for the monthly data during 2010-2017. According to the form, it is notable that the trend
1,200 1,600 2,000 2,400 2,800 3,200 3,600 4,000 4,400 4,800 5,200
2010 2011 2012 2013 2014 2015 2016 2017
DFMGI
Figure-2. Dubai Financial Market Indicator (DFMGI)
Source: E- views program based on appendix (5)
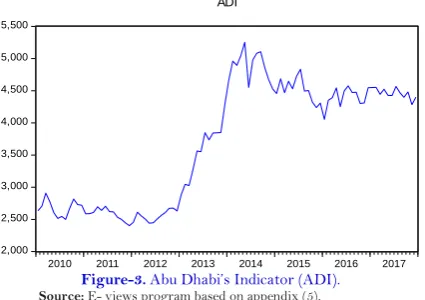
7.4.3. Abu Dhabi Financial Market Indicator (ADI)
Figure (3) represents Abu Dhabi’s Financial Market indicator (ADI). Which reflects the trend Abu Dhabi’s
Financial Market Indicator during the study period for the monthly data for the period 2010-2017. It is noted from that the indicator trend in the market is raising at the beginning of the study until it reaches the summit in
mid-2014, then the indicator begins to decline and continues until it reaches the bottom in mid-2015 then the market
started to rise.
2,000 2,500 3,000 3,500 4,000 4,500 5,000 5,500
2010 2011 2012 2013 2014 2015 2016 2017
ADI
Figure-3. Abu Dhabi’s Indicator (ADI).
Source: E- views program based on appendix (5).
According to the form above, it is notable that the markets are moving according to Dow's technical analysis
in the Saudi’s financial market, Dubai’s and Abu Dhabi’s Financial Market; indicating that the market is fluctuating
then became stable based on Dow's theory in financial market (Dredid, 2012).
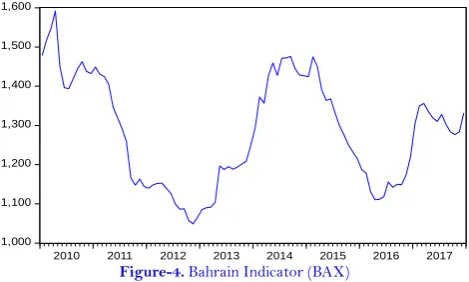
7.4.4. Bahrain’s Financial Market Indicator (BAX)
Figure (4) represents the general indicator of Bahrain’s Financial Market, which reflects the trend of the general Indicator of Bahrain Financial Market during the study period for the monthly data from 2010-2017. Based on the Figure, the indicator’s trend in the market begins to decline at the beginning of the study until it reaches the bottom at the end of 2012. Then the indicator inclines and continued until it reaches the summit at the third quarter of 2014, then the market declines until it reaches the bottom at the second quarter of 2016. In conclusion, the market started to rise one again.
1,000 1,100 1,200 1,300 1,400 1,500 1,600
2010 2011 2012 2013 2014 2015 2016 2017
BAX
Figure-4. Bahrain Indicator (BAX)
Source: E- views program based on appendix (5)
7.4.5. Amman’s Financial Market Indicator (AMGNRLX)
Figure (5) represents Amman’s Financial Market Indicator (AMGNRLX), which reflects the trend Amman
Financial Market Indicator during the study period. As the form shows price trend fluctuation in the market and
began to decline at the beginning of the study until it reached the bottom in the third quarter of 2013. The indicator trend started to incline until it reaches the summit in the first quarter of 2014. The market kept fluctuating until the end of the study because financial markets are affected by political and economic events as well as by crises in neighboring countries and the whole region in general.
Jordanian market is different from the Saudi’s market, Dubai’s market and Abu Dhabi’s market. The previous markets were bullish at the beginning of the study, and then the markets declined at the end of the study, while Bahraini market was having the same position of the Jordanian market during the period of the study; whereas the markets were downward, then took the upward trend. The trend went downward at the end of the study because of the financial market is affected by political and economic events.
1,800 1,900 2,000 2,100 2,200 2,300 2,400 2,500 2,600
2010 2011 2012 2013 2014 2015 2016 2017
AMGNRLX
Figure-5. Amman’s Financial Market Indicator (AMGNRLX)
Source: E- views program based on appendix (5)
8. DESCRIPTIVE STATISTICS
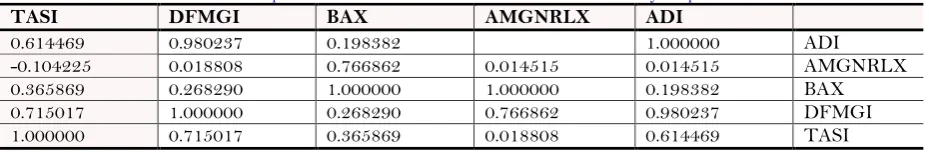
9. THE CORRELATION BETWEEN THE INDICATORS OF ARAB FINANCIAL MARKETS IN
COUNTRIES OF THE STUDY SAMPLE
Table (1), shows a strong correlation between (ADI); the Indicator and the (DFMGI) Indicator Correlation has reached 98%, while the correlation (61%) was between the (TASI) and (AD I). In addition, the (71%) correlation was between (AMGN) and (BAX). Furthermore the value of correlation was (71%) between (TASI) and (DFMGI), but the remaining indicators have lower relations among them. As for (TASI) and (AMGN), it was negative due to the rise in the general Indicator of the Saudi’s stock indicator, reflecting the activity in the Saudi market and pointing to
a decrease in the Jordanian marketactivity. Consequently, the decline in the indicator of Jordanian market is due to
the Saudi’s investors and their movements in between the two markets.
Table-1. Expresses correlation between indicators in countries of study sample.
ADI AMGNRLX
BAX DFMGI
TASI
ADI 1.000000
0.198382 0.980237
0.614469
AMGNRLX 0.014515
0.014515 0.766862
0.018808 -0.104225
BAX 0.198382
1.000000 1.000000
0.268290 0.365869
DFMGI 0.980237
0.766862 0.268290
1.000000 0.715017
TASI 0.614469
0.018808 0.365869
0.715017 1.000000
Source: E- views program based on appendix (5)
10. ANALYSIS OF JOHANSEN CO-INTEGRATION
In order to find the Co-integration through the first step is to find out the stationary data, the second step isto
apply a deceleration period of data whereas the third step is finding a Co integration as follows,
First: The Stationary Test
In order to calculate co- integration, all variablesmust be stable at the same level.
The rooted unit will be tested using the dickey fuller method in which the unit root is being applied. On other hand, all indicators of the study are found unstable, but they settle at the first difference. Appendix (2), shows that all
variables are stabilized at the first difference. It’s necessary to achieve using Johansen co- integration.
The results of unit root test to be contained in the appendix (I). The Indicators; TASI, DFMGI, ADI , BAX , AMGNRLX are not stationary at any level ,but stationary at 1 %, 5%, and 10% level, with the first difference (d(1)); indicated by ADF results at all levels less than the critical values in negative direction. The ADF value for (TASI) is (-8.372111) and the critical values are (-2.589795) (-1.944286) and (-1.614487) at 1, 5, and 10 percent, respectively. The ADF value for (DFMGI) is (-10.33292) and the critical values are (-2.589795) (-1.944286) and (-1.614487) at 1, 5, and 10 %, respectively. The ADF value for (ADI) is-11.00283) and the critical values are (-2.589795) (-1.944286) and (-1.614487) at 1, 5, and 10 %, respectively. The ADF value for (BAX) is (-6.918654) and the critical values are (-2.589795) (1.944286) and (-1.614487) at 1, 5, and 10 %, respectively. The ADF value for (AMGNRLX) is (-10.05620) and the critical values are (-2.589795) (- 1.944286) and (-1.614487) at 1, 5, and 10 %, respectively.
Second: The Deceleration Test
It can be noticed from Appendix (3) the deceleration test (E-Views) values by using (summarize all 5 sets of
assumption). Additionally, it can be noted that the deceleration period shows the lowest value selected in (linear intercept no trend model) because it is a better Model of Johansen co- integration. In addition, Appendix (2) shows
that the deceleration period (zero) gives the lowest value when testing (Schwarz( because it gives the best results
Third: Johansen Co- Integration Test
It can be noticed from Appendix (4) which shows that there is one Co-integration between the general indicators of stock indicator in financial markets of the country in Asia (the study sample). As shown in Appendix
(4) unrestricted Co-integration Rank Test( (Trace). Furthermore, it also can be noticed from Appendix (4) that
confirms the results of) Unrestricted Co-integration Rank Test (Maximum Eigen value) which means there is a
single Co-integration between the general indicators of stock indicator in the financial markets of the country in
Asia (The study sample). Consequently, it’s been accepted that there is one Co-integration between general
indicators of stock indicator in financial markets of the countries in Asia (The study sample), but rejects the
hypothesis that there is more than co- integration between general indicators of stock indicator in financial markets
of the country in Asia (The study sample).
11. THE RESULTS
By reviewing the previous studies where there were many studies on the integration of some of the financial markets However, the results of this study were different in addition to the difference in the study sample as follows The main financial markets in the Arab countries in Asia have positive correlation between some of them. There is a positive relationship between Saudi Arabia and Dubai. There is also a positive correlation between Saudi Arabia and Abu Dhabi. Also, there is a positive relationship between Dubai and Abu Dhabi, and a positive
relationship between Jordan and Bahrain. The analysis of Johansen Co-integrationtest showed that there is at least
one Co-integration between financial markets (the sample of the study) by testing Trace Unrestricted
Co-integration Rank Test (and Co-integration Rank Test (Maximum Eigen value.
12. RECOMMENDATIONS
The following study has come up with the following recommendations:
The Co-integration of financial markets of Arab countries should be supported by the flow of more funds
between them to increase their co- integration.
Support Co-integration among Arab countries towards enhancing economic and financial integration
Achieve monetary integration among countries of the study sample to gradually spread to all Arab
countries.
Dealing with attractive financial instruments for Arab investors through the use of Islamic financial
instruments to support joint integration between Arab countries.
Making more studies about co- integration of other Arab financial markets and other foreign countries.
Funding: This study received no specific financial support.
Competing Interests: The author declares that there are no conflicts of interests regarding the publication
of this paper.
REFERENCES
Ashraf, M.D., 2009. Integration of Arab financial markets, Prospects and challenges. Research Presented to the Conference (Emerging Issues of Emerging Economies in the Modern Business Environment) at the Faculty of Business Administration, University of Jordan, Amman, April 15-14.
Canarella, G., M.M. Stephen and K.P. Stephen, 2008. Dynamic stock market interactions between the Canadian, Mexican, and the United States markets: The NAFTA experience. Department of Economics Working Paper Series 2008-49, University of Connecticut, Mansfield Road, Unit ,This Working Paper is Indexed on RePEc.
HandeErdincn, J., 2009. Analysis of cointegration in capital markets of France, Germany and United Kingdom. Economics & Business Journal: Inquiries & Perspectives, 2(1): 109-123.
Ibrahim, A.R., 2005. How is the stock indicator calculated? Alriyadh Economics, Issue No. 13460, Riyadh, Saudi Arabia, Electronic magazine, Available from: http://www.alriyadh.com/611. Available from http://www.alriyadh.com/611. Komlavi, E.A., 2010. Co- integration of major stock market indices during the 2008 global financial distress. International
Journal of Economics and Finance, 3(2): 212-222.
MacKinnon, J.G., 1996. Numerical distribution functions for unit root and cointegration tests. Journal of Applied Econometrics, 11(6): 601-618. Available at: https://doi.org/10.1002/(sici)1099-1255(199611)11:6<601::aid-jae417>3.0.co;2-t. MacKinnon, J.G., A.A. Haug and L. Michelis, 1999. Numerical distribution functions of likelihood ratio tests for cointegration.
Journal of Applied Econometrics, 14(5): 563-577. Available at: https://doi.org/10.1002/(sici)1099-1255(199909/10)14:5<563::aid-jae530>3.0.co;2-r.
Mark, T., 2007. Working paper on financial sector integration in Africa. Financial sector integration in two Regions of Sub-Saharan Africa, how creating scale in financial markets can support growth and development, Africa Region, Making
Finance Work for Africa, World Bank. pp: 1-90. Available from
http://siteresources.worldbank.org/INTAFRSUMAFTPS/Resources/Working_Paper_on_Regional_Financial_Inte gration_Jan07.pdf.
Mohamad, H.A. and R. Wael, 2013. Testing the existence of integration; Kuwait and Jordan financial markets. International Journal of Economics, Finance and Management Sciences, 1(2): 89-94. Available at: https://doi.org/10.11648/j.ijefm.20130102.14.
Mohanasundaram, T. and P. Karthikeyan, 2015. Cointegration and stock market interdependence: Evidence from South Africa, India and the USA. South African Journal of Economic and Management Sciences, 18(4): 475-485. Available at: https://doi.org/10.17159/2222-3436/2015/v18n4a3.
Muhammad, A. and A.S. Syed, 2012. Determinants of stock market co-movements between Pakistan and Asian emerging economies. Journal of Risk and Financial Management, 11(3): 1-14. Available at: https://doi.org/10.3390/jrfm11030032.
Muhammad, A. and A.S. Syed, 2018. Determinants of stock market co-movements between Pakistan and Asian emerging economies. Journal of Risk and Financial Management, 11(3): 1-14.Available at: https://doi.org/10.3390/jrfm11030032.
Neda, B. and M.Z. Amir, 2014. The study of relationship between Asian stock exchanges and New York stock exchange. Technical Gazette, 21(3): 609-615.
Shukairy, N. and Z. Saleh, 2012. Investment management. 1st Edn. Amman, Jordan: Dar Al Masirah. pp: 156- 155.
APPENDICES
Appendix (1)
Appendix (2)
Null Hypothesis: TASI has a unit root Exogenous: None
Lag Length: 0 (Automatic - based on SIC, maxlag=1)
t-Statistic Prob.*
Augmented Dickey-Fuller test statistic -0.064250
0.6588
Test critical values: 1% level
-2.589531
5% level -1.944248
10% level -1.614510
*MacKinnon (1996) one-sided p-values.
Null Hypothesis: D(TASI) has a unit root Exogenous: None
Lag Length: 0 (Automatic - based on SIC, maxlag=1)
t-Statistic Prob.*
Augmented Dickey-Fuller test statistic -8.372111
0.0000
Test critical values: 1% level
-2.589795
5% level -1.944286
10% level -1.614487
*MacKinnon (1996) one-sided p-values.
Null Hypothesis: DFMGI has a unit root Exogenous: None
Lag Length: 0 (Automatic - based on SIC, maxlag=1) t-Statistic
Prob.*
Augmented Dickey-Fuller test statistic 0.185705
0.7380
Test critical values: 1% level
-2.589531
5% level -1.944248
10% level -1.614510
*MacKinnon (1996) one-sided p-values.
ADI AMGNRLX BAX
DFMGI TASI
Mean 3703.766
2120.804 1282.894
2780.149 7357.543
Median 4145.380
2119.450 1287.685
3074.385 7000.905
Maximum 5253.410
2575.470 1591.940
5087.470 11112.12
Minimum 2402.280
1850.590 1048.810
1353.390 5623.340
Std. Dev. 944.7470
146.6717 137.3364
1119.480 1228.129
Skewness -0.144011
0.731302 0.103572
0.214465 1.150843
Kurtosis 1.326896
3.920888 1.811977
1.792564 3.544155
Jarque-Bera 11.52893
11.94899 5.817233
6.567531 22.37544
Probability 0.003137
0.002543 0.054551
0.037487
Sum 355561.6
203597.2 123157.8
266894.3 706324.1
Sum Sq. Dev. 84791949
2043697. 1791823.
1.19E+08 1.43E+08
Observations 96
96 96
Null Hypothesis: D(DFMGI) has a unit root Exogenous: None
Lag Length: 0 (Automatic - based on SIC, maxlag=1)
t-Statistic Prob.*
Augmented Dickey-Fuller test statistic -10.33292
0.0000
Test critical values: 1% level
-2.589795
5% level -1.944286
10% level -1.614487
*MacKinnon (1996) one-sided p-values.
Null Hypothesis: ADI has a unit root Exogenous: None
Lag Length: 0 (Automatic - based on SIC, maxlag=1)
t-Statistic Prob.*
Augmented Dickey-Fuller test statistic 0.746064
0.8738
Test critical values: 1% level
-2.589531
5% level -1.944248
10% level -1.614510
*MacKinnon (1996) one-sided p-values.
Null Hypothesis: D(ADI) has a unit root Exogenous: None
Lag Length: 0 (Automatic - based on SIC, maxlag=1)
t-Statistic Prob.*
Augmented Dickey-Fuller test statistic -11.00283
0.0000
Test critical values: 1% level
-2.589795
5% level -1.944286
10% level -1.614487
*MacKinnon (1996) one-sided p-values.
Null Hypothesis: BAX has a unit root Exogenous: None
Lag Length: 1 (Automatic - based on SIC, maxlag=1)
t-Statistic Prob.*
Augmented Dickey-Fuller test statistic -0.619042
0.4467
Test critical values: 1% level
-2.589795
5% level -1.944286
10% level -1.614487
*MacKinnon (1996) one-sided p-values.
Null Hypothesis: D(BAX) has a unit root Exogenous: None
Lag Length: 0 (Automatic - based on SIC, maxlag=1)
t-Statistic Prob.*
Augmented Dickey-Fuller test statistic -6.918654
0.0000
Test critical values: 1% level
-2.589795
5% level -1.944286
10% level -1.614487
Null Hypothesis: AMGNRLX has a unit root Exogenous: None
Lag Length: 0 (Automatic - based on SIC, maxlag=1)
t-Statistic Prob.*
Augmented Dickey-Fuller test statistic -0.983227
0.2895
Test critical values: 1% level
-2.589531
5% level -1.944248
10% level -1.614510
*MacKinnon (1996) one-sided p-values.
Null Hypothesis: D(AMGNRLX) has a unit root Exogenous: None
Lag Length: 0 (Automatic - based on SIC, maxlag=1)
t-Statistic Prob.*
Augmented Dickey-Fuller test statistic -10.05620
0.0000
Test critical values: 1% level
-2.589795
5% level -1.944286
10% level -1.614487
*MacKinnon (1996) one-sided p-values.
Appendix (3)
Date: 09/01/18 Time: 18:23 Sample: 2010M01 2017M12 Included observations: 93 Series: ADI AMGNRLX BAX DFMGI TASI
Lags interval: 1 to 2
Selected (0.05 level*) Number of
Cointegrating Relations by Model
Data Trend: None
None Linear
Linear Quadratic
Test Type No Intercept
Intercept Intercept
Intercept Intercept
No Trend No Trend
No Trend Trend
Trend
Trace 0
1 1
0 0
Max-Eig 0
1 1
0 0
*Critical values based on MacKinnon et al. (1999)
Schwarz Criteria by Rank (rows)
and Model
(columns)
0 62.30937*
62.30937* 62.51119
62.51119 62.69288
1 62.56349
62.46057 62.62281
62.66780 62.80112
2 62.88529
62.76390 62.88655
62.97848 63.07975
3 63.27838
63.16190 63.23582
63.35725 63.43249
4 63.71964
63.61892 63.66671
63.80374 63.83084
5 64.20660
64.10893 64.10893
Appendix (4)
Date: 08/28/18 Time: 22:11 Sample (adjusted): 2010M02 2017M12 Included observations: 95 after adjustments Trend assumption: Linear deterministic trend Series: ADI AMGNRLX BAX DFMGI TASI Lags interval (in first differences): B0 to Unrestricted Cointegration Rank Test (Trace)
Hypothesized Trace
0.05
No. of CE(s) Eigenvalue Statistic Critical Value Prob.** None * 0.308005 73.54019 69.81889 0.0245
At most 1 0.197686
38.56349 47.85613
0.2780
At most 2 0.101271
17.63927 29.79707
0.5928
At most 3 0.051763
7.495814 15.49471
0.5208
At most 4 0.025424
2.446521 3.841466
0.1178
Trace test indicates 1 co-integratingeqn(s) at the 0.05 level * denotes rejection of the hypothesis at the 0.05 level
**MacKinnon et al. (1999) p-values
Unrestricted Co-integration Rank Test (Maximum Eigenvalue)
Hypothesized Max-Eigen
0.05
No. of CE(s) Eigenvalue Statistic Critical Value Prob.** None * 0.308005 34.97670 33.87687 0.0368
At most 1 0.197686
20.92422 27.58434
0.2808
At most 2 0.101271
10.14345 21.13162
0.7311
At most 3 0.051763
5.049293 14.26460
0.7356
At most 4 0.025424
2.446521 3.841466
0.1178
Max-eigenvalue test indicates 1 co-integratingeqn(s) at the 0.05 level * denotes rejection of the hypothesis at the 0.05 level
**MacKinnon et al. (1999) p-values
2017M04 4522.560000000001
2185.26 1335.67
3414.93 7013.47
2017M05 4427.3
2175.18 1319.75
3339.37 6871.24
2017M06 4425.399999999999
2167.4 1310.04
3392 7425.72
2017M07 4566.149999999999
2139.82 1327.81
3633.18 7094.17
2017M08 4468.41
2157.26 1302.46
3637.55 7258.64
2017M09 4397.399999999999
2121.52 1283.46
3563.99 7283.01
2017M10 4479.600000000001
2093.19 1276.69
3635.87 6934.37
2017M11 4283.07
2122.47 1283.71
3420.17 7003.97
2017M12 4398.439999999999
2126.78 1331.71
3370.07 7226.32