Heavy Meson Production and Spectroscopy at CMS
Kai Yi1,aand E. Asli Yetkin2for the CMS Collaboration
1University of Iowa, USA
2Mimar Sinan Fine Arts University, TURKEY
Abstract.
This proceeding summarizes the search for new physics via a rare heavy meson decays–
Bs → μ+μ−, the observation of an unexpected structure in theJ/ψφspectrum through exclusive B+ → J/ψφK+decays, as well as the measurement ofX(3872) production cross section using the pp collision data collected at the CMS experiment.
1 Introduction
Large and high quality proton-proton collision data have been collected by both ATLAS and CMS experiments at the world’s highest center-of-mass energy. The CMS collaboration collected an in-tegrated luminosity of 6 fb−1 at √s = 7 GeV and 24 fb−1 at √s = 8 GeV of pp collision data at the LHC. Using these datasets the ATLAS and CMS collaborations have discovered the Higgs boson which completes the standard model of particle physics. The data also provide a great opportunity to perform other measurements and search for physics beyond the standard model. This report sum-marizes a search for new physics via the rare processBs → μ+μ−, the observation of an unexpected structure in theJ/ψφinvariant mass spectrum through exclusiveB+→ J/ψφK+decays, as well as the measurement ofX(3872) production cross section.
2 Measurement of
B
s→
μ
+μ
−The standard model predicts very small branching fractions for theB0
s →μ+μ−andB0→μ+μ−decays
because they are mediated by effective flavor-changing neutral currents and are helicity suppressed. In this report, we present the search for these decays based on the pp collision data collected by the CMS experiment during 2011 (√s =7 TeV) and 2012 (√s =8 TeV) at the LHC. Compared to the previous CMS publication [1], the result from this analysis is enhanced by improved muon identification, improved and expanded selection variables, as well as the use of Multi-Variate Analysis (MVA) technique. The invariant mass of the dimuon pair in the range of 5.2<m<5.45 GeV was kept blind until the final event selections were determined. The details of this analysis can be found in Ref. [2].
The signal candidates are characterized by opposite sign dimuon pairs originating from a well-reconstructed secondary B vertex. A boosted decision tree (BDT) constructed within the TMVA
ae-mail: yik@fnal.gov
DOI: 10.1051/
C
Owned by the authors, published by EDP Sciences, 2014
/201
)
-μ + μ → 0
BF(B
0 0.2 0.4 0.6 0.8 1 1.2 1.4 1.6 1.8 -9 10
×
s
CL
0 0.2 0.4 0.6 0.8
1 CLs observed
σ
2
±
s Expected SM CL
σ
1
±
s Expected SM CL
median s Expected SM CL
CMS -1 (8TeV)
(7TeV) + 20fb
-1
L = 5fb
Figure 1. (Left) The weighted dimuon mass from all categorized BDT bins. The events in each category are weighted with S/(S+B), where S (B) is the number of signal (background) candidates determined at theB0
s peak position in each bin. (Right) Expected and observed CLSforB(B0→μ+μ−) as a function of the assumed
branching fraction [2].
framework [3] is trained to separate the real muons from the charged hadrons. The background com-ponents are estimated from the data sidebands (the combinatorial background) and from simulated events (other B decays that appear in the signal region). To separate signal events from background events, the output discriminantbfrom BDT is used in two ways: (1) 1D-BDT method is used for the determination of the upper limit onB(B0 → μ+μ−); (2) categorized-BDT method is used to extract B(B0
s → μ+μ−). In the categorized-BDT method, the discriminantbis used to define 12 event
cat-egories with different signal-to-background ratios and the dimuon invariant mass distributions from 12 categories are fitted simultaneously to extract the final result. The S/(S+B) weighted dimuon mass from all categorized BDT bins is shown in Fig. 1 (left), where S and B is the number of signal and background events determined at theB0
speak position in each bin.
TheB0
s(B0)→μ+μ−branching fraction is measured as
B(B0s(B0)→μ+μ−)= Ns NB+ obs
fu fs
B+ tot
totB
(B+) (1)
whereNs is the number of reconstructed B0
s(B0) → μ+μ− decays, NB +
obs is the number of the
re-constructedB+ → J/ψK+ decays, B
+ tot
tot is total B
+ efficiency divided by the total signal efficiency,
B(B+) = (6.0 ±0.2) ×10−5 is the branching fraction for B+ → J/ψK+ → μ+μ−K+ [4], and fu
fs = 0.256±0.020 (needed forB(B
0
s) only) is the ratio of the B+and B0s fragmentation fractions
measured by the LHCb experiment [5].
An excess ofB0
s →μ+μ−decays is observed above the background expectation with a significance
above 4.2 standard deviations. The measured decay-time integrated branching fraction isB(B0
s →
μ+μ−)=(3.0+1.0
−0.9)×10−
9. The uncertainty includes both statistical and systematical components. No
) [GeV] + K -K + K ψ m(J/ 5.15 5.2 5.25 5.3 5.35 5.4 5.45
Candidates / 5 MeV
0 200 400 600 800 1000 1200 1400 1600 1800 2000 -1 = 7 TeV, L = 5.2 fb s
CMS,
) < 1.035 GeV
-K
+
1.008< m(K m < 1.568 GeV Δ Fit Background Data m [GeV] Δ
1.1 1.2 1.3 1.4 1.5
) / 20 MeV
+ N(B 0 50 100 150 200 250 300 -1 = 7 TeV, L=5.2 fb s
CMS,
Data
Three-body PS (global fit)
) + , K φ , ψ Event-mixing (J/ ) + K φ , ψ Event-mixing (J/ Global fit 1D fit uncertainty band σ 1 ±
m [GeV]
Δ 1 1.1 1.2 1.3 1.4 1.5 1.6 1.7 1.8
Candidates / 20 MeV
0 100 200 300 400 500 600 -1 = 7 TeV, L = 5.2 fb s
CMS,
B mass signal region
σ
-1.5
B
m < m(J/ψφK) <mB+1.5σ
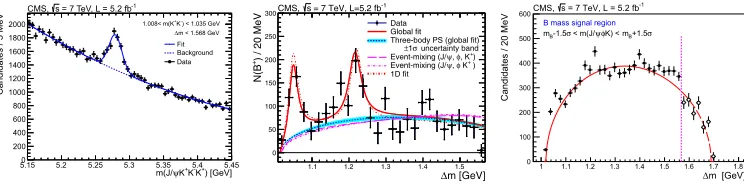
Figure 2.TheJ/ψφK±mass distribution with the standard event selection (left). The number ofJ/ψφK± candi-dates as a function ofΔm=m(μ+μ−K+K−)−m(μ+μ−)(middle). TheΔmspectrum, including non-B candidates after subtractingB0
s contribution, within±1.5σof the B nominal mass. The dashed vertical line indicates the boundary of the region eliminated from the analysis (right region). The data in the left region are represented by black markers. The entries in the right region are subtracted of theB0
sbackground component and are represented by open circles. The red curve is a three-body phase-space distribution, normalized in the left region (solid) after subtracting the yields from the corresponding two structures, and extrapolated to the right region (dashed line)[9].
3 Observation of the structures in the
J
/ψφ
mass spectrum
In 2009, the CDF collaboration has reported the evidence for a narrow structure near theJ/ψφ thresh-old in the exclusive B± → J/ψφK± decay [6, 7]. In 2011, the LHCb collaboration performed a similar search using the LHC data but did not confirm the CDF result [8]. In 2012, CMS performed an independent study using 5.2 fb−1of pp collision data collected at 7 TeV [9]. TheB±candidates were reconstructed in the decay channelB± → J/ψφK±, where J/ψ→ μ+μ−andφ→ K+K−. The
J/ψcandidates were reconstructed by combining two opposite sign muons which were selected by the HLT dimuon trigger. TheBsignal was reconstructed by combining the selected muon candidates with three charged tracks consistent with originating from the displacedJ/ψvertex. The total charge of the three tracks was required to be±1 and they were assigned with the kaon mass. Eachμ+μ−K+K−K±
combination was refitted imposing the five tracks from a common vertex and constraining theμ+μ− invariant mass to the nominalJ/ψmass. There are twoK+K−combination out of three charged kaons and only the one with lower mass was considered as aφcandidate. The reconstructed mass of the
K+K−pair was required to satisfy 1.008<m(K+K−)<1.035 GeV. These selection requirements were designed to maximize the signal yield and decided beforeJ/ψφmass spectrum was examined. The obtainedJ/ψK+K−K±mass spectrum for the selectedBcandidates for a mass differenceΔm<1.568 GeV, whereΔmis defined asm(μ+μ−K+K−)−m(μ+μ−), is shown in Fig. 2 (left). TheΔmrequirement is applied to eliminate theB0
s →ψ(2S)φ→ J/ψπ+π−φbackground at higher values ofΔm. The CMS
experiment reconstructed 2480±160(stat) B+candidates in this channel, which is the world’s largest sample to date.
To search for possible structures in the J/ψφmass spectrum, the dataset was separated into 20 MeVΔmbins from 1.008 to 1.568 GeV and the J/ψφK±mass distributions were fitted to extract theBsignal for eachΔmbin. A double Gaussian function was used for the signal and a 2nd order Chebychev polynomial was used for the background. The mean values of the two Gaussian signals were fixed to the nominalBmass, the width of the Gaussian and the relative fractions were fixed to the values obtained from the signal simulation. The obtainedΔmspectrum is shown in Fig. 2 (middle).
The mass and the widths values of the observed two structures were extracted by fitting the
fixed to the value obtained from simulation. The combinatorial background in each fit was modeled as a second-degree polynomial. The signal yields for the two structures are 310±70 (stat) and 418± 170 (stat). The mass and the width values of the two structures areΔm1=1051.3±2.4 (stat) MeV and
Γ1=28+−1511(stat) MeV; andΔm2=1217.1±5.3 (stat) MeV andΓ2=38+−3011(stat) MeV. The projection of the UML fit assuming two structures onto theJ/ψφmass spectrum is represented by the solid line in Fig.2 (middle).
Various tests to check the robustness of the observed structures were performed and no indication of possible bias was found. The event selection,Δmbinning, the background and signal models, the relative efficiency used to correct theΔmspectrum were varied. A different background subtraction method (sPlot technique) was used. TighterBselection was imposed to reduce the combinatorial background where the background is reduced by a factor of ten while keeping the 40% of theBsignal. TheΔmdistribution for the events that were eliminated (Δm > 1.568 GeV) to remove the effect of
B0
s background was also studied. This study was performed to make sure the eliminated events do
not cause reflections in the lowΔmregion. The study shows that, theΔmdistribution of events with
Δm>1.568 GeV is consistent with the prediction from the three-body phase-space hypothesis for the
non-resonant background after subtraction of theB0
s component. TheΔmspectrum, including non-B
candidates after subtractingB0
scontribution, is shown in Fig.2 (right).
Adding theJ/ψmass [10] to the extractedΔmvalues, the mass and width of theY(4140) are mea-sured to bem1=4148.0±2.4(stat)±6.3(syst) MeV andΓ1=28+−1511(stat)±19(syst) MeV. The measured mass and width values are consistent with the Y(4140) values reported by the CDF experiment [6]. The recent measurement performed by D0 confirms theY(4140) with a significance of 3.1σ[11]. In 2014, the Babar experiment reported a search ofY(4140) from the exclusive B decays, no significant signal was found. The upper limit is consistent with the branching fraction ofY(4140) reported by the CDF experiment [12].
4 Production of X(3872)
The spectroscopy of exotic mesons program performed at the CMS experiment includes the measure-ment of X(3872) production via decays toJ/ψπ+π−. Using 4.8 fb−1 data collected in 2011 at √s
=7 TeV, the CMS collaboration studied the production of X(3872) by measuring its cross sections times branching fraction, its prompt and non-prompt fraction, as well as the invariant mass spectrum ofπ+π−from X(3872) [13].
The ratio of the cross section times theJ/ψπ+π−branching fraction is measured from the X(3872) andψ(2S) signal events correcting for the acceptance and the efficiency, which are estimated from simulation:
R= σ(σ(pp→X(3872)+anyt.)· B(X(3872)→ J/ψπ+π−) pp→ψ(2S)+anyt.)· B(ψ(2S)→J/ψπ+π−) =
NX(3872)·Aψ(2S)·ψ(2S) Nψ(2S)·AX(3872)·X(3872)
(2)
The signal events for X(3872) andψ(2S) are separately extracted from the unbinned maximum-likelihood fits to theJ/ψπ+π−invariant mass spectrum. The signal for theψ(2S) resonance is mod-eled with two Gaussian functions with a common mean, and with a single Gaussian function for the X(3872). The non-resonant background is modeled as a second-order Chebyshev polynomial. Ac-ceptance and efficiencies are estimated from simulation, assuming that both X(3872) andψ(2S) are unpolarized andJPC of X(3872) is 1++ as measured by the LHCb experiment [14]. The cross
) [GeV] -π + π ψ (J/ T p
10 20 30 40 50
R 0.04 0.05 0.06 0.07 0.08 0.09 0.1 0.11 0.12
|y| < 1.2 = 7 TeV s CMS
-1 L = 4.8 fb
) [GeV] -π + π ψ (J/ T p
10 15 20 25 30
[nb/GeV] Β⋅ T /dp X(3872) prompt σ d -2 10 -1 10 1
|y| < 1.2 = 7 TeV s CMS
-1 L = 4.8 fb
LO NRQCD LO NRQCD uncertainty
) [GeV] -π + π m(
0.5 0.55 0.6 0.65 0.7 0.75 0.8
] -1 [GeV ππ /dm σ d σ 1/ 0 2 4 6 8 10 12 14 (non-resonant) -π + π ψ J/ → Simulation: X(3872) ρ ψ J/ → Simulation: X(3872) Data
> 10 GeV
T
p |y| < 1.25
= 7 TeV s CMS
-1 L = 2.1 fb
Figure 3.Ratios of the X(3872) andψ(2S) cross sections times branching fractions with acceptance corrections for the muon and pion pairs, as a function ofpT (Left). Prompt X(3872) production times branching fraction B(X(3872)→J/ψπ+π−) as a function ofpT. The inner error bars indicate the statistical uncertainty and the outer error bars indicate the total uncertainty (Middle). The acceptance and efficiency corrected dipion invariant mass spectrum for X(3872)→J/ψπ+π−(Right). The distribution is normalized dividing by the total cross section for 0.5<m(π+π−)<0.78 GeV [13].
The cross section times branching fraction for prompt X(3872) production is determined using the cross section ratio R, the non-prompt fraction, and CMS measurement of the promptψ(2S) pro-duction [15]. The measurement is performed differentially, as a function of transverse momentum up to 30 GeV within the rapidity range|y|<1.2. It is compared with predictions based on NRQCD factorization [16]. The predictions given in Ref. [16] are adapted to the phase space used in the CMS measurement. The comparison shows that although predictions describe the shape reasonably well, the predicted cross section is much larger than that in data. The CMS experiment measures the in-tegrated prompt X(3872) cross section times branching fraction in the kinematical region 10<pT<30 GeV and|y|<1.2 as 1.06±0.11(stat)±0.15(syst) nb. The NRQCD prediction for prompt X(3872) production is 4.01±0.88 nb [16] which is well above the CMS measurement. This CMS measurement is further discussed in various theoretical articles [17–20].
The invariant mass distribution ofπ+π−pair from X(3872)→J/ψπ+π−for the kinematical range 10<pT<50 GeV and|y|<1.25 (Fig. 3 right) is measured to further investigate the decay properties of the X(3872). The data are compared to signal simulations with and without intermediateρ0in the J/ψπ+π−decay. The study shows that the intermediateρ0decay (X(3872)→ J/ψρ0 → μ+μ−π+π−)
gives better description of the data.
Besides the results described above, the CMS experiment has also performed other studies of heavy meson production and spectroscopy. For instance, search for possible new bottomonium states decaying intoΥπ+π−decays [21], the measurement of theχb2 overχb1 cross section ratio [22], the branching fraction ofBc→ J/ψπ+andBc→J/ψπ+π+π−decays [23] and the doubleJ/ψproduction cross section [24]. The results are discussed in Ref. [25].
References
[1] CMS Collaboration, JHEP04, 033 (2012)
[2] CMS Collaboration, Phys. Rev. Lett.111, 101804 (2013)
[3] A. Hoecker, P. Speckmayer, J. Stelzer, J. Therhaag, E. von Toerne, and H. Voss, PoS ACAT
[4] Particle Data Group, Phys. Rev. D86, 010001 (2012) [5] LHCb Collaboration, JHEP04, 001 (2013)
[6] CDF Collaboration, Phys. Rev. Lett.102, 242002 (2009) [7] CDF Collaboration, [hep-ex/1101.6058] (2011)
[8] LHCb Collaboration, Phys. Rev. D85, 091103 (2012) [9] CMS Collaboration, Phys. Lett. B734, 261 (2014) [10] Beringer J. et al, Phys. Rev. D86, 010001 (2012) [11] D0 Collaboration, Phys. Rev. D89, 012004 (2014) [12] Babar Collaboration, [hep-ex/1407.7244] (2014) [13] CMS Collaboration, JHEP04, 154 (2013)
[14] LHCb Collaboration, Phys. Rev. Lett.110, 222001 (2013) [15] CMS Collaboration, JHEP05, 026 (2012)
[16] P. Artoisenet and E. Braaten,Phys. Rev. D81, 114018 (2010) [17] C. Hidalgo-Duque et al, [tt hep-ex/1305.4487].
[18] A. Esposito et al, [tt hep-ex/1305.0527]. [19] C. Meng et al, [tt hep-ex/1304.6710] [20] M. Butenschoen et al, [tt hep-ex/1303.6524] [21] CMS Collaboration, Phys. Lett. B72757-76 (2013)
[22] CMS Collaboration, Physics Analysis Summary CMS PAS-BPH-13-005 [23] CMS Collaboration, Physics Analysis Summary CMS PAS-BPH-12-011 [24] CMS Collaboration, JHEP09, 094 (2014)