Flow in data racks
Luk´aˇs Manoch1,a, Jan Matˇecha1,b, Jan Novotn´y1,c, Jiˇr´ı Noˇziˇcka1,d, and Petr Pohan2,e
1 CTU in Prage, Faculty of Mechanical Engineering, Department of Fluid Dynamics and Thermodynamics, Technick´a 4, Praha 6, Czech Republic
2 Conteg, spol. s r.o., Na V´ıtˇezn´e pl´ani 1719/4, Praha 4, Czech Republic
Abstract. This paper deals with the flow in data racks. The aim of this work is to find a new arrangement of elements regulating the flow in the data rack so that the aerodynamic losses and the recirculation zones were minimized. The main reason for solving this problem is to reduce the costs of data racks cooling. Another problem to be solved is a reverse flow in the servers, thus not cooled, occuring due to the underpressure in the recirculation zones. In order to solve the problem, the experimental and numerical model of 27U data rack fitted with 10 pieces of server models with a total input of 10 kW was created. Different configurations of layout of elements affecting the flow in the inlet area of the data rack were compared. Depending on the results achieved, design solutions for the improvement of existing solutions were adopted and verified by numerical simulations.
1 Aim/Motivation
The aim of the work was to reduce overall cooling costs in data centers. There are many studies and ways of deal-ing with the problem at the level of the whole data centers, or the elements constituting data centers. This paper fo-cuses on the level of data racks (27U) and servers (1U), specifically on the suction area of servers in the data rack. This include modification of the current state or equipment in the direction to reduce the effects of undesirable in-crease of energy consumption necessary for effective cool-ing of fitted components - the servers, in this particular case. The above mentioned undesirable effects can be de-scribed e.g. as recirculation zones, under-pressure areas or areas of flow separation.
2 Current state
Nowadays, there is an enormous increase in the number of data centers. In relation to this phenomenon, the techniques focused on reducing the energy consumption required for the operation of the data center are being developed [1] [2] [3]. The introduction of a completely new technique is usually very expensive and often impossible for already operating data centers. Due to the impossibility of imple-mentation of a new technique or technology for the ex-isting data centers, it is necessary to adjust or modify the current equipment. This approach has great limitations and the changes made must be easy to implement, if possible, without restriction of data rack operation.
There is a whole range of methods of cooling the data racks. From simple cooling of the whole data center room
a e-mail:[email protected] b e-mail:[email protected] c e-mail:[email protected] d e-mail:[email protected] e e-mail:[email protected]
(a very ineffective and energy consuming method) to sep-arated hot and cold aisles, where the suction and exhaust areas of servers are completely separated, thus leading to no mixing of hot and cold air. Another method of cooling is the creation, with the help of a side cooler and data rack, of closed area with a very effective cooling but higher cost of purchase.
One of the methods used most often is when the cold air is supplied to the lower part of the data rack and then enters the suction part to servers. Hot air is then collected from the room and cooled again. This type of cooling is a certain variation of the hot and cold aisle since there is no contact of hot and cold air. This kind of cooling was chosen to be the main subject of the paper as it is the most easily modifiable.
3 Data rack modification
In case of the type of cooling considered, the modification of data rack is relatively easy, as there is no direct inter-vention into the construction itself, but it is a modification or addition of other elements in the unused part of the data rack.
In the lower part of the data rack, at the cold air inlet, the cold air is directed to the suction area of servers with the help of a current corrector (figure 3). For the existing data rack, this element created both barrier to avoid cold air leakage to other data rack parts, and should somehow correct the direction of the inlet cold air flow. As a result of an improperly chosen geometry of the element, air flow separation occurred in the lower part of the data rack to the height of several 1U servers. In the area of that separation, the pressure dropped to such a value, that within the first few 1U servers air flow reverse occurred and hot air was sucked to the ”cold” aisle area from the rear part of the data rack. Appropriate modification of the geometry shape can almost eliminate this problem, or reduce at least the flow separation and eliminate the formation of the under-pressure area.
This is an Open Access article distributed under the terms of the Creative Commons Attribution License 2.0, which permits unrestricted use, distribution, and reproduction in any medium, provided the original work is properly cited.
C
Modifications have been made for two sizes of the cold air inlet to the suction area. The sizes were 1U and 3U where 1U (1 Unit) is a unit of measure based on American National Standard and its dimension is the multiple of 1.75 inches, i.e. 1.75· 25.4=44.45mm.
The modification was based on the current state and only adjusted the geometry of already used element. The implementation for already operating data centers is very simple and can be carried out under full operation.
The other modification leading to improvement of the air inlet to the suction area in the data rack is the use of data rack sides, which may serve as a side cooling zone. For such usage it is necessary to add additional elements to the lower part of the data rack for correct cold air supply. This solution will ensure the usage of the whole bottom part, or the lower part of the data rack. It is also necessary to add a wall preventing the cold air from entering the servers area. This will provide creation of space going over the whole length of the data rack, through which the cold air can be conducted to the suction area of the data rack. In view of the flow nature it is impossible to consider the whole space but only its proportional part with a recirculation zone as-sumed in the farther upper corner. But the zone is already included in the design, thus having no major impact on the final solution. At this point, another possible modification is outlined - limitation of entry of cold air to the recircula-tion zone.
The second modification, the ”side cooling zone” so-lution (figure 4), should lead to better cooling of servers in the upper part of the data rack. If we consider the case when data rack is fully fitted with 1U servers, an imperfect cooling of servers in the upper part of the data rack can oc-cur due to relatively small space in the suction area of data rack and full fitting. In the paper, we consider a 27U data rack that is fitted with ten 1U servers models. It is not the most critical model situation that would occur if the 42U data rack fully fitted with 1U servers was used.
Both designed modifications were modeled with the help of 3D CAD software in the first phase and placed into the real CAD model of the 27U data rack geometry. The reason for the model inclusion was the fact that all the measurement was carried out on real 27U data rack.
A numerical simulation had been performed before the particular modified elements were produced in order to find optimal shape for the corrector geometry both for 1U and 3U. The modification was based on observing the size and point of the flow separation and its subsequent mini-mization.
4 Numerical simulation
For numerical simulation, a simplified geometric model of the suction area of the data rack up to the area of the cold air inlet was created. The geometric model was simpli-fied at the level of bolted joints, holes for bolted joints, grounding and of closing mechanism. For all these ele-ments, the influence of the flow field was not assumed at a scale greater than negligible. As mentioned above, the model represented a 27U data rack and was evenly fitted with ten server models, thus using the whole height of the data rack. In order to obtain the reference values, the mod-els of current design were created, for which the numerical
simulation was carried out and the same parameters as for the modified versions were evaluated.
4.1 Computational mesh
The mesh for individual models was created from six-wall elements, in the whole volume of the mesh, including the area of boundary layer. The mesh was formed by the same procedure for each model and the same amount of ele-ments was used for particular modifications of current de-signs in order to eliminate the errors as a result of other mesh. All models solved had a common symmetry plane. This plane was used only for mesh generation due to elim-ination of error caused by asymmetrically formed mesh. The mesh was created in the Beta ANSA v13 program and subsequently exported in the format for ANSYS Flu-ent solver.
4.2 Solver setup
Numerical simulation of 3D problem was performed in the commercial solver ANSYS Fluent v14. Uniform bound-ary conditions were defined for solution of all the models above. It applied to pressure boundary condition for suc-tion points of servers, i.e. for each of ten points a nega-tive pressure value simulating suction effect of fans was defined. The value of the boundary condition was set to
−100Pa(this value is related to atmospheric pressure the value of which was 101325Pa). This boundary condition can be considered as an outlet boundary condition. For the inlet boundary condition, which was represented by ge-ometry at the bottom of the data rack, atmospheric pres-sure was defined. For the remaining geometric elements a boundary condition with zero velocity was defined.
For the solution itself the isothermal, viscous and in-compressible flow was considered. A pressure-based algo-rithm was used. For the spatial discretization an upwind scheme of second order was used and only steady solution was considered.
The given flow was assumed to have turbulent charac-ter, therefore a two-equation turbulencek−epsilonmodel was chosen - modification Realizable. The flow near the walls was solved using the wall functions according to cor-responding parametery+.
Several check points, monitors, were set, in which the stabilization of the monitored variables was being observed.
After the numerical verification that the modifications to the geometry of the current corrector are consistent with the assumption, the modified correctors were made and in-corporated to the experimental setup.
5 Experimental setup
Fig. 1.Scheme used for experiment measurement.
Fig. 2.Geometry of nozzle with positions for pressure sampling.
field, which consisted of eight fans, could be adjusted in-dependently. Thermal load of the server models was not considered within the whole experimental measurement. Another element of the experimental setup - a nozzle (fig-ure 2) - was designed for the meas(fig-urement, which was equipped with four pressure taps along the perimeter at the outlet. The data rack was placed on a box- the last ele-ment of the experiele-mental setup - to which the nozzle was attached. This box represented space that is situated in real data center, in which the cold air is being conducted. For all 12 compilations of the experimental setup 5 different pow-ers on fan fields for individual server models were mea-sured subsequently. These were 20 %, 40 %, 60 %, 80 % and 100 % of power of the fan field. All the server mod-els were simultaneously set to the same power. The mass flow throughout the whole setup was the main parameter of the whole setup to be evaluated. The parameter neces-sary for mass flow calculation was recorded with the help of pressure transducers during the entire measurement and subsequently its mean value was used for the calculation.
For each of the measured variants a zero pressure read-ing [Pa] was performed at the beginning and end of the
Fig. 3.Original used geometry and position for flow corectors.
measurement itself. The readings were performed due to measurement of values in the range of tens ofPaand the shift of zero reading at the end of the measurement in or-der of units ofPawould constitute an error in order of tens of %. If the zero pressure readings differed by more than 0.5 Paabsolutely at the beginning and at the end of the measurement, the measurement was repeated.
The individual measured variants were labeled with a four-sign code (KM0Afor example):
1. First position
– K - rounded deflector
– H - angular deflector 2. Second position
– M - small deflector
– V - big deflector 3. Third position
– 0 - without side cooling zones
– M - small side cooling zones
– V - big side cooling zones 4. Fourth position
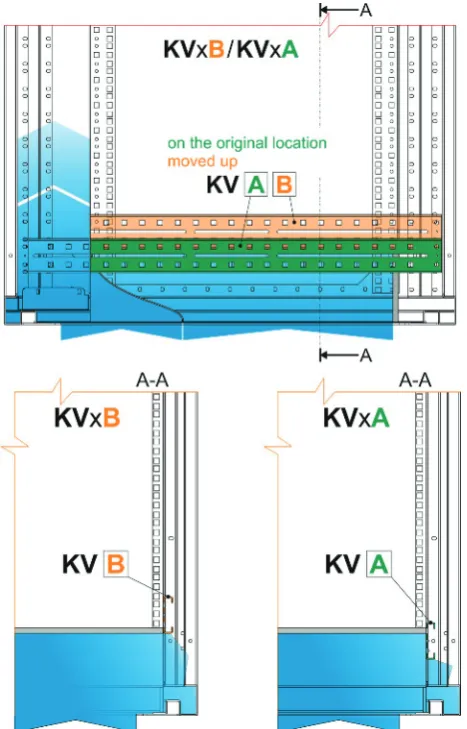
– A - brace at the original place
– B - brace shifted upwards
Fig. 4.Side cooling zones configuration for different position of side bar.
6 Experimental setup
In order to calculate the required mass flows ˙m[kgs−1] the following equation was used:
˙
m=ρAv, (1)
where the Bernoulli equation was used for defining the necessary additional variables:
p0 ρ +gh+
v2 0 2 =
p1 ρ +gh+
v2 1 2 +
v2 1
2ξnozzle, (2) where the indexesi=0,1 of pressurepi[Pa] and velocities vi[m s−1] represent the inlet, or outlet from the nozzle and the memberξnozzle[1] represents the minor loss of the noz-zle. Furthermore, during the measurement the temperature
t[◦C] at the nozzle inlet was being recorded, from which the densityρ[kgm−3] according to the equation of state of ideal gas was additionally calculated
ρ= p
rT, (3)
with specific gas constantr[J kg−1K−1] and temperature T [K]. The relation between the velocities was expressed by the continuity equation, defined as:
A0v0=A1v1, (4) where particular planesAi [m2] are related to the corre-sponding places.
Table 1.Measured configurations with 100 % of fan performance
Label pb dpnozzle p T m˙
[Pa] [Pa] [Pa] [◦C] [kgm−3]
KM0A 98000 17.7 -116.5 18.0 0.45 KV0A 97200 21.0 -87.4 19.4 0.49 HM0A 97200 16.6 -119.5 19.4 0.43 HV0A 97200 18.1 -97.1 19.8 0.45 KVVA 97400 25.0 -60.6 20.8 0.53 KMVA 97100 22.8 -86.4 19.5 0.51 KVVB 99760 27.0 -55.0 22.9 0.56 KMVB 99450 22.8 -93.1 21.6 0.51 KMMB 99050 22.2 -83.4 22.3 0.50 KVMB 99420 26.8 -57.8 21.9 0.56 KVMC 99760 27.9 -60.5 22.5 0.57 KMMC 99430 21.3 -88.6 21.0 0.50 KMVB 99450 22.8 -93.1 21.6 0.51 KVMB 99420 26.8 -57.8 21.9 0.56
Fig. 5.Mass flow rate for each configuration and different fans performance P.
7 Results
For the variants mentioned above, a power spectrum of fans were measured and the mass flows and pressure eval-uated (figure 5, figure 6). All results shown that modifi-cations made on flow correctors and addition side cooling zones increased mass flow rate throuht system. The biggest difference is about 20 % according to reference states, and as a reference states are considered current states, as we can see in table 1. For each measured case similar curve trend can be seen (figure 5). Modifications shifts curve just up without significant curve change. We can explain this by that we modified geometry and not whole model. For cor-rectors modfications most of cross sections in the flow path stayed preserved. From this point of view we did not ex-pect positive huge mass flow rate jump. Side cooling zones were added another volumes as a secondary flow path but the main reason were to supply more air to lower placed servers to eliminate back flow effect.
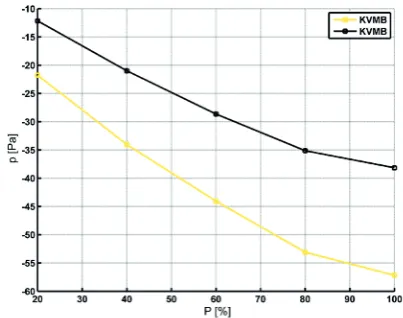
There were also measured pressure difference with and without using nozzle as we can see in figure 7. As can be seen the pressure lost for nozzle was form 10Pato 20Pa
Fig. 6.Pressure variation for each configuration and different fans performance P.
Fig. 7.Pressure variation for measurement with and without noz-zle with different fans performance P. (black - with nozzle, yellow - without nozzle)
8 Conclusion
For the given compilation and modified geometry of cor-rectors, it was proven that there is an increase in the mass flow throughout the whole setup. The impact of the side cooling zones was measured and evaluated leading to bet-ter distribution of air to the server suction area.
In case of modifying only the correctors an increase of mass flow throughout the whole setup was verified and should lead to reduction of costs connected with air distri-bution to the data rack. This modification is implementable in the current designs, even under full operation of the data rack. The addition of side cooling zones can further prove the air distribution to the servers but this kind of im-plementation is not easy to perform and it is more of an evolutionary element of the current designs.
9 Acknowledgment
Project (TA01010184/ Research and development solu-tions data racks, cooling and transport systems for data centers) is/was solved with the financial support of TA
ˇ CR.
References
1. L. Manoch, J. Noˇziˇcka and P. Pohan,EPJ Web of Con-ferences,Volume 25, (2012)
2. L. Manoch, J. Novotn´y and L. Nov´akov´a, 22nd
Interna-tional Symposium on Transport Phenomena, (2011) 3. L. Manoch, J. Matˇecha and P. Pohan,EPJ Web of