Available Online at www.ijcsmc.com
International Journal of Computer Science and Mobile Computing
A Monthly Journal of Computer Science and Information Technology
ISSN 2320–088X
IMPACT FACTOR: 6.017
IJCSMC, Vol. 5, Issue. 10, October 2016, pg.81 – 93
AN ENHANCEMENT OF CREDENTIAL
IMAGE USING VARIETAL FILTERING
TECHNIQUES WITH AND LACK OF NOISE
Dr. S. Gopinathan
1, Ms. S.Gayathri
21
Associate Professor, Department Of Computer Science, University of Madras, Chennai-600 005. 2
Research Scholar, Department Of Computer Science, University of Madras, Chennai -600 005. 1
[email protected]; 2 [email protected]
Abstract -- Document images are available in large numbers. These document images are ruined by defects like folding marks, ink flow, ink fade etc. The Earlier work focused on image enhancement with limited techniques like Total Variation Regularization and Non local means filtering technique. This paper deals with reducing of background noises and enhancing the characters of the document image. Enhancement of document images is carried out in two ways, by directly adding the filtering techniques to the output obtained from Total Variation Regularization whereas, the other method is like adding a distinct noise to a particular filter in random. Various noises like Salt, Salt and Pepper, Gaussian, Speckle, Poisson noises are added to Total Variation Regularization generated output image. The noise added image are then enhanced using various filters like Arithmetic Mean filter, LOG filter, Min filter, Max filter, Frost filter, Range filter used for purpose of removing noise from the image. Comparison of statistical parameters like MSE, PSNR, and SNR are carried and calculated for the output image obtained. The experimental results show the best filter for document image enhancement with or without noise.
Keywords --Total Variation Regularization (TV), Non Local means, Frost, Range, Max, Min, LOG, Arithmetic Mean, Salt, Gaussian, Speckle, Poisson, Salt and Pepper.
I. INTRODUCTION
Figure1. Denoising Concept
Bhimrao Patil [3] proposed that, an image containing salt-and-pepper noise will have dark pixels in bright regions and bright pixels in dark regions at random space. This type of noise can be caused by almost lost value of pixels, analogy-to-digital converter deficiencies, bit errors in transmission, fault in communication etc. The traditional filtering techniques such as mean median and average are available to remove the noise from an image one of the most often used is Gaussian filtering technique. I.pitas et.al [5] states that, Geophysical seismic interpretation is part of geophysical oil prospecting. It evaluates and analyses seismic reflection data, aiming at the detection of the position of hydrocarbon reservoirs. It provides a review of current efforts to automate, at least partially, seismic interpretation. DG Bailey et.al [6] conveys that, a local filter which uses the local-intensity sub range of pixel intensity values within a window. The range filter is an extension of the rank filter and has been found useful for detecting edges.
In this paper we propose a technique to study and analyze of enhancement of document images with some noises occurred due to time consumption since ancient period. Some methods of adding noises and removing noises with some filtered features are used to compare the generated results with existing results. Our proposed algorithm used in the system is proven to produce better results. The proposed system context of flow diagram is presented to show the flow structure of the system. Finally the Experimental results and conclusions are drawn from the system.
II. PROPOSED METHOD
A. Document Image enhancement with noise
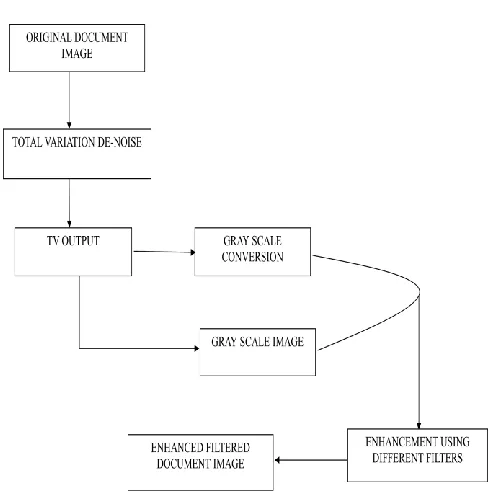
The original document image which is assumed as the input to the system belongs to historical periods; these images are taken as the original image for the purpose of enhancement. These images tend to have more defects due to improper handling of documents. The assumed input images are the output image obtained from Total Variation Regularization as the input image. TV denoise is that which helps in reducing the background noise and smoothen the character edges in the document. The TV flattens the background grey level values and highlights the character edges. The TV helps to smooth the edges by avoiding discontinuities. The output which is obtained from the Total variation denosing concept is taken as the base image for the work which is carried on. The output which is generated from the Total Variation concept is the base image for further document image enhancement. The assumed input image is converted into gray scale since the system accepts only the gray scale image. If the assumed image is an color image then the system requires to convert the input image to the gray scale image.
Figure2. Assumed input image
InFig2. (a) Original Image (b) TVR-method (c) Sharpened Image (d) Sharpened TVR-method.
After the conversion of the image, various noises like Salt, Salt and Pepper, Poisson, Gaussian and Speckle noise are added to the document image. This makes the document image corrupted to noise.
Figure3. Assumed input Image Added Salt Noise with Enhancement using Laplacian of Gaussian filter
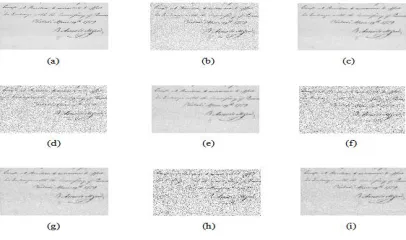
In Fig 3.(a) TV Regularization Image (b) Noisy image with SD 0.01 (c) LOG Filter with TV for 0.01 (d) Noisy image with SD 0.03 (e) LOG Filter with TV for 0.03 (f) Noisy image with SD 0.05 (g) LOG Filter with TV for 0.05 (h) Noisy image with SD 0.07 (i) LOG Filter with TV for 0.07
Figure 4. Assumed input Image Added Salt and Pepper Noise with Enhancement using Range filter
In Fig 4. (a) TV Regularization Image (b) Noisy image with SD 0.01 (c) Range Filter with TV for 0.01 (d) Noisy image with SD 0.03 (e) Range Filter with TV for 0.03 (f) Noisy image with SD 0.05 (g) Range Filter with TV for 0.05 (h) Noisy image with SD 0.07 (i) Range Filter with TV for 0.07
Figure 5. Assumed input image Added Poisson Noise with Enhancement using Frost filter
In Fig 5. (a) TV Regularization Image (b) Noisy image (c) Frost Filter with TV
Figure 6. Assumed input Image Added Gaussian Noise with Enhancement using TV Regularization
Figure 7. Assumed input Image Added Gaussian Noise with Enhancement using Non local means filter
In Fig 7. (a) TV Regularization Image (b) Noisy image with SD 0.01 (c) NL Filter Output for 0.01 (d) Noisy image with SD 0.03 (e) NL Filter Output for 0.03 (f) Noisy image with SD 0.05 (g) NL Filter Output for 0.05 (h) Noisy image with SD 0.07 (i) NL Filter Output for 0.07
Figure8. Assumed input image Added Speckle Noise with Enhancement using Max filter
In Fig 8. (a) TV Regularization Image (b) Noisy image with SD 0.01 (c) MAX Filter with TV for 0.01 (d) Noisy image with SD 0.03 (e) MAX Filter with TV for 0.03 (f) Noisy image with SD 0.05 (g) MAX Filter with TV for 0.05 (h) Noisy image with SD 0.07 (i) MAX Filter with TV for 0.07
Figure9. Assumed input image Added Speckle Noise with Enhancement using Min filter
In Fig 9. (a) TV Regularization Image (b) Noisy image with SD 0.01 (c) Min Filter with TV for 0.01 (d) Noisy image with SD 0.03 (e) Min Filter with TV for 0.03 (f) Noisy image with SD 0.05 (g) Min Filter with TV for 0.05 (h) Noisy image with SD 0.07 (i) Min Filter with TV for 0.07
Figure10. Assumed input image Added White Noise with Enhancement using Arithmetic Mean filter
In Fig10. (a) TV Regularization Image (b) Noisy image with SD 0.01 (c) AM Filter with TV for 0.01 (d) Noisy image with SD 0.03 (e) AM Filter with TV for 0.03 (f) Noisy image with SD 0.05 (g) AM Filter with TV for 0.05 (h) Noisy image with SD 0.07 (i) AM Filter with TV for 0.07
B. Block Diagram _1
Figure 11. Process flow of document Image enhancement with noise
C. Algorithm _1
1) Steps for Document Image Enhancement with Noise
1. Select the output image obtained from TV Regularization as the input image. 2. The output image is in grayscale format.
3. Add required noise to the grayscale image like Salt, Salt and Pepper, Gaussian etc. 4. The noise can be added as 0.1, 0.3…..
5. The noisy image is selected as the base image. 6. The filter process is carried out for the noisy image.
D. Document Image enhancement without noise
The process is same as that of document image with noise but, the only difference is instead of adding noise the document image is directly enhanced using various filters.
Figure 12. Assumed input image without noise
In Fig 12. (a) Original Image (b) TVR-method (c) TV with NL Method (d) Sharpened TVR-method (e) Sharpened TV with NL Method
Figure 13. Assumed input image without noise
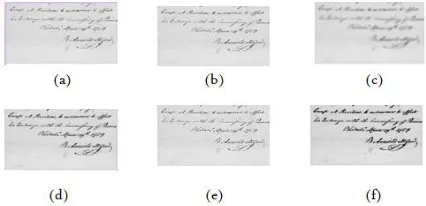
In Fig 13. (a) Original Image (b) TVR-method (c) LOG using NL Output (d) LOG using TV Output (e) Sharpened TV Image (f) Sharpened LOG using TV Output
Figure 14. Assumed input image without noise
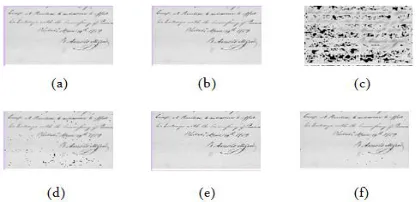
In Fig 14. (a) Original Image (b) TVR-method (c)Range Filter using NL Output (d) Range Filter using TV Output (e) Sharpened TV Image (f) Sharpened Range Filter using TV Output
In Fig 15. (a) Original Image (b) TVR-method (c)Min Filter using NL Output (d) Min Filter using TV Output (e) Sharpened TV Image (f) Sharpened Min Filter using TV Output
Figure 16. Assumed input image without noise
In Fig 16. (a) Original Image (b) TVR-method (c)Max Filter using NL Output (d) Max Filter using TV Output (e) Sharpened TV Image (f) Sharpened Max Filter using TV Output
Figure 17. Assumed input image without noise
In Fig 17. (a) Original Image (b) TVR-method(c)Arithmetic Mean Filter using NL Output (d) Arithmetic Mean Filter using TV Output (e) Sharpened TV Image (f) Sharpened Arithmetic Mean Filter using TV Output
Figure 18. Assumed input image without noise
E. Block Diagram _2
Figure 19. Process flow of document Image enhancement without noise
F. Algorithm _ 2
2) Steps for Document Image Enhancement without Noise
1. Select the output image obtained from TV Regularization as the input image. 2. The output image is in grayscale format.
3. If sharpening of image is required, perform the sharpening operation. 4. Perform the enhancement of the document image using the filter selected.
5. Calculate the MSE, SNR, and PSNR as performance measures to find out the quality of image. 6. Save the enhanced image.
III. EXPERIMENTAL RESULTS
To analyze the performance of the proposed system, we have implemented with noise and without noise of the assumed input images. The various noises such as salt, salt and pepper, Gaussian, speckle and Poisson noise with the level of noise variance has also been varied after selecting the type of noise level. Denoising is done using eight filters are Total Variation Regularization, Non Local Means Filter, LOG Filter, Range Filter, Frost Filter, Arithmetic Mean Filter, Min Filter and Max Filter. Results are shown through comparison among them. Also the comparison of all filters at different decomposition level has been discussed with and without noise. The results are reported in figures. In tables we have shown the MSE, PSNR, and SNR values and their pictorial representations are shown in their respected Graphs.
A. Signal-to-noise ratio (SNR)
Signal-to-noise ratio is defined as the ratio of the power of a signal (meaningful information) and the power of background noise (unwanted signal):
--- (1)
B. Decibels (dB):
Because many signals have a very wide dynamic range, signals are usually expressed using the logarithmic decibel scale. Based upon the definition of decibel, signal and noise may be expressed in decibels (dB) as
--- (2)
and
--- (3)
--- (4)
C. Peak Signal-to-noise (PSNR)
PSNR gives the ratio between possible power of a signal and the power of corrupting noise present in the image.
PSNR = 10 log 10 ( 2552 / RMSE ) ---- (5)
Higher the PSNR gives lower the noise in the image i.e. higher image quality.
D. Mean square error (MSE)
Mean Square Error (MSE) is given by
MSE =1/MN ∑M
i=1 (x, y ) ∑N j=1 (X(i, j) - P(i, j))2 ---(6)
Where, f is the original image F is the image denoised with some filter and N is the size of image.
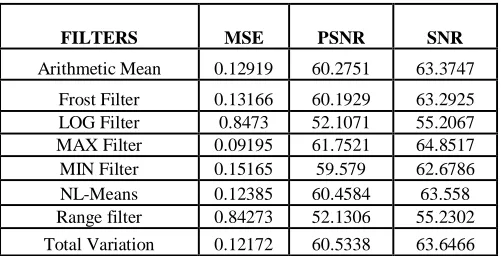
E. Tables and graphs
FILTERS MSE PSNR SNR
Arithmetic Mean 0.12919 60.2751 63.3747
Frost Filter 0.13166 60.1929 63.2925
LOG Filter 0.8473 52.1071 55.2067
MAX Filter 0.09195 61.7521 64.8517
MIN Filter 0.15165 59.579 62.6786
NL-Means 0.12385 60.4584 63.558
Range filter 0.84273 52.1306 55.2302
Total Variation 0.12172 60.5338 63.6466
Figure 20. Graphical representation for document image using various filters
FILTERS MSE PSNR SNR
sharpened AM Filter 0.128423 60.30104 63.42796 Sharpened Frost Filter 0.127696 60.32572 63.45263 Sharpened LOG Filter 0.831258 52.19012 55.31704 Sharpened MAX Filter 0.047014 64.66516 67.79207 Sharpened MIN Filter 0.183044 58.76193 61.88885 Sharpened Range filter 0.817215 52.26411 55.39103 Sharpened NL-Means 0.123645 60.46571 63.59262
Sharpened TV 0.120239 60.58703 63.7456
Table 2: showing the results for sharpened document image using various filters
Figure21. Graphical representation for sharpened document image using various filters
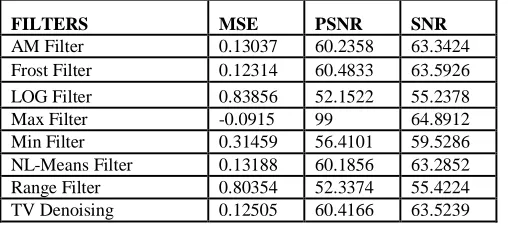
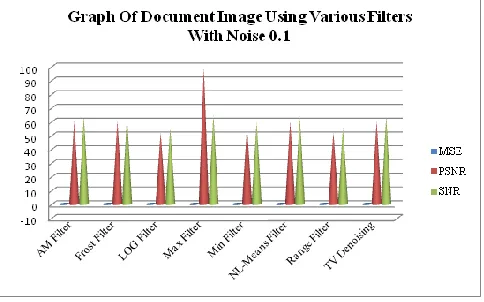
FILTERS MSE PSNR SNR
AM Filter 0.13037 60.2358 63.3424
Frost Filter 0.12314 60.4833 63.5926
LOG Filter 0.83856 52.1522 55.2378
Max Filter -0.0915 99 64.8912
Min Filter 0.31459 56.4101 59.5286
NL-Means Filter 0.13188 60.1856 63.2852
Range Filter 0.80354 52.3374 55.4224
TV Denoising 0.12505 60.4166 63.5239
Figure 22.Graphical representation for document image with noise 0.1 using various filters
FILTERS MSE PSNR SNR
AM Filter 0.135424 60.07054 63.1396
LOG Filter 0.820575 52.2463 55.30247
Max Filter -0.13919 99 62.98273
Min Filter 0.413934 55.21817 58.24994
NL-Means Filter 0.161235 59.3129 62.4125
Range Filter 0.728478 52.76331 55.82051
TV Denoising 0.135316 60.07398 63.0823
Table 4: showing the results for document image with noise 0.3 using various filters
Figure 23.Graphical representation for document image with noise 0.3 using various filters
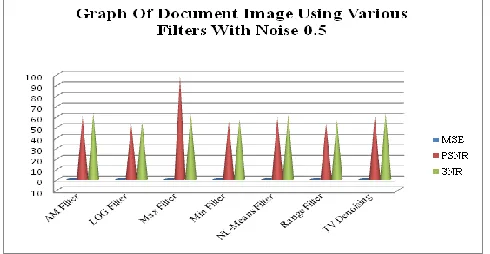
FILTERS MSE PSNR SNR
AM Filter 0.14094 59.8971 62.9147
LOG Filter 0.80463 52.3315 55.3652
Max Filter -0.1591 99 62.3017
Min Filter 0.4702 54.6647 57.5986
NL-Means Filter 0.18487 58.7187 61.8183
Range Filter 0.66141 53.1828 56.2144
TV Denoising 0.14466 59.7839 62.6916
Figure 24.Graphical representation for document image with noise 0.5 using various filters
Table 6: showing the results for document image with noise 0.7 using various filters
Figure 25.Graphical representation for document image with noise 0.7 using various filters
IV. CONCLUSION
The proposed work discuss about two methods of document image enhancement, the first method is adding different filters for document image enhancement and the other method is adding distinct noise to the document image for which a filter is selected. Experimental results suggest that MAX filter tends to have clearer document image enhancement compared to other filters with or without noise. MAX filter gives a clear statistical data for the document image which provides the clarity of the image. The filtering techniques are checked with different SD of noise. The above process is carried out on the output image produced by the TV (Total Variation Regularization) method. This yields clearer document image when compared to that of original image. We have compared our work with various other noises and filtering techniques which shows that Max filter is most efficient.
FILTERS MSE PSNR SNR
AM Filter 0.14534 59.7636 62.741
LOG Filter 0.78593 52.4336 55.435
Max Filter -0.1746 99 61.8125
Min Filter 0.50986 54.3129 57.1576
NL-Means Filter 0.20832 58.2002 61.2998
Range Filter 0.59069 53.6739 56.6776
REFERENCES
1. Laurencce Likformam-Sukem, Jerome Darbon, Elisa H. Barney Smith, “Enhancement of historical printed document images be combining Total Variation Regularization and Non-local Means filtering”,Image and Vision Computing 29(2011)351-363.
2. Mr. Rohit Verma, Dr. Jahid Ali, “A comparative study of various types of image and noise efficient noise removal techniques”, IJARCET, Volume 3, Issue 10, October 2013.
3. Bhimrao patil “An adaptive approach to retrieve images affected by impulse noise from documents “, IOSR-JCE volume 17, issue 3, (may-june 2015)pp 49-53
4. J. Serra, Image Analysis and Mathematical Morphology. New York: Academic, 1982.
5. I. Pitas and A. N. Venetsanopoulos “Nonlinear mean filter in image processing,” IEEE Trans. Acoust., Speech, Signal Process., vol. 34, pp. 573-584, June 1986.
6. DG Bailey, RM Hodgson”Range filters: Localintensity subrange filters and their properties”, Image and Vision Computing, Volume 3, Issue 3, August 1985, Pages 99–110
7. http://homepages.inf.ed.ac.uk/rbf/HIPR2/log.htm
8.
Jyoti Jaybhay and Rajveer Shastri,” A tudy on Speckle Noise Reduction Filters”, SIPIJ, Col.6, No.3, June 2015
9. A.Stella, Dr. Bhushan Trivedi,” Implementaion of some speckle filters on Digital Image and OCT image”, Volume 3, Issue 6, June 2013
10. Digital image processing (2 edition) by Rafael C. Gonzalez, Richard E. Woods., Prentice Hall , Upper Saddle River, New Jersey 07458.
AUTHORS PROFILE:
Dr.S.Gopinathan1working as an Associate Professor in the Department of Computer Science, University Of Madras, Chennai, India. He has 16 years of teaching experience for post graduate in the field of Computer Science and Research. He has published number of papers. He has produced 9 M.phil Scholars in the Computer Science, PhD Research Scholars are registered under him. He also has been serving as a panel member for various competitive examinations and universities. His interested area of research is Image Processing, Software Engineering.