R E S E A R C H
Open Access
Research on mud pulse signal data
processing in MWD
Bing Tu
1*, De Sheng Li
1, En Huai Lin
2and Miao Miao Ji
1Abstract
Wireless measure while drilling (MWD) transmits data by using mud pulse signal ; the ground decoding system collects the mud pulse signal and then decodes and displays the parameters under the down-hole according to the designed encoding rules and the correct detection and recognition of the ground decoding system towards the received mud pulse signal is one kind of the key technology of MWD. This paper introduces digit of
Manchester encoding that transmits data and the format of the wireless transmission of data under the down-hole and develops a set of ground decoding systems. The ground decoding algorithm uses FIR (Finite impulse response) digital filtering to make de-noising on the mud pulse signal, then adopts the related base value modulating algorithm to eliminate the pump pulse base value of the denoised mud pulse signal, finally analyzes the mud pulse signal waveform shape of the selected Manchester encoding in three bits cycles, and applies the pattern similarity recognition algorithm to the mud pulse signal recognition. The field experiment results show that the developed device can make correctly extraction and recognition for the mud pulse signal with simple and practical decoding process and meet the requirements of engineering application.
Keywords:MWD, Mud pulse signal, FIR, Mode similarity
Introduction
Data transmission under down-hole and data receiving on the ground are the key techniques in the wireless measure while drilling. At present the signal transmis-sion manners used in MWD mainly include the electro-magnetic wave and mud drilling fluid pressure wave [1]. The signal attenuation degree of the electromagnetic wave transmission signal becomes serious with the in-crease of the depth of the stratum, and the difference of the geological structure leads to different attenuation ex-tent of signal amplitude, thus the signal transmission rate can only be send with a low frequency and also in a short transmission distance [2]. The transmission rate of mud drilling fluid pulse signal possesses the characteris-tics of higher reliability and further transmission dis-tance compared with that of electromagnetic wave signal, so using mud drilling fluid pressure wave to com-municate is currently a common method used in MWD [3,4]. However, MWD signal transmission medium is
susceptible to be affected by all kinds of the outside noise [5], it’s a problem needing to be solved as soon as possible to extract useful signal from signal flooded by all kinds of noise. Literature [5] makes analysis of the pump noise, well drilling noise, pulse noise and trans-mitting noise in mud pulse signal. Literature [6] pro-cesses the mud pulse signal with wavelet transform and compares the signal by choosing different parameters to decompose and reconstruct seven kinds of common wavelet basic functions with the original signal, and choose the best wavelet base function proper to process the signal and its parameters according to the size of correlated coefficient. Literature [7] adopts the method of reversing pulse signal by linear filter algorithm, and based on this, uses a nonlinear “flat-roofed elimination” method to process the mud pulse signal. Literature [8,9] adopts related filtering wave processing method. The methods used in the above literature mainly focus on signal denoising, or rather mainly aim at processing sig-nal of the PLM [10] (pulse location managerment). Al-though the scheme using Manchester encode values is not a new idea,our contributions mostly lie in giving detailed signal flow,applying FIR filtering and pump * Correspondence:[email protected]
1
College of Mechanical Engineering and Applied Electronics Technology, Beijing University of Technology, Beijing 100124, China
Full list of author information is available at the end of the article
impulse noise elimination algorithm, introducing the pattern similarity recognition algorithm to the mud pulse signal recognition.
Wireless measure while drilling system System function
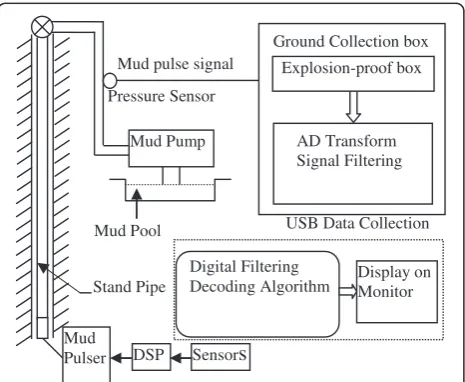
Figure 1 is the system diagram of the whole wireless meas-ure while drilling, when the mud pump above the down-hole opens, mud begins circulating, mud power generator under the down-hole begins to supply power for instru-ments under the down-hole. DSP under the down-hole collects parameters of gravity acceleration, magnetic field component and temperature, and then based on the data to be transmitted to implement Manchester encoding and at the same time controls actions of the corresponding pulse generator. The ground acquisition system collects the value of stand pipe pressure sensor and then imple-ments de-noising, and waveform recognition to timely dis-play of parameter value under the down-hole.
Down-hole data processing
Figure 2 is the diagram of MWD instrument under the down-hole. When instrument under the down-hole begin to work, it acquires gravity acceleration value GX/ GY/GZ, magnetic field component value BX/BY/BZ, and bottom temperature (Temp), receiving resistivity phrase (ATBCLX), amplitude PDBCHX, GAMMA and other parameters. And then process the acquired and received data with Manchester encoding and send mud pulse signal.
Down-hole data encoding
Manchester encoding rules is: in a bit cycle, data bits represented by the signal from high electricity level to
low level is “1”, and the contrary is “0”. Different data encoding has different digits, in order to improve the re-liability in working out the data, all the data encoding should accept parity check. The corresponding transmis-sion data encoding digit is shown in Table 1.
Down-hole data transmission principle
When down-hole instruments begin to work, the mud pulse signal is the Run-in pulse signal sent out 30s after the pump opens. Run-in pulse is used to ensure MWD measured in the stable voltage condition so as to ensure the accuracy of the measurement data, and Run-in pulse is also a time window for ground and down-hole com-munications, by opening or closing the pump, it can change the speed of data transmission of underground exploring tube. With different transmission rate,the number of Run-in pulse is also different; generally with transmission rate of 0.5 Hz the number of Run-in pulse is 10; with transmission rate of 0.8 Hz, the number of Run-in pulse is 16, and the binary code is“1”. FLAG sig-nal is a synchronous mark sigsig-nal,as for continuous send-ing of eight pulses, the binary code is“01111110”, in any
USB Data Collection Pressure Sensor
Stand Pipe
Mud pulse signal
Digital Filtering
Decoding Algorithm Display on Monitor
Mud
Pulser DSP Sensors Mud Pool
Mud Pump
Ground Collection box
AD Transform Signal Filtering Explosion-proof box
Figure 1Signal flow of MWD system diagram.The down-hole data transmission and ground data receiving and processing.
Bx
DSP Collectiong
and Decoding
Temperature
CAN protocol
By
Bz
ATBCLX
PDBCHX
GAMMA
Gx
Gy
Gz
Manchester
Encoding
Transmission
Well-down encoding
and transmission
Figure 2Signal flow of down-hole data collection and encoding.Down-hole DSP acquisiton sensor data and encoding, sending manchester encoding mud pulse signal.
Table 1 Data encoding length and the corresponding physical value
No Data name Date binary
effective
Measuring range
1 Temperature 7 50 ~ 308.53(°C)
2 X-magnetometer Base(Bx) 12 −0.585 ~ +0.585(Gause)
3 Y-magnetometer Base(By) 12 −0.585 ~ +0.585(Gause)
4 Z-magnetometer Base(Bz) 12 −0.585 ~ +0.585(Gause)
5 X-accelerometer Base(Gx) 9 −0.138 ~ +0.138G
6 Y-accelerometer Base(Gy) 9 −0.138 ~ +0.138G
7 Z-accelerometer Base(Gz) 12 +1.1 ~ -1.1G
time, as long as the ground system receives the synchro-nized signal, the ground system will stop all other signal detection work and concentrate on waiting for the next TAG signal. The aim of the signal is to ensure that the ground system, the time of down-hole instrument trans-mitting and receiving signal are consistent, and to pre-vent that the longer time may lead to wrong code or confuse code of the underground signal detected by the ground system and the sent practical signal which can lead to the failure of the data decoding. TAG signal is a mark signal format, and is composed generally by three pulses, and its binary code is from “000” to “111”, the TAG signal is followed by a group of data encoding in-formation, representing what kind of data the down-hole instrument is transferred upwards. After the ground sys-tem detects TAG signal, it should decode and calculate according to the set format of the code and finally ob-tain the measurement result. Down-hole data transmis-sions format is showed in Figure 3.
The ground data processing of wireless MWD system
Signal filtering wave
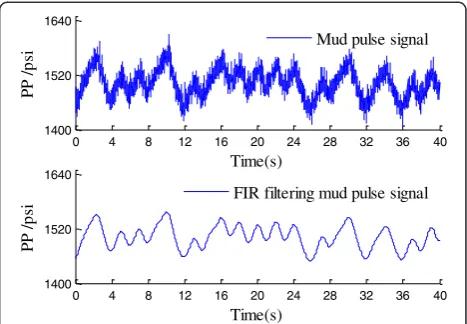
Due to the complex down-hole conditions, the mud pulse signal is disturbed in the transmission process by all kinds of noises which causes that the mud pressure wave signal collected by the ground acquisition system is with small amplitude but a lot of noise. It can be seen from the original waveform of mud pressure wave in Figure 4 that the collected mud pressure wave signal has larger high-frequency noise as well as lower frequency noise. Therefore, the pulse signal needs the filtering wave denoising process before it being recognized.
The commonly used digital filter methods include low pass, band pass, band resistance, full pass and high-pass. Considering transmission frequency of the mud pulse signal is 0.5 Hz, and the effective frequency of the mud pulse signal is 0.2 Hz ~ 1 Hz, noise frequency that the mud pulse signal contains is larger than 1 Hz; design a low-pass digital filter with 1 Hz cut-off frequency can
effectively eliminate noise signal. FIR digital filters have strict linear phase characteristic and good stability, and are convenient for programming and real-time signal processing. The mathematical expressions of FIR filters are:
y nð Þ ¼X nbþ1
i¼1
b ið Þx nð iþ1Þ ð1Þ
y(n) is filter output, x(n) represents input of the mud pulse signal,nb = 200, b(i)= 1/200. In the program
de-sign of VC++6.0, choosing the filtering data length as 200, i.e. the displayed waveform after filtering of the col-lected data is the pulse waveform colcol-lected one second before; if filter to signal processing is in one second, it can satisfy the real-time requirement. In Figure 4 the waveform after wave filter of mud pressure wave is the waveform after FIR de-noising, and it can be seen clearly from the de-noised waveform that the high frequency noise mixed in the signal gets eliminated.
TAG Signal Pump
on
RUN IN Pulse time
FLAG Signal
TAG Signal
TAG0 TAG1 . .. . .. TAG15
Figure 3Down-hole data transimission format.After pump on, sending Run-in pulse signal, and then send the FLAG and TAG format signals.
0 4 8 12 16 20 24 28 32 36 40
1400 1520 1640
Time(s)
PP /
p
si
Mud pulse signal
0 4 8 12 16 20 24 28 32 36 40
1400 1520 1640
Time(s)
PP /
p
si
FIR filtering mud pulse signal
Figure 4Mud pulse signal waveform and after FIR filtered wavfrom.The mud pulse signal include high frequency noise and low frequency noise. FIR filtering the high frequency noise of mud pulse signal.
0 4 8 12 16 20 24 28 32 36 40
1450 1500 1550 1600
Time(s)
PP /
p
si
Elimination base-value waveform signal
Figure 5Elimination pump impulse base-value wavefrom.
Pump impulse base-value adjustment
After the simple FIR low pass filtering algorithm, in Figure 4 the waveform after mud pulse wave filter exists base value drift caused by the pump impulse. Before the next step of effective waveform recognition it needs to eliminate base value drift. Adopt the related square wave
algorithm to adjust pump impulse base value, and math-ematical expressions for the value adjustment algorithm are:
z kð Þ ¼ 1 N
X
N1
n¼0
s nð Þy nð kÞ ð2Þ
s nð Þ ¼ 10 n¼1;. . .;N=2 n¼N=2;. . .;N
ð3Þ
Nis the sample point per second 200;y(n) is the value getting from the FIR digital filter algorithm; z(k)is out-put value of mud pulse signal after adjustment of base value. s(n) is related value of square wave. Figure 5 is waveform figure after adjustment of base value of wave-form after filter of mud pressure wave signal to Figure 4. It can be seen from Figure 6 that signal base value undu-lation has been effectively eliminated.
Modelling of mud pulse shape
The mode similarity measure algorithm is one of the most applied methods in current fuzzy mathematics
0 2 4 6 8 10 12 14
0 0.5 1 1.5 2
Time(s)
Am
p
li
tu
d
e
Manchester encode wave signal Signal mathematical model curve
D C
B A
Figure 6Manchester encoding wave and signal mathematical model curve.A bit cycle of the reference model curve can be expressed approximately by the following 4 kinds of A,B,C,D.
0 2 4 6
0 0.7 1.4
model-0
0 2 4 6
0 0.7 1.4
model-1
0 2 4 6
0 0.7 1.4
model-2
0 2 4 6
0 0.7 1.4
model-3
0 2 4 6
0 0.7 1.4
model-4
0 2 4 6
0 0.7 1.4
model-5
0 2 4 6
0 0.7 1.4
model-6
0 2 4 6
0 0.7 1.4
model-7
0 2 4 6
0 0.7 1.4
model-8
0 2 4 6
0 0.7 1.4
model-9
0 2 4 6
0 0.7 1.4
model-A
0 2 4 6
0 0.7 1.4
model-B
0 2 4 6
0 0.7 1.4
model-C
0 2 4 6
0 0.7 1.4
model-D
0 2 4 6
0 0.7 1.4
model-E
0 2 4 6
0 0.7 1.4
model-F
[11]; it can make reasonable classification of research data. Down-hole DSP processes the data needing to be sent with Manchester encoding, down-hole mud pulse generator receives DSP Manchester encoding signal and converts it to large current pulse needed for netic valve solenoid working and stimulates electromag-netic valve of pulse generator to work, so as to control the movement of piston of the pulse generator. When DSP implements Manchester encoding on data, if there exists consecutive data bits such as “11” or “00”, and if the signal waveform of the mud pulse continuously rise or continuous decline in the cycle of a bit, the continu-ous rising waveform is recognized as“1”and on the con-trary “0”. When the downhole pulse generator is at work, the standpipe pressure signal amplitude detected by the ground pressure sensor is affected by the move-ment delay of the electromagnetic valve, thus mud pulse signal has a slow rising or falling, which can be repre-sented approximately by the rising curve or declining curve. Curve in Figure 6 is the Manchester encoding sig-nal curve and reference model curve to identify mud pulse signal; mud pulse signal in a bit cycle of the refer-ence model curve can be expressed approximately by
the following 4 kinds of mathematical expressionsA(x,t), B(x,t),C(x,t),D(x,t). whereP(x) is mud pulse amplitude of x meters of mud pulse signal transmission length; it shows that the attenuation of mud pulse signal ampli-tude is related to transmitting velocity, mud density, air content, drill post parameter and other factors, corre-sponding to four shapes of A, B, C, D in a bit cycle in Figure 6. Randomly select signal model in three bits cycle of A, B, C, D as a kind of combination value, then 16 kinds of combinations of values can be acquired, and thus 16 different mathematical models can be acquired. Signal mathematical model in any bit period can be expressed by formula (9) [12]. Analyze the mud pulse signal in the period of three bits, and signals have 16 kinds of sample models as shown in Figure 7. Table 2 is the 16 kinds sample models binary data,
A xð Þ ¼;t P xð Þcosð2pitþpiÞ;x2½0;T ð4Þ
B xð Þ ¼;t P xð Þcos pið tÞ;x2½0;T ð5Þ
C xð Þ ¼;t P xð Þcos pið tþpiÞ;x2½0;T ð6Þ Table 2 Mud pulse signal sample model corresponding
the binary number
Category Binary data Category Binary data
Model-0 “000” Model-8 “010”
Model-1 “000” Model-9 “011”
Model-2 “111” Model-A “100”
Model-3 “111” Model-B “101”
Model-4 “001” Model-C “010”
Model-5 “001” Model-D “011”
Model-6 “110” Model-E “100”
Model-7 “110” Model-F “101”
Introduce the three bit period 16 sample model corresponding the binary number.
0 4 8 12 16 20 24 28 32 36 40
1450 1500 1550 1600
Time(s)
PP /
p
si Elimination base-value waveform signal
1450 1500 1550 1600
Time(s)
PP /
p
si Calculation sample waveform
Figure 8The interception 3 bit period waveform analysis.
1 2 3 4 5 6 7 8 9 10 11 12 13 14 15 16
0 0.2 0.4 0.6 0.8 1
wave model
NAG
Featuring nip angle cosine S
Figure 9Calculate value S.Sample and model calculate the featuring nip angle cosine. The X axis is the representative of wave model. The Y axis is the representative of NAG(Normalized acquaintance degrees).
1 2 3 4 5 6 7 8 9 10 11 12 13 14 15 16
0 0.2 0.4 0.6 0.8 1
wave model
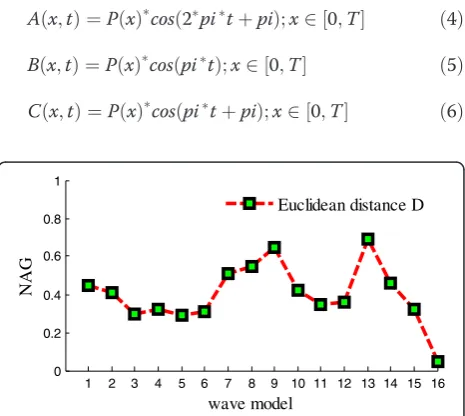
NAG
Euclidean distance D
D xð Þ ¼;t P xð Þcosð2pitÞ;x2½0;T ð7Þ
P xð Þ ¼Pð Þ0 exp x L
ð8Þ
Signal Model xð Þ ¼;t A xð Þ;tjjB xð Þ;t jjC xð Þ;t jjD xð Þ;t þA xð Þjj;t B xð Þ;t jjC xð Þ;t jjD xð Þ;t þA xð Þ;tjjB xð Þ;t jjC xð Þjj;t D xð Þ;t
x2½0;T ð9Þ
Pulse waveform recognition
After 16 kinds of sample model have being set, wave-form identification adopts the method of the mode simi-larity measure [13,14]. The characteristic vector of sample model is Xi = (xi1 xi2 . . .xin)T, after de-noising
and pump impulse base value elimination, characteristic vector of the mud pulse is Xj = (xj1 xj2 . . .xjn). The
method T of Euclidean distance Dij, nip angle cosine S
featuring value two and Tanimoto with value two char-acteristic are adopted to calculat degree between the two types of data.
Dij¼ jjXiXjjj2¼
Xn
k¼1
xikxjk
2
ð10Þ
S Xi;Xj
¼ ffiffiffiffiffiffiffiffiffiffiffiffiffiffiffiffiffiffiffiffiffiffiffiffiffiffiffiffiffiffiffiffiXiTXj XiTXi
XjTXj
q ð11Þ
T Xi;Xj
¼ XiTXj
XiTXiþXjTXjXiTXj
ð12Þ
The smaller Dij and the larger S and T denote the
more similar waveform between the two kinds of data. Based on the above theory using three kinds of recogni-tion algorithms to recognize the mud pulse waveform; Figure 8 is intercepted from data waveform after filter and base value processing; Figure 9, Figure 10, Figure 11 are got by calculating sample model separately with the Figure 9 test waveform with model similarity calculation value.
It can be read from Figure 9, Figure 10 and Figure 11 that after three kinds of model similarity measure calcu-lation, the minimum is got from No.16 waveform Dij
model, and the maximum in S and T. And the binary value of Figure 8 waveform data is “101”, through the above three kinds of mode similarity measure it can make effective recognition for the mud pulse signal.
1 2 3 4 5 6 7 8 9 10 11 12 13 14 15 16
0 0.2 0.4 0.6 0.8 1
wave model
NAG
Two value characteristic T
Figure 11Calculate value T.Sample and model calculate the two value characteristic. The X axis is the representative of wave model. The Y axis is the representative of NAG (Normalized acquaintance degrees).
The field experiment
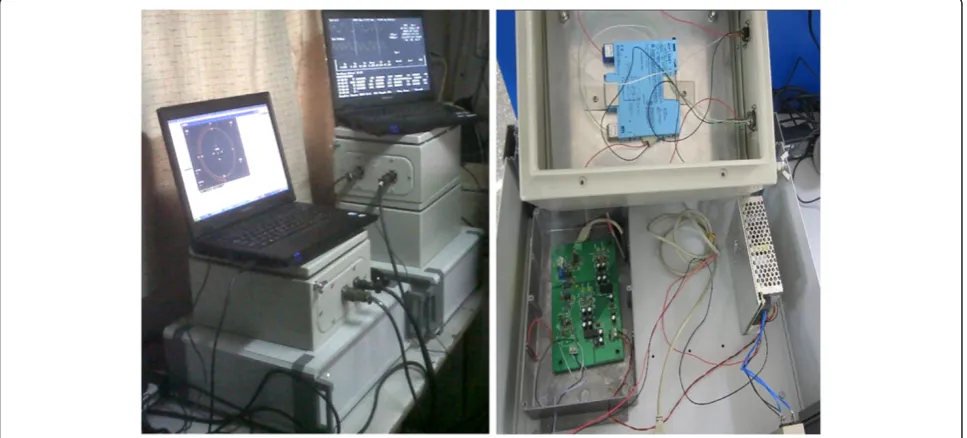
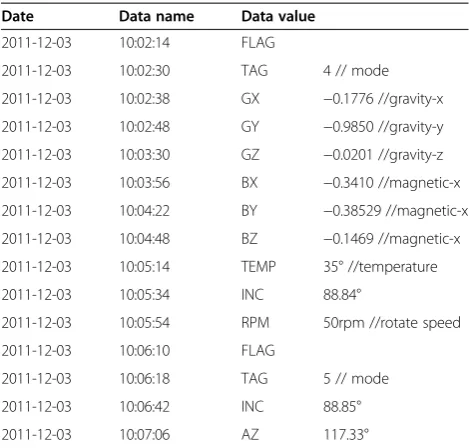
The algorithms of denoising and recognition are being made field experiment in north China oilfield; the field experiment instrument is showed in Figure 12, and part of the intercepted original data is shown below. Figure 12 is the working interface diagram of operating the decod-ing software of the denoisdecod-ing algorithm and recognition algorithm. The testing experiment in the field goes on uninterruptedly for almost one week; the target experi-mental mine is 3.5 km deep; the viscosity of mud is 10 m Pas; the experiment starts its directional measurement from 2 km. Table 3 is part of field experiment data.
Conclusion
(1) Make introduction of the whole system of MWD, down-hole Manchester encoding, and data
transmission format underground mud pulse signal. (2) Adopt the FIR filter algorithm to process the mud
pulse signal with de-noising, and based on this make use of related algorithm to eliminate the de-noised pump impulse base value.
(3) Set up the recognition model of the mud pulse signal model similarity, and adopt the model similarity recognition algorithm to recognize the mud pulse signal of Manchester encode in the three bit cycle.
(4) Through the field test verification, it can accurately solve all kinds of signal at the bottom with the characteristics of low rate code error and
convenient decoding operation which has a broad prospect in the mud pulse signal processing.
Competing interests
The authors declare that they have no competing interests.
Author details
1College of Mechanical Engineering and Applied Electronics Technology,
Beijing University of Technology, Beijing 100124, China.2Beijing Pulimen Electronic Science & Technology Co, LTD, Beijing 100041, China.
Received: 9 May 2012 Accepted: 31 July 2012 Published: 22 August 2012
References
1. YN Su, XR Dou, Measurement while drilling, logging while drilling and logging instrument (in Chinese). Oil Drill. Prod. Technol.27(1), 74–78 (2005) 2. J Han, QZ Chai, Digital signal processing method of signal detection for
remote-sensed mud-pulse measurement while drilling (in Chinese). J. Univ. PetroleumChina18(2), 96–101 (1994)
3. H Zhang, AZ Li, CW Li, JH Qu, QM Liao, Signal Processing of Wireless Measurement While Drilling Based on Discrete Stationary Wavelet Transform [J]. Petroleum Drilling Techniques35(2), 49–51 (2007). in Chinese 4. JH Zhao, LY Wang, LM Sheng, JJ Wang, Anonlinear method for filtering
noise and interference of pulse signal in measurement while drilling[J]. Acta Petrolei sinica29(4), 596–600 (2008). in Chinese
5. LAZ Zhang Heng, CW Li, JH Qu, QM Liao, Comparative study on mud-pulse signal processing methods[J]. Oil Drilling&Production Technology 29(2), 84–90 (2007). in Chinese
6. A Noureldin, D Irviner Halliday, MP Mintchev, Measurement while drilling surveying of highly inclined and horizontal well sections utilizing single axis gyrosensing system Meas. Sci. Technol15(12), 2426–2434 (2004) 7. C Wen Yuan, F Bin, W Yi,MWD drilling mud signal De-noising and signal
extraction research based on the pulse-code information. Proceedings of the 2010 International Conference on Wavelet Analysis and Pattern
Identification ( Qingdao, 11-14 July 2010), pp. 244–249
8. W Wang, GM Zhang, XH Wang, Voltage fluctuation detection and tracking based on adaptive filtering algorithm (in Chinese). Electric. Meas. Instrum.7 (48), 20–23 (2011)
9. DQ Feng, CF Sun, MR Fei, Research on a new LMS algorithm with variable steplength (in Chinese). Process Autom. Instrum.28(8), 67–69 (2007) 10. QJ Zhao, BJ Zhao, W Wang, Data processing techniques for a wireless data
transmission application via mud. EURASIP J. Adv. Signal Process1, 45 (2011)
11. WY Wang, YH Rong, YM Gong et al., Fuzzy clustering based identification and simulation for dynamic wave pattern of mould breakout. J. Syst. Simul. 4(15), 472–475 (2003)
12. Y Shen, J Zhu, YN Su, LM Sheng, L Li, Transmission characteristics of the drilling fluid pressure quadrature phase shift keying signal along a directional wellbore[J]. Acta Petrolei sinica2(32), 340–345 (2011). in Chinese 13. YZ Ni, Y Tian, A kind of fast template matching algorithm for wave
identification (in Chinese). Sensor World4, 31–33 (2006)
14. SS He, XS Liu, Analysis of signal attenuation for positive drilling fluid pulse (in Chinese). Oil Drill. Prod. Technol.6(24), 1–5 (2001)
doi:10.1186/1687-6180-2012-182
Cite this article as:Tuet al.:Research on mud pulse signal data processing in MWD.EURASIP Journal on Advances in Signal Processing2012
2012:182.
Table 3 The field experiment data
Date Data name Data value
2011-12-03 10:02:14 FLAG
2011-12-03 10:02:30 TAG 4 // mode
2011-12-03 10:02:38 GX −0.1776 //gravity-x
2011-12-03 10:02:48 GY −0.9850 //gravity-y
2011-12-03 10:03:30 GZ −0.0201 //gravity-z
2011-12-03 10:03:56 BX −0.3410 //magnetic-x
2011-12-03 10:04:22 BY −0.38529 //magnetic-x
2011-12-03 10:04:48 BZ −0.1469 //magnetic-x
2011-12-03 10:05:14 TEMP 35° //temperature
2011-12-03 10:05:34 INC 88.84°
2011-12-03 10:05:54 RPM 50rpm //rotate speed
2011-12-03 10:06:10 FLAG
2011-12-03 10:06:18 TAG 5 // mode
2011-12-03 10:06:42 INC 88.85°