Original Article
Evaluation on the changes of left ventricular structure
and diastolic function in patients with essential
hypertensions and left ventricular filling disorders
by real-time three-dimensional echocardiography
Cuihua Wang1,2*, Shuguang Wang3*, Zhirong Jiang4, Ying Wang5, Wei Zhu6
1Medical College, Qingdao University, Qingdao, Shandong, China; 2Department of Ultrasound, Affiliated Hospital
of Weifang Medical Univerisity, Weifang, Shandong, China; 3Department of Cardiology, Weifang People’s Hospital,
Weifang, Shandong, China; 4Department of Echocardiography, Affiliated Hospital of Qingdao University, Qingdao,
Shandong, China; 5Medical-Record Room, Affiliated Hospital of Weifang Medical Univerisity, Weifang, Shandong,
China; 6Department of Adult Heart Ultrasound, Guangdong General Hospital, Guangzhou, Guangdong, China.
*Equal contributors and co-first authors.
Received May 7, 2017; Accepted May 29, 2017; Epub August 15, 2017; Published August 30, 2017
Abstract: Objective: To evaluate left ventricular mass (LVM) and diastolic function in hypertension patients by Real-Time Three-Dimensional Echocardiograph (RT-3DE). Methods: A total of 50 healthy subjects (as control group) and
50 subjects with essential hypertension and left ventricular filling disorders (as hypertension group) were enrolled
in the study, and partial general echocardiographic parameters of their 17 regional left ventricular wall were
mea-sured by RT-3DE, including regional stroke volume (rSV), regional end-diastolic volume (rEDV), regional peak filling rate (rPFR), left ventricular peak filling rate (LVPFR), left interventricular septum, early and late diastolic peak ve -locity (Ea, Aa) of basal lateral (their ratio Ea/Aa was calculated), stroke volume (SV), left ventricular ejection frac-tion (LVEF),LVM and left ventricular end-diastolic volume (LVEDV). Results: One hundred cases acquired real-time three-dimensional images with clear endocardium boundary and 17 regional volume-time curves. Compared with the control group, LVPFR, Ea and Ea/Aa decreased, LVEDV, LVM and left ventricular myocardial mass index (LVMI)
increased in hypertension group, the differences were statistically significant (all P<0.001). The increase of LVM in
hypertension group was positively correlated with that of LVEDV (r=0.913). Conclusion: Compared with the normal population, decrease of left ventricular diastolic function and regional left ventricular wall diastolic dysfunction
ap-peared in patients with essential hypertensions and left ventricular filling disorders.
Keywords: LVM, RT-3DE, essential hypertensions and left ventricular filling disorders, echocardiographic param -eters
Introduction
Left ventricular diastolic function plays a vital role in patients with cardiovascular diseases (CVDs), especially in hypertensive heart dis-ease, coronary heart disease and heart failure [1]. Ventricular remodeling is the result of changes in the size, shape and function of the ventricle due to long-term pressure, volume overload and injury, and it is a process of over-all compensation, lesion repair, and secondary pathophysiological response in the ventricle. Echocardiography is one of the important methods for monitoring left ventricular function and ventricular remodeling [2].
Conventional echocardiographic assessment of regional left ventricular wall function lacks quantitative analysis methods. Recently, Real-Time Three-Dimensional Echocardiograph (RT- 3DE) in evaluation of left ventricular function can obtain volume-time curves of various seg-ments of ventricular wall rather than relying on geometrical assumptions, thereby making a more accurate measurement of the function of each segment [3, 4].
accu-racy of ventricular remodeling between healthy people and hypertensive heart disease pa- tients.
Materials and methods
Subjects
Patients with essential hypertensions and left
ventricular filling disorders in our hospital were
enrolled in this study. Inclusion criteria of hyper-tension group: (1) In accordance with diagnos-tic criteria of hypertension by echocardiogra-phy, other clinical examinations and by WHO in 1999; (2) Patient with abnormal left ventricular
filling detected by routine three-dimensional
echocardiography; (3) No liver, kidney, lung or other organ lesions; (4) Hypertension patient without special treatment or irregular medica-tion (not taking antihypertensive drugs during the measurement); (5) Patient cooperating with the corresponding examinations.
Inclusion criteria of healthy control group: (1) No previous history of CVDs; (2) Two consecu-tive times of blood pressure measurement at
quiet rest and both measured values <140/90
mmHg (1 mmHg=0.133 kPa); (3) Sinus rhythm as the results of routine electrocardiographic examination; (4) Routine three-dimensional echocardiography indicating no cardiac
struc-ture or abnormal blood flow; (5) No liver, kidney,
lung or other organ lesions; (6) Patients cooper-ating with the corresponding examinations. The same instruments and methods were adopted to collect and analyze in the two groups. This study was approved by the Medical Ethics Committee of our hospital and had signed informed consent for participation in the study.
Instruments
X3-l matrix three-dimensional probe was used for RT-3DE examination. The images were per-formed quantitative analysis by Philips IE33 Color Doppler Ultrasound Imager (1-3 MHz, built-in QLab 4.2 analysis software).
Left ventricular wall segmentation
Left ventricular wall segmentation method: according to the method recommended by Cardiac Imaging Committee of American Heart Association (AHA) and the anatomical charac-teristics of coronary artery blood supply, through standardized myocardial segmentation
for cardiac tomographic imaging, the cardiac muscle was divided into 17 segments as fol-lows: (1) Apex (cardiac muscle of the farther bottom of ventricle cavity); (2) Apical segments (lower part of the papillary muscle to the bot-tom of the ventricular cavity): apical lateral, api-cal anterior, apiapi-cal septal, apiapi-cal inferior; (3) Mid-cavity segments (area of the entire papil-lary muscle): mid anterior, mid anteroseptal, mid inferoseptal, mid inferior, mid inferolateral, mid anterolateral; (4) Basal segments (area of mitral annulus to the top of the end-diastolic papillary muscle): basal anterior, basal antero-septal, basal inferoantero-septal, basal inferior, basal inferolateral, basal anterolateral [5].
Collection and analysis of images
Collection of images
The subjects were asked to lie in the left-lateral position and keep a smooth breathing. Routine scanning of each prethoracic section was per-formed. Meanwhile, 2-lead electrocardiogram was recorded. The parameters were recorded as follows: left ventricular end-diastolic volume (LVEDV), left ventricular ejection fraction (LVEF), stroke volume (SV), early diastolic peak velocity (Ea) and late diastolic peak velocity (Aa). The ratio of Ea and Aa (Ea/Aa) was calculated, and then subjects were performed DTI examina-tions. Doppler velocity of PW-DTI was ranged of ±20 cm/s and the sampling volume was 9.4 mm. PW-DTI sampling volume was placed at the left ventricle lateral wall and interventricu-lar septum in apical four chamber view and Ea, Aa and Ea/Aa of mitral annulus were measured. Placing the X3-l matrix three-dimensional probe at the apex, “full volume” mode in apical four chamber view was started until an appearance of biplane image. At the same time, the place of the probe was adjusted until a satisfying appearance of the contours of the epicardium and endocardium. Triggered by electrocardio signal, four consecutively collected cardiac cycles with 15°*60° narrow-angle “cake piece” stereo images shaped 60°*60° wide-angle “Pyramid”-shaped three-dimensional data-base, and then the images were stored in the built-in hard disk [6].
Analysis of images
through the quarter image format. In the image, a, b and c were three mutually perpendicular sections (a: apical four chamber view, it could be manually adjusted by the green lines in b and c; b: apical two chamber view, it could be manually adjusted by the red lines in a and c; c: papillary muscle short axis view, it could be manually adjusted by the blue lines in a and b). By the adjustment, it insured to get a left ven-tricular three-dimensional image with the larg-est left ventricular long axis. Regarded image a and b as basic planes, the left ventricular end-diastolic and end-systolic phases were deter-mined by electrocardiogram. Marking the posi-tion of mitral annulus and left ventricular apex respectively, the software would automatically outline the left ventricular endocardium,
mak-ing it more fit to the actual endocardium bound -ary through manual adjustment. Adjusting it when papillary muscle and ventricular wall were connected, QLab 4.2 3D QAdvanee software would automatically generate a volume-time curve of left ventricle, thereby getting the results of end-diastolic volume (EDV), and SV. The volume data of each time point were recorded. And the result of dv/dt = (Vt2-Vt1)/(t2 -t1) was calculated manually, and left ventricular
peak filling rate (LVPFR) = (diastolic maximum
dv/dt)/EDV. The parameters were from 17 regional volume-time curve, including regional
peak filling rate (rPFR), regional end-diastolic
volume (rEDV) and regional stroke volume (rSV). All image analyses were performed by blind method independently [7].
Observation indexes
Indexes of three-dimensional echocardiogra-phy including LVPFR, Ea, Aa, Ea/Aa, SV, LVEF, left ventricular mass (LVM), left ventricular myocardial mass index (LVMI) and LVEDV were observed and compared between patients with
hypertension and left ventricular filling disor -ders and healthy people. Meanwhile, rSV and
Statistical processing
The measurement data were expressed as _x ± s. SPSS 13.0 software was used for the correla-tion analysis. The comparison of the differenc-es between the two groups’ measurement data was performed by t test with two independent samples. Chi-square test was used for the anal-ysis of gender and other count data. Linear cor-relation analysis was performed to analyze the correlation between LVM and LVEDV changes in patients with hypertension and left ventricular
filling disorders. The differences were statisti
-cally significant when P<0.05.
Results
General information
In the hypertension group, 50 cases of patients
with hypertension and left ventricular filling dis -orders were in accordance with the inclusive criterion, including 34 males and 16 females, aging 37-80 years old with an average age of 57.01±9.88. In the control group, a total of 50 healthy subjects were selected, including 32 males and 18 females, aging 35-75 years old with an average age of 55.34±7.29. Other relat-ed personal information is shown in Table 1, and the comparison of these information had
no statistical significance (P>0.05).
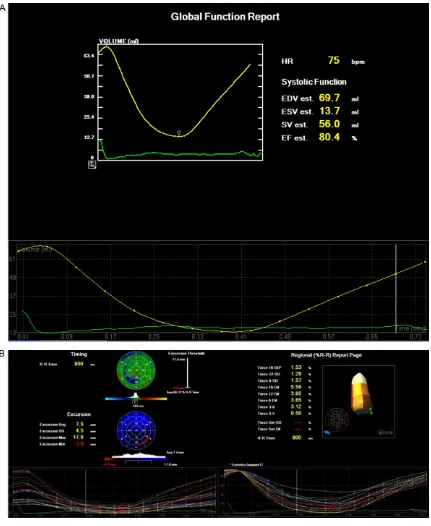
Qualitative research
Seventeen regional left ventricular curves and clear left ventricular volume-time curves had been obtained from the 100 subjects under-went RT-3DE (Figure 1). From the volume-time curves, the curves of control group were in an ordered arrangement and with consistent ups and downs, the time points of minimal end systolic volume of all segments were able to approximately form a straight line. While the curves of the hypertension group were disor-Table 1. Comparison of patients’ general information in two
groups
Number
of cases (years old)Age Height (cm)
Gender Male Female
Hypertension group 50 57.01±9.88 162±3.6 34 16
Control group 50 55.34±7.29 163±5.5 32 18
X2/t 0.961 -1.076 0.182
P value 0.339 0.285 0.673
rPFR of 17 regional left ventricle were observed and compared between patients with
hyperten-sion and left ventricular filling
disorders and healthy people. Besides, the linear correlations between LVM and LVEDV changes of patients with hypertension and
left ventricular filling disorders
[image:3.612.89.360.97.177.2]Figure 1. Qualitative research. A: Normal left ventricular volume-time curve; B: Normal regional left ventricular curve.
dered and the time points of minimal end dia-stolic volume had large differences.
Quantitative research
Through RT-3DE examination, it found that co- mpared with the control group, LVPFR, Ea and Ea/Aa of hypertension group decreased, while
Aa, LVEDV, LVM and LVMI of that increas-
Table 2. Comparison of the indexes of RT-3DE between hyperten-sion group and control group
Item Hypertension group Control group t P
LVPFR (ml/s) 148.43±8.23 217.34±12.31 -32.906 <0.001
Ea (m/s) 0.61±0.06 0.78±0.09 -11.113 <0.001
Aa (m/s) 0.78±0.07 0.66±0.08 7.982 <0.001
Ea/Aa 0.74±0.03 1.20±0.03 -76.667 <0.001
SV 45.13±3.93 46.26±4.12 -1.403 0.164
LVEF (%) 60.05±4.63 61.82±4.83 -1.871 0.064
LVM (g) 133.34±34.69 109.78±26.71 3.805 <0.001
LVMI (g/m2) 105.23±10.64 81.42±7.86 12.727 <0.001
LVEDV (ml) 130.66±54.88 83.94±27.85 5.368 <0.001
basal anterolateral (P=0.015), apical lateral (P=0.043), apical inferior (P=0.029) in 17 regional left ventricle were of statistical differ-ences between control group and hypertension group, and their EDV of hypertension group was higher than that of control group. The rPFR of basal anterolateral (P=0.004), mid anterior (P=0.012), basal inferolateral (P=0.017), mid an-teroseptal (P=0.001), mid inferoseptal (P=0.032), mid inferior (P=0.009), apical an- terior (P=0.027), mid anterolateral (P=0.018), apical inferior (P=0.035) and apical lateral (P=0.026) in 17 regional left ventricle of hyper-tension group were apparently lower than those of control group (Table 3).
Correlation analysis
The results indicated that compared with the control group, LVM and LVEDV of hypertension group increased. And the correlation analysis found that the changes of LVM in hypertension group were positive related to those of LVEDV (r=0.913). See Figure 2.
Discussion
Hypertension patients are often associated with ventricular remodeling and left ventricular diastolic function changes [8]. Ventricular re- modeling refers to the changes in myocardial function and organ’s characteristic, which re- sults from the changes of ventricular structure. Diastolic dysfunction of hypertension patients can occur before the obvious abnormalities in myocardial structure, which is caused by car-diomyocyte dysfunction and isovolumic
diastol-ic abnormality, and will have signifdiastol-icantly
ef-fects on myocardial diastolic function [9]. The main pathological changes caused by essential hypertension in the left ventricle are
cardio-of filling velocity caused by diastolic dysfunc -tion [12]. Diastolic func-tion of regional left ven-tricular wall plays an important role in the whole diastolic function of the left ventricle [13]. Although left ventricular diastolic dysfunction can be sensitively measured by these parame-ters, its routine application in clinical practice is limited due to itsinvasion [14].
Non-invasion RT-3DE is not only easy to oper-ate but also fast in imaging, and it can immedi-ately show the three-dimensional structure of the heart. With its accurate evaluation of car-diac function and good repeatability, it better meets the clinical application requirements. Left ventricular volume-time curve technique can accurately measure the local systolic and diastolic function of left ventricular myocardi-um, which provides a certain basis for clinical diagnosis and treatment. RT-3DE, as a new ultrasound technology, can obtain rPFR and rEDV values in each segment through the regional volume-time curve, so as to quantify the segment diastolic function [15, 16]. In addi-tion, the early decrease in left ventricular dia-stolic function can also be assessed by RT-3DE volume-time curve parameter (LVPFR) [17]. This study, through the comparison of three-dimensional echocardiography between hyper-tension patients and healthy people, found that
there were significant differences in diastolic
function in the two groups. RT-3DE detection
found that there were of significant differences
in LVMI and LVM between hypertension patients and healthy people, which indicated the chang-es of left ventricular structure; and there also existed differences between hypertension pa- tients and healthy people by calculating LVPFR with three-dimensional volume. The results we- myocyte hypertrophy, riboso- me increase, golgibody enlar- gement, etc., thereby making
the changes of cardiac config -uration, especially the
chang-es of left ventricular configura -tion [10, 11]. It has recently found that, among the hyper-tension patients without
sig-nificant left ventricular hyper
-trophy, left ventricular filling
re consistent with traditional two-dimensional
echocardiographic detection findings [18].
Studies have found that the SV of patients with hypertension was lower than that of healthy people [19]. However, the study results sug-gested that the trend that the SV of hyperten-sion patients was lower than that of normal
people measured by RT-3DE, but the difference
was not statistically significant. It may because
[image:6.612.96.523.96.359.2]RT-3DE was mainly three-dimensional volume imaging and there may be some errors in its measurement for SV, thus it needs to increase the sample size and improve the measurement method to carry out further clinical research. Through the comparison of rSV, rPFR and rEDV in 17 regional left ventricle between healthy people and patients with hypertensive heart disease, it was found that most of rEDV and rSV in their left ventricles were not statistically dif-ferent. There were differences in rSV of left ven-tricular mid anterior and apical inferior between hypertension patients and healthy people; there were differences in rEDV of left ventricu-lar basal anterolateral, apical inferior, mid anterolateral and apical lateral. A large part of segmental rPFR in left ventricle of hypertension patients showed a weakening trend, with a weakening trend of middle segment as the most obvious condition.Peripheral resistance, arterial pressure and other after loads of hyper-tension patients increased in contrast to healthy people. Its myocardial movement has always been in a high power state, leading to a decrease in diastolic function of the heart [20, Table 3. Comparison of rSV, rEDV and rPFRin 17 left ventricular segmentation of healthy people and
hypertension patients with left ventricular filling disorders
Segment
rSV (ml) rEDV (ml) rPFR (ml/s)
Control group Hypertension group Control group The experimental group Control group Hypertension group
Basal anterior 4.94±0.92 5.01±2.35 8.58±2.64 8.62±3.05 21.64±2.95 19.94±5.31
Basal anteroseptal 2.85±1.67 3.06±2.27 5.84±1.05 5.91±2.74 7.45±4.86 6.32±1.05
Basal inferoseptal 2.42±1.05 2.03±1.35 5.04±1.04 4.73±1.91 5.56±2.31 5.32±3.76
Basal inferior 2.43±0.83 2.06±1.32 4.77±1.23 4.68±1.74 5.82±1.53 5.45±2.97
Basal inferolateral 2.63±1.53 3.17±1.63 3.01±3.01 6.28±3.32 9.53±5.14 6.32±3.10*
Basal anterolateral 4.62±1.83 5.36±2.95 7.37±3.06 10.25±4.06* 24.98±14.84 10.06±4.27*
Mid anterior 2.26±1.27 3.69±2.26* 4.88±2.94 6.05±3.26 8.78±4.56 5.17±3.06* Mid anteroseptal 2.95±1.74 3.06±2.88 4.52±1.47 4.68±3.32 6.83±4.36 5.38±2.17* Mid inferoseptal 2.74±0.84 2.48±1.26 4.75±1.63 4.17±1.74 11.05±2.37 5.62±2.48*
Mid inferior 1.97±0.64 2.31±1.05 3.75±0.73 4.12±1.72 5.83±2.06 4.36±0.92*
Mid inferolateral 2.58±1.42 2.49±1.85 4.55±2.16 5.38±2.53 6.53±6.73 5.92±3.06
Mid anterolateral 3.04±1.74 3.58±2.17 4.76±2.96 7.58±3.17* 10.05±7.32 7.02±3.99*
Apical anterior 1.39±0.84 1.62±1.69 1.96±0.86 2.53±1.92 3.92±2.31 2.81±1.38*
Apical septal 1.51±0.58 1.68±1.04 2.39±0.79 2.19±1.26 3.94±2.01 3.74±1.03
Apical inferior 1.28±0.31 1.92±1.03* 2.01±0.29 2.82±1.21* 4.85±2.28 2.93±0.73*
Apical lateral 1.56±0.89 1.95±1.53 2.01±1.05 3.48±1.49* 5.32±4.83 3.16±2.17*
Apex 1.84±0.58 1.92±0.62 3.26±0.76 3.57±0.94 5.49±2.36 4.65±1.87
Note: Compared with control group, the P value of rSV, rEDV and rPFR of all segments was as *P<0.05.
[image:6.612.90.288.395.591.2]21]. The research results indicated that left ventricular wall and ventricular septal diastolic amplitude reduction and varying degrees of concentric hypertrophy in patients with
hyper-tension, and their rSVs were significantly lower
than those in control group. There appeared the decrease phenomenon in most of the seg-ments in the diastolic function of hypertension patients. Studies have shown that LVM was determined by left ventricular wall thickness and cavity size [22].
The results of this study showed that LVEDV, LVM, and LVMI in hypertension patients were
significantly higher than those in control group,
indicating that LVM and cardiac function injury of hypertension patients could be shown by RT-3DE. In this study, the correlation between LVEDV and LVM was investigated and it found
that LVEDV increased significantly with the
increase of LVM with a positive relation. There- fore, this study believed that, the increased weight of ventricle during left ventricular remod-eling can lead to the expansion of the left ven-tricular cavity.
Disclosure of conflict of interest
None.
Address correspondence to: Zhirong Jiang, De-
partment of Echocardiography, Affiliated Hospital of
Qingdao University, No. 59 Haier Road, Laoshan District, Qingdao 266000, Shandong, China. Tel: +86-0532-82913192; Fax: +86-0532-82913192; E-mail: jiangzhirongkaa@163.com
References
[1] Peterson GE, De BT, Contreras G, Wang X, Ken-drick C, Greene T, Appel LJ, Randall OS, Lea J and Smogorzewski M. Relationship of left ven-tricular hypertrophy and diastolic function with cardiovascular and renal outcomes in African Americans with hypertensive chronic kidney disease. Hypertension 2013; 62: 518-525. [2] Capoulade R, Clavel MA, Le Ven F, Dahou A,
Thébault C, Tastet L, Shen M, Arsenault M, Bédard É and Beaudoin J, O’Connor K, Bernier M, Dumesnil JG, Pibarot P. Impact of left ven-tricular remodelling patterns on outcomes in patients with aortic stenosis. Eur Heart J Car-diovasc Imaging 2017; [Epub ahead of print]. [3] Cui C, Liu L, Fan T, Peng B, Cheng Z, Ge Z, Li Y,
Liu Y, Zhang Y and Ai F. Application of real-time three-dimensional echocardiography to evalu-ate the Pre- and postoperative right ventricular
systolic function of patients with tetralogy of fallot. Acta Cardiol Sin 2015; 31: 345-352. [4] Sung KT, Yun CH, Hou JY and Hung CL. Solitary
accessory and papillary muscle hypertrophy manifested as dynamic mid-wall obstruction and symptomatic heart failure: diagnostic fea-sibility by multi-modality imaging. BMC Cardio-vascular Disorders 2014; 14: 34.
[5] Liang X, Garnavi R, Wail S, Sisi Liang and Prasanna P. Automatic segmentation of the left ventricle into 17 anatomical regions in car-diac MR imaging. Conf Proc IEEE Eng Med Biol Soc 2015; 2015: 6531-6535.
[6] Chen FL, Hsiung MC, Nanda N, Hsieh KS and Chou MC. Real time three-dimensional echo-cardiography in assessing ventricular septal defects: an echocardiographic-surgical correl-ative study. Echocardiography 2006; 23: 562-568.
[7] Yosefy C, Laish-Farkash A, Azhibekov Y, Khala-meizer V, Brodkin B and Katz A. A new method for direct three-dimensional measurement of left atrial appendage dimensions during trans-esophageal echocardiography. Echocardiogra-phy 2016; 33: 69-76.
[8] Iua V, Khadzegova AB, Ivanova SV, Iushchuk EN, Shkol’Nik EL, Gabitova RG, Sinitsyna IA and Matveeva OS. Relationship between the structure-functional state of the heart and brain natriuretic peptide level in patients with arterial hypertension. Kardiologiia 2012; 52: 19-23.
[9] Rodrigues JC, Amadu AM, Dastidar AG, Szan-tho GV, Lyen SM, Godsave C, Ratcliffe LE, Burchell AE, Hart EC, Hamilton MC, Nightingale AK, Paton JF, Manghat NE, Bucciarelli-Ducci C. Comprehensive characterisation of hyperten-sive heart disease left ventricular phenotypes. Heart 2016; 102: 1671-9.
[10] Asbach S, Hartmann M, Wengenmayer T, Graf E, Bode C and Biermann J. Vector selection of a quadripolar left ventricular pacing lead af-fects acute hemodynamic response to cardiac resynchronization therapy: a randomized cross-over trial. PLoS One 2013; 8: e67235-e67235.
[11] Hill LS, Monaghan M and Richardson PJ. Re-gression of left ventricular hypertrophy during treatment with antihypertensive agents. Br J Clin Pharmacol 1979; 7 Suppl 2: 255S-260S. [12] Oishi Y, Miyoshi H, Iuchi A, Nagase N, Ara N
and Oki T. Negative impact of cardiovascular risk factors on left atrial and left ventricular function related to aortic stiffness. Circ J 2013; 77: 1490-1498.
cell infusion in acute myocardial infarction: the REGENERATE-AMI clinical trial†. Eur Heart J 2016; 37: 256-263.
[14] Mariano-Goulart D, Piot C, Boudousq V, Racz-ka F, Comte F, Eberlé MC, Zanca M, Kotzki PO, Davy JM and Rossi M. Routine measurements of left and right ventricular output by gated blood pool emission tomography in compari-son with thermodilution measurements: a pre-liminary study. Eur J Nucl Med 2001; 28: 506-513.
[15] Li DY, Liang L, Cao GK, Xia Y, Xu TD, Chen J, Wang XP and Chen JH. Real-time three-dimen-sional echocardiographic evaluation of left ventricular systolic synchronicity in patients with chronic heart failure: comparison with tis-sue doppler imaging. J Clin Ultrasound 2012; 40: 410-418.
[16] Fei HW, Ali MT, Tan TC, Cheng KH, Salama L, Hua L, Zeng X, Halpern EF, Taghian A and Mac-donald SM. Left ventricular global longitudinal strain in HER-2 + breast cancer patients treat-ed with anthracyclines and trastuzumab who develop cardiotoxicity is associated with sub-sequent recovery of left ventricular ejection fraction. Echocardiography 2016; 33: 519-526.
[17] Chen CK, Cifra B, Morgan GJ, Sarkola T, Slor-ach C, Wei H, Bradley TJ, Manlhiot C, Mccrindle BW and Redington AN. Left ventricular myocar-dial and hemodynamic response to exercise in young patients after endovascular stenting for aortic coarctation. J Am Soc Echocardiogr 2015; 29: 237-246.
[18] Ge XY, Shao L and Zheng ZL. [Assessment right atrial function in patients with systemic lupus erythematosus by speckle tracking and three-dimensional echocardiography]. Zhonghua Yi Xue Za Zhi 2016; 96: 3815-3818.
[19] Alonsofernández A, Garcíarío F, Arias MA, Me-diano O, Pino JM, Martínez I and Villamor J. Obstructive sleep apnoea-hypoapnoea syn-drome reversibly depresses cardiac response to exercise. Eur Heart J 2006; 27: 207-215. [20] Oldham WM, Lewis GD, Opotowsky AR,
Wax-man AB and Systrom DM. Unexplained
exer-tional dyspnea caused by low ventricular filling
pressures: results from clinical invasive car- diopulmonary exercise testing. Pulm Circ 2016; 6: 55-62.
[21] Meluzin J, Spinarová L, Hude P, Krejcí J, Dusek L, Vítovec J and Panovsky R. Combined right ventricular systolic and diastolic dysfunction represents a strong determinant of poor prog-nosis in patients with symptomatic heart fail-ure. Int J Cardiol 2005; 105: 164-173. [22] Bang CN, Gerdts E, Aurigemma GP, Boman K,
De SG, Dahlöf B, Køber L, Wachtell K and
De-vereux RB. Four-group classification of left ven -tricular hypertrophy based on ven-tricular
con-centricity and dilatation identifies a low-risk