International Journal of Scientific Research in Computer Science, Engineering and Information Technology © 2018 IJSRCSEIT | Volume 3 | Issue 1 | ISSN : 2456-3307
Performance Analysis of OpenGL Java Bindings with Graphics
Scan Conversion Algorithms
Naresh Purohit*1, Rajendra Purohit2
*1 Department of Computer Science Engineering, Mits - Jadan , Pali, Rajasthan, India
2 Research Scholar, Rajasthan Technical University, Kota, Rajasthan, India
ABSTRACT
This paper presents a Performance Analysis of OPNGL with Java bindings i.e. Light Weight Java Game Library (LWJGL).Three different sections, i.e. Line Rendering, Circle Rendering, and Image Rendering have been selected as the benchmarks for extensive analysis of the performance gaps between the two. The results show the performance of LWJGL with rendering algorithms to display from a single pixel to some large images in the screen on the basis of execution time analysis. LJWJGL is a Java-Binding of OPENGL that enables developing portable, interactive 2D and 3D graphics applications.
Keywords: OpenGL, LWJGL, Rendering, Pixel, Java Bindings.
I.
INTRODUCTION
The Computer Graphics is one of the most effective and commonly used methods to communicate the processed information to the user. It displays the information in the form of graphics objects such as pictures, charts, graphs and diagram instead of simple text.
In computer graphics, pictures or graphics objects are presented as a collection of discrete picture elements called pixels. The pixel is the smallest addressable screen element.[4]
A. Rendering
Rendering is the process of generating an image from a model, by means of a software program. The model is a description of three dimensional objects in a strictly defined language or data structure. It would contain geometry, viewpoint, texture and lighting information.
Figure 1. Rendering Process Block Diagram
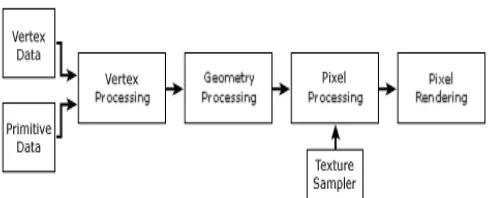
The image is a digital image or raster graphics image. The term may be by analogy with an "artist's rendering" of a scene. 'Rendering' is also used to describe the process of calculating effects in a video editing file to produce final video output
Figure 2. OpenGL Flow Diagram
II.
RENDERING OBJECTS
In this paper, the rendering is done on linear and non-linear objects. In linear objects, straight line algorithms and for non-linear objects, circle algorithms are analysed.
A. Line Drawing
A line drawing algorithm is a graphical algorithm for approximating a line segment on discrete graphical media. On discrete media, such as pixel-based displays and printers, line drawing requires such an approximation (in nontrivial cases). Basic algorithms rasterizing lines in one color. A better representation with multiple color gradations requires an advanced process, spatial anti-aliasing. A line connects two points. It is a basic element in graphics. To draw a line, we need two points between which we can draw a line.
A.1 LSI Algorithm
The Cartesian slope-intercept equation for a straight line is with m representing the slope of the line and b as the y intercept. [5]Given that the two endpoints of a he segment are specified at positions (x1, y1) and (x2, y2), as shown in Fig. , we can determine values for the slope m and y intercept b with the following calculations:
Figure 3. Drawing points on Graph by Line Equation Y=MX+B
Step 1: Calculate dx = x2-x1 dy = y2-y1; m = dy/dx; b = y1-m*x1;
Step 2: check if if(m<=1) Then
Calculate y=m*x+b
For loop x1 to x2 times each iteration Draw pixel(x,y) position
Else Calculate x = (1/m)*y+b;
For loop y1 to y2 times each iteration Draw pixel(x,y) position
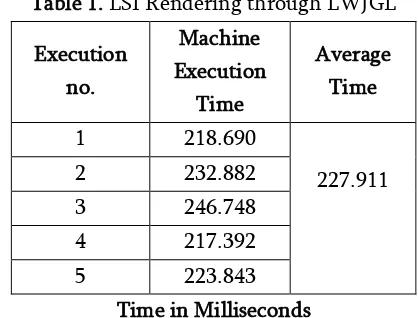
Table 1. LSI Rendering through LWJGL
Execution no.
Machine Execution
Time
Average Time
1 218.690
227.911
2 232.882
3 246.748
4 217.392
5 223.843
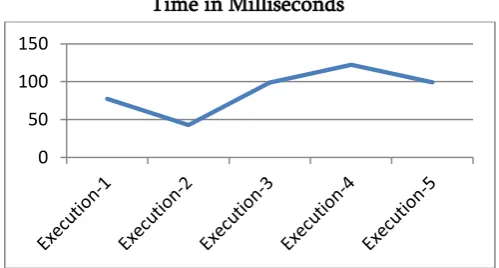
Chart 1. LSI Rendering through LWJGL
A.2 DDA Algorithm
The digital differential analyser (DDA) is a scan-conversion line algorithm based on calculating either dy or dx. Using dx or dy, We sample the line at unit intervals in one coordinate and determine corresponding integer values nearest the line path for the other coordinate.[6] you need to identify the number of steps to put pixel. If dx > dy, then you need more steps in x coordinate; otherwise in y coordinate.
if (absolute(dx) > absolute(dy)) Steps = absolute(dx);
else
Steps = absolute(dy);
Step 4: Calculate the increment in x coordinate and y coordinate.
Xincrement = dx / (float) steps; Yincrement = dy / (float) steps;
Step 5: Put the pixel by successfully incrementing x and y coordinates accordingly and complete the drawing of the line.
for(int v=0; v < Steps; v++) x = x + Xincrement; y = y + Yincrement;
putpixel(Round(x), Round(y));
Table 2. DDA Rendering through LWJGL
Execution
Chart 2. DDA Rendering through LWJGL
A.3 Bresenham's Line Algorithm
The Bresenham algorithm is another incremental scan conversion algorithm. The big advantage of this algorithm is that, it uses only integer calculations. Moving across the x axis in unit intervals and at each step choose between two different y coordinates.[1]
Step 1: Input the two end-points of line, storing the left end-point in (x0,y0)(x0,y0).
Step 2: Plot the point (x0,y0)(x0,y0).
Step 3: Calculate the constants dx, dy, 2dy, and (2dy – 2dx) and get the first value for
the decision parameter as − p0=2dy−dx
Step 4: At each Xk along the line, starting at k = 0, perform the following test −
pk+1=pk+2dy−2dx
Step 5: Repeat step 4 (dx – 1) times.
For m > 1, find out whether you need to increment x while incrementing y each time.
Table 3.Bresenham's Line Rendering through LWJGL Execution
no.
Machine Execution Time
Average Time
1 100.419
106.6434
2 100.257
3 103.189
4 119.704
5 109.648
Time in Milliseconds
Chart 3. Bresenham's Line Rendering through LWJGL
B. Circle Drawing
B.1 Circle Equation Drawing
The circle is a frequently used component in pictures and graphs, a procedure for generating either full circles or circular arcs is included in most graphics packages. More generally, a single procedure can be provided to display either circular or elliptical curves.
A circle is defined as the set of points that are all at a given distance R from a center position (Xc, Yc) . This distance relationship is expressed by the Pythagorean Theorem in Cartesian coordinates as
(X-Xc)2+(Y-Yc)2 = R2
Figure 4. Basic Circle Equation Drawing
for(x = -r; x <= r; x++)
y= SquareRoot of (r * r - (x * x));
Draw Pixel(xc+x,xc+y) forThe upper half DrawPixel(xc+x,yc-y) for the lower half
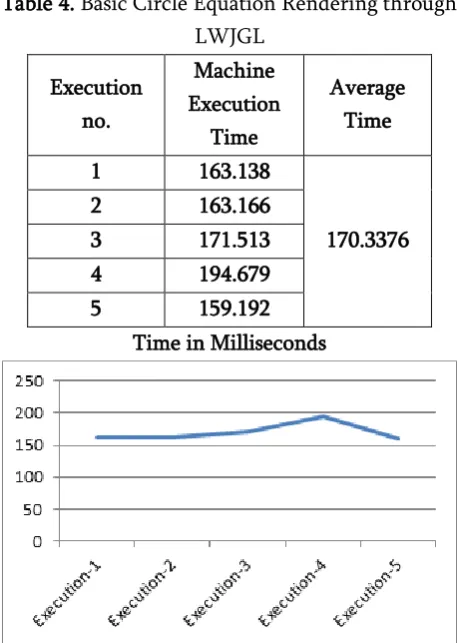
Table 4. Basic Circle Equation Rendering through LWJGL
Execution no.
Machine Execution
Time
Average Time
1 163.138
170.3376
2 163.166
3 171.513
4 194.679
5 159.192
Time in Milliseconds
Chart 4. Basic Circle Equation Rendering through LWJGL
B.1 Bresenham's Circle Drawing
the pixel for the y = 1 row. We must make a decision between two candidate points.[2]
Figure 5. Eight Way Symmetry Step 1: Set X = 0 and Y = R
Call Draw Circle(Xc, Yc, X, Y) [End of While] Exit
Table 5. Bresenham's Circle Rendering through LWJGL
Chart 5. Bresenham's Circle Rendering through LWJGL
III.
CONCLUSION
In this paper, there are two section of different performance analysis on OpenGL. Three algorithms are used to render lines, two algorithms are used to render circles pixel by pixels. In our test and analysis, we measures actual execution time for rendering objects on the screen by Light Weight Java Game Library. By this analysis we can develop large level graphics applications like high definition games and many more. Thus JWJGL, a java programming binding for OpenGL seems to be a better choice for developing games and other graphics applications where achieving as high performance as possible is the main priority.
IV.
FUTURE WORK
Computer graphics is used today in many different areas of industry, business, government, education, entertainment, and most recently, the home. The list of applications is enormous and is growing rapidly as computers with graphics Capabilities become commodity products. OpenGL is presently used to produce both accurate and schematic representations of geographical and other natural phenomena from measurement data. Examples include geographic maps, relief maps, exploration maps for drilling and mining, oceanographic charts, weather maps, contour maps, and population-density maps. These algorithms for object drawings probably to create 2D and 3D graphs of mathematical, physical, and
economic functions; histograms, bar and pie charts, task-scheduling charts, inventory and production charts.
V.
REFERENCES
[1].Development of the Bresenham’s Line Algorithm, Alfred L. McKinney , K.K. Agarwal, Department og Computer Science, Louisiana state university in Shreveport , Shreveport , LA 71115
[2].A Fast Bresenham Type Algorithm For Drawing
Circles by John Kennedy Mathematics Department Santa Monica College 1900 Pico Blvd. Santa Monica, CA 90405.
[3].LWJGLTextures,
http://thecodinguniverse.com/lwjgl-textures/
[4].Computer Graphics, Principles and Practice, Second Edition, by James D.Foley, Andries van Dam, Steven K. Feiner, John F. Hughes, Addison- Wesley
[5].Improved Line Drawing Algorithm: An Approach
and Proposal, Muhammad.Usman khan & Prof (Dr) Md.Rizwan Beg, Integral University Lucknow, India.
[6].Prof. Sukhendu Das Dept. of Computer Science and Engineering Indian Institute of Technology, Madras Lecture - 13 Scan Converting Lines, Circles and Ellipses.
[7].OpenGL Programming Guide: The Official Guide
to Learning OpenGL, Version 2 by Dave Shreiner
[8].Learning Java Bindings for OpenGL (JOGL) by Gene Davis